Start with EdrawMind Desktop Guide
User Guide for PC
-
Get Started
-
Topics
-
Notes & Knowledge Base
-
Symbols
-
Layout
-
Theme and Style
- Change and Customize the Theme
- Change Topic Font
- Theme Color and Colored Branch
- Hand-Drawn Style
- Change Background and Add Watermarks
- Change Text Style and Color
- Change Topic Shape and Border
- Change Topic Colors
- Change Styles of Topic Shadows
- Change Branch Style
- Adjust Topic Margins and Topic Text Width
- Change Connector Style
- Format Painter and Style Follows
-
AI & OCR
-
Outline Mode
-
Slides Mode
-
Brainstorming Mode
-
Mind Map Gallery
-
Task Management Tips
-
Document Operations
-
View Mind Map
-
Open, Save, Share and Print
-
Real-time Collaboration
Set Gantt Chart Options
If you're using EdrawMind's Gantt chart view, you can easily adjust how elements appear, like start and end dates, time, and date format. Control how you see the project's duration, divided into days, weeks, or months. The time unit you select depends on how detailed you need the Gantt chart to be.
For instance, select hours if you are working on a project with many short-term tasks. For longer projects, months or even years work better. You can edit these elements through the Gantt chart option feature. Follow these steps to customize your Gantt chart settings:
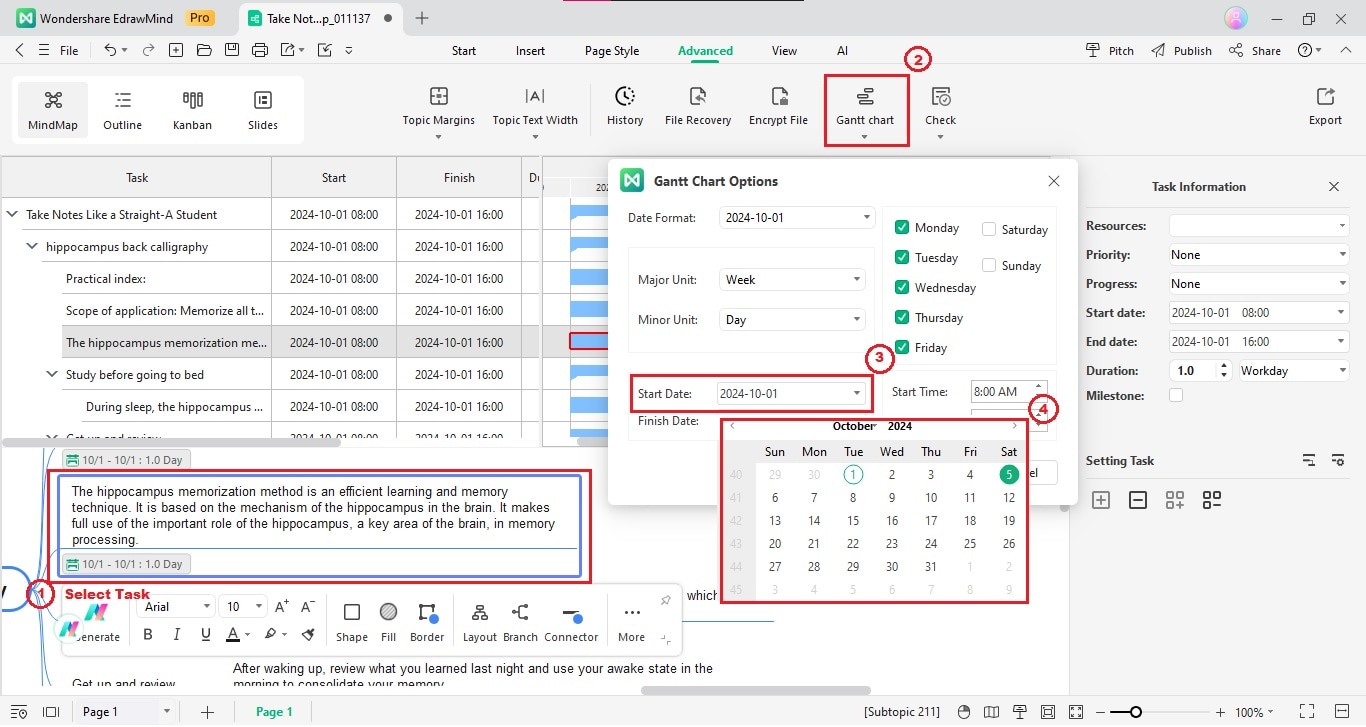
Step 1Open the Gantt Chart view, then click the Gantt Chart Option in the upper navigation pane. It will open the Gantt Chart Options pop-up window.
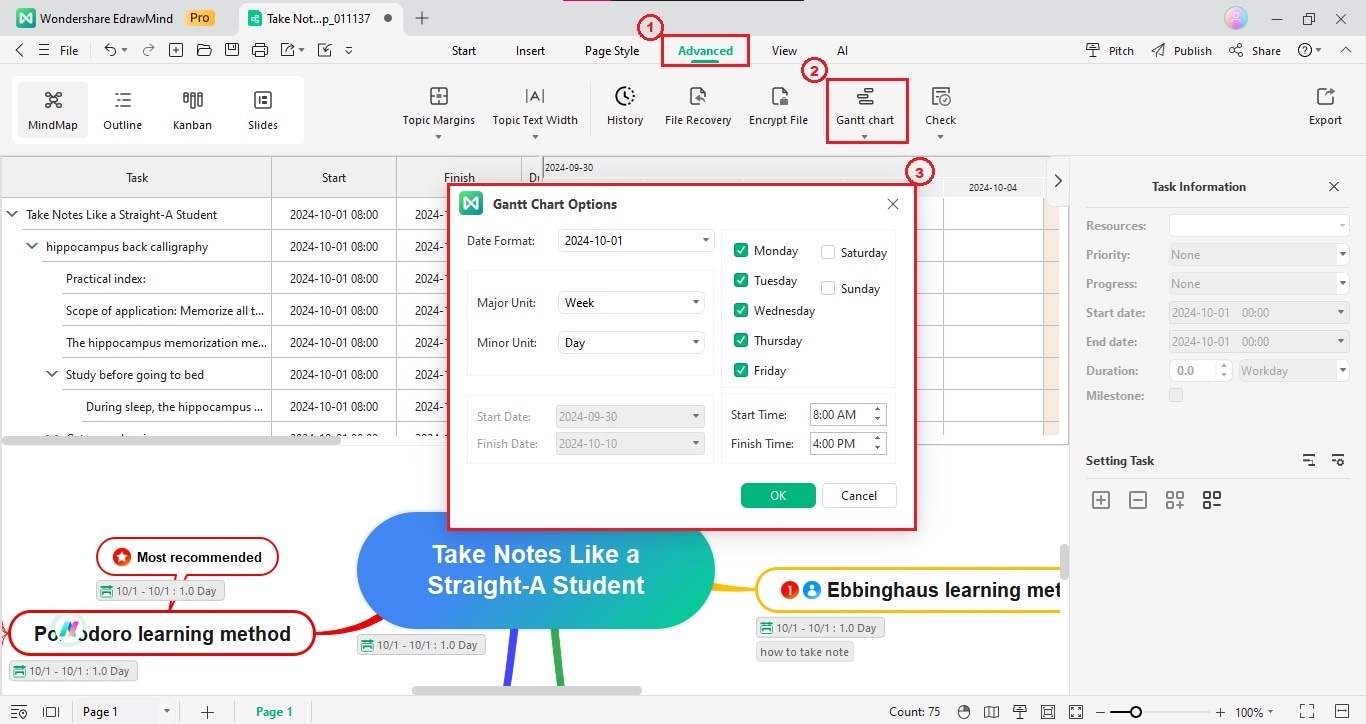
Step 2In the Gantt Chart Options pop-up window, you can edit the following to adjust the Gantt chart's elements:
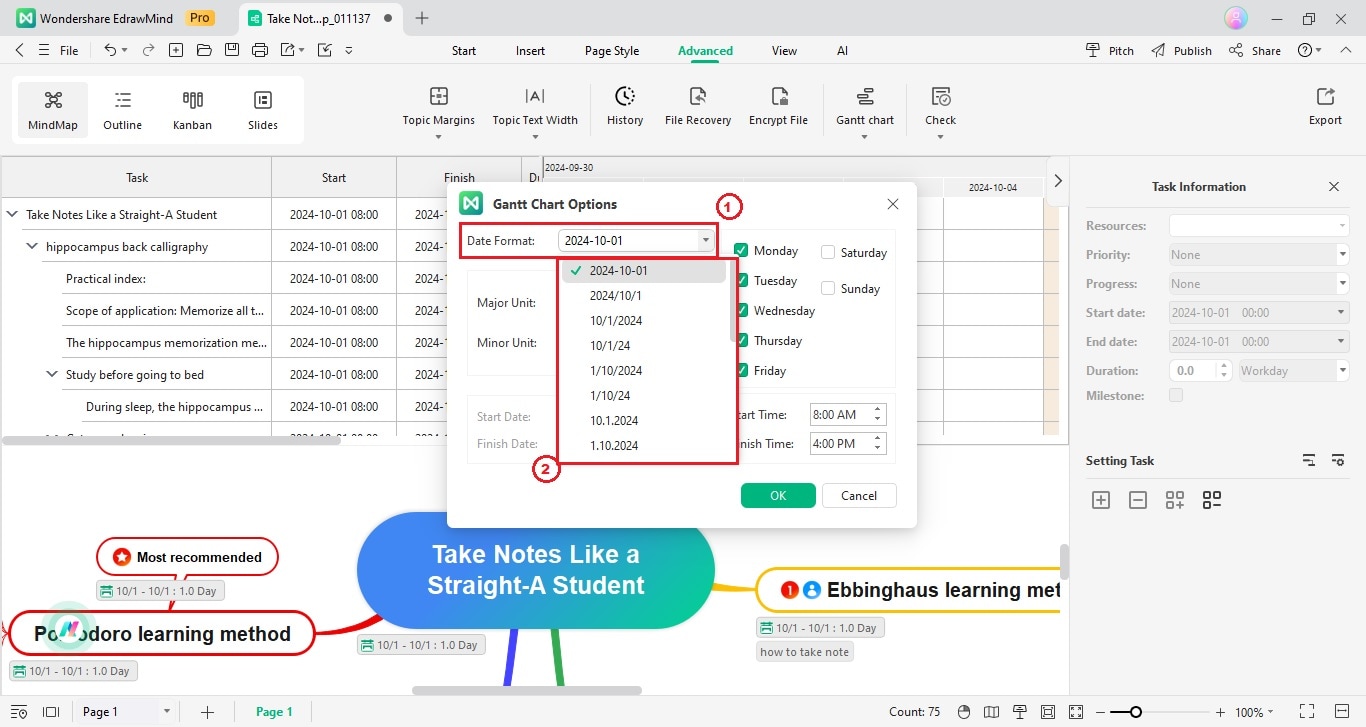
- To change the date format, click the Date Format drop-down list, then select a date format in the options.
- To view the timeline in the Gantt chart by days, click the Major Unit drop-down list and select Day.
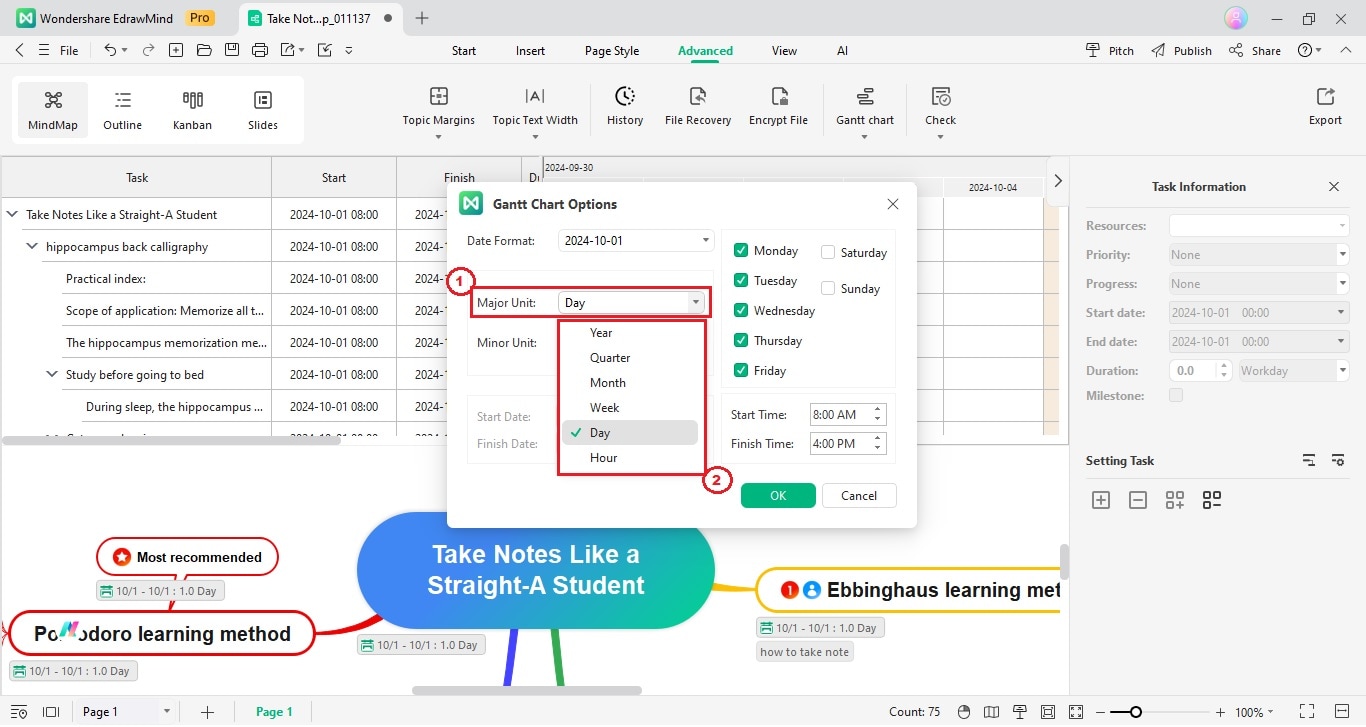
Note:
The Minor Unit will adjust accordingly. Alternatively, select an option in the Minor Unit drop-down list.- To display working days on the Gantt chart, select the checkboxes for the working days from Monday to Sunday based on your work schedule. Clear checkboxes for non-working days to highlight them in the Gantt chart.
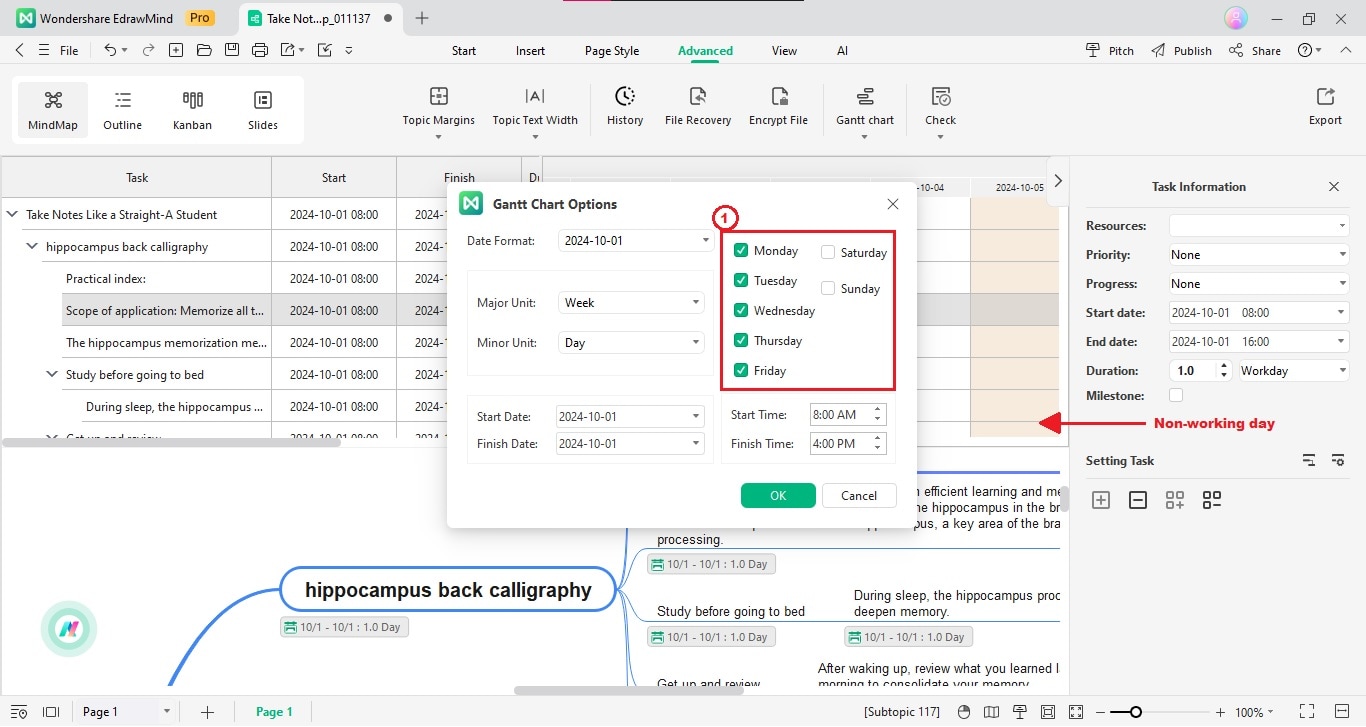
- Adjust a task's Start Date and Finish Date details in the Gantt Chart. First, select a task in the mind map, then click the Gantt Chart Option in the upper navigation pane. Next, click the Start Date drop-down list and select a date from the calendar. Do the same for the Finish Date drop-down list.
Step 3Click OK to apply the changes in the Gantt chart.