AI-powered Gantt chart maker Hot
Why use EdrawMind's Gantt chart maker?
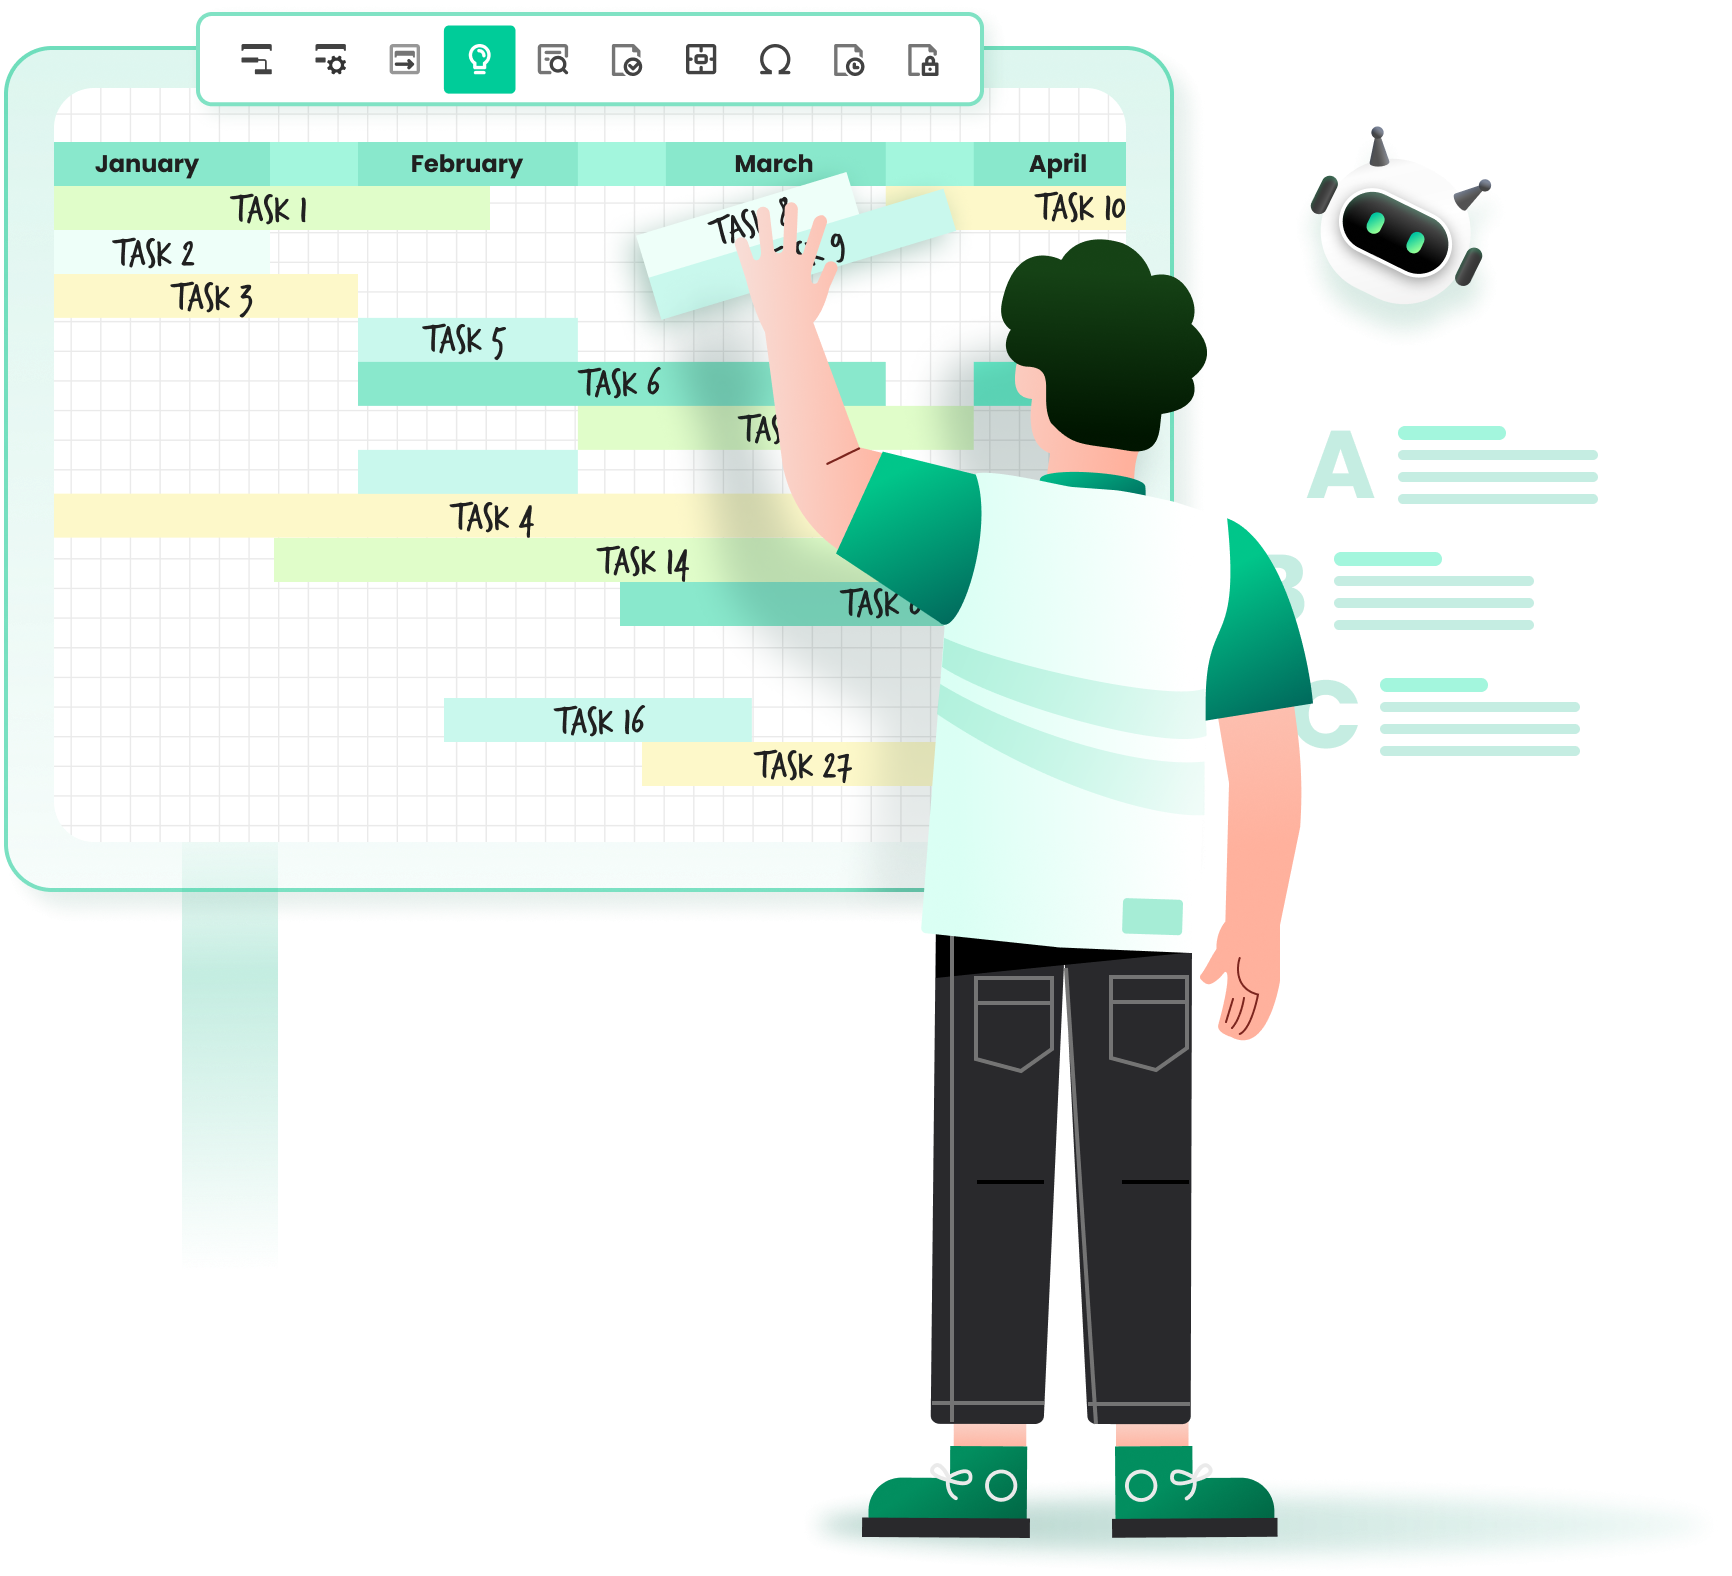
Experience the power of EdrawMind's Gantt chart maker and unlock a
world of project management efficiency. With its visually
captivating representation of timelines, tasks, and dependencies,
you'll effortlessly grasp the project's progress. Seamlessly
communicate, coordinate tasks, allocate resources, and swiftly
identify bottlenecks or delays.

 Project management tool
Plan, Track, and Succeed! Project managers leverage Gantt charts
to meticulously outline tasks, milestones, dependencies, and
timelines, ensuring seamless progress and project success.

 Event timeline organizer
Seamlessly organize weddings, conferences, or trade shows.
Utilize Gantt charts to craft a comprehensive timeline
encompassing tasks like invitations, venue booking, vendor
hiring, and enchanting decorations.

 Product development tracker
Accelerate product development with precision. Product managers
harness Gantt charts to strategize research, design,
prototyping, testing, and production stages, enabling efficient
workflows and achieving remarkable outcomes.
How to make a Gantt chart with EdrawMind?
-
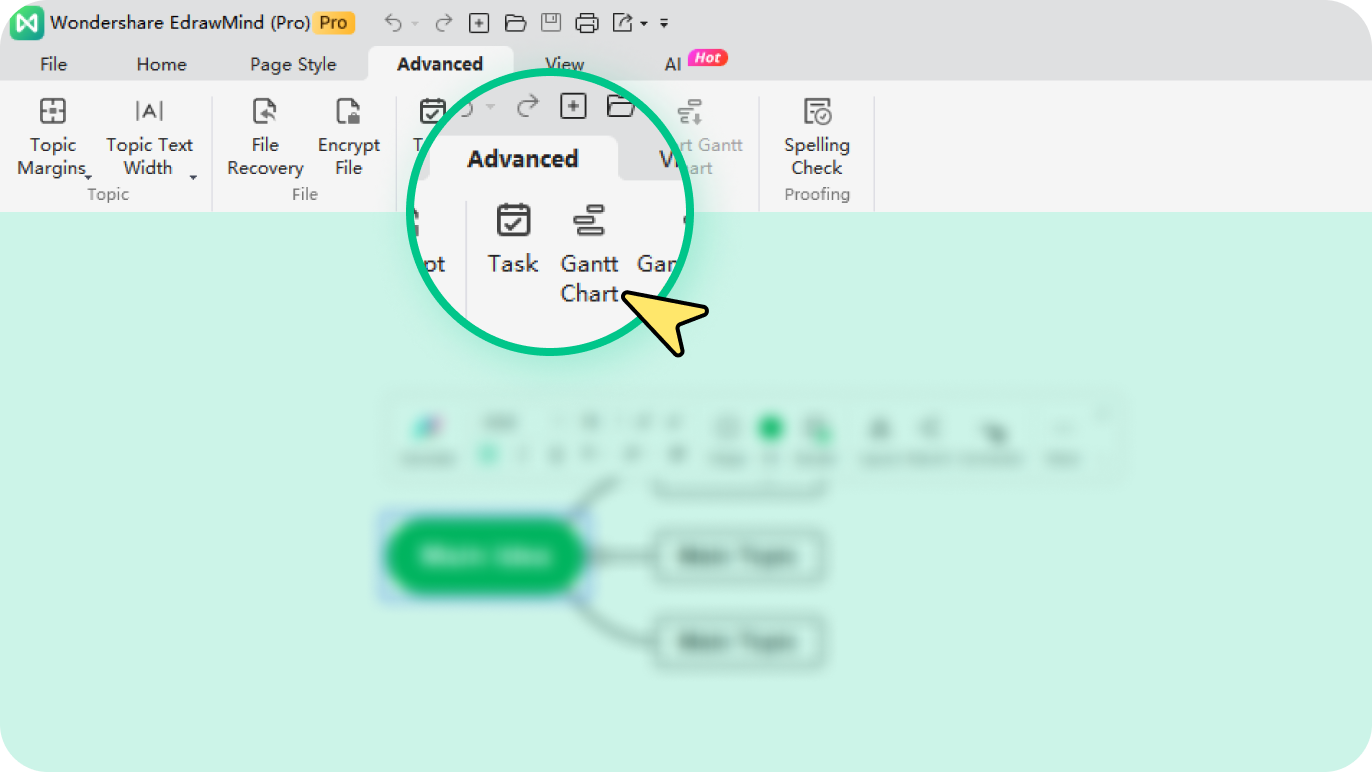
Step 1: Open Gantt chart maker
Go to Advanced in the top navigation pane and click Gantt Chart. -
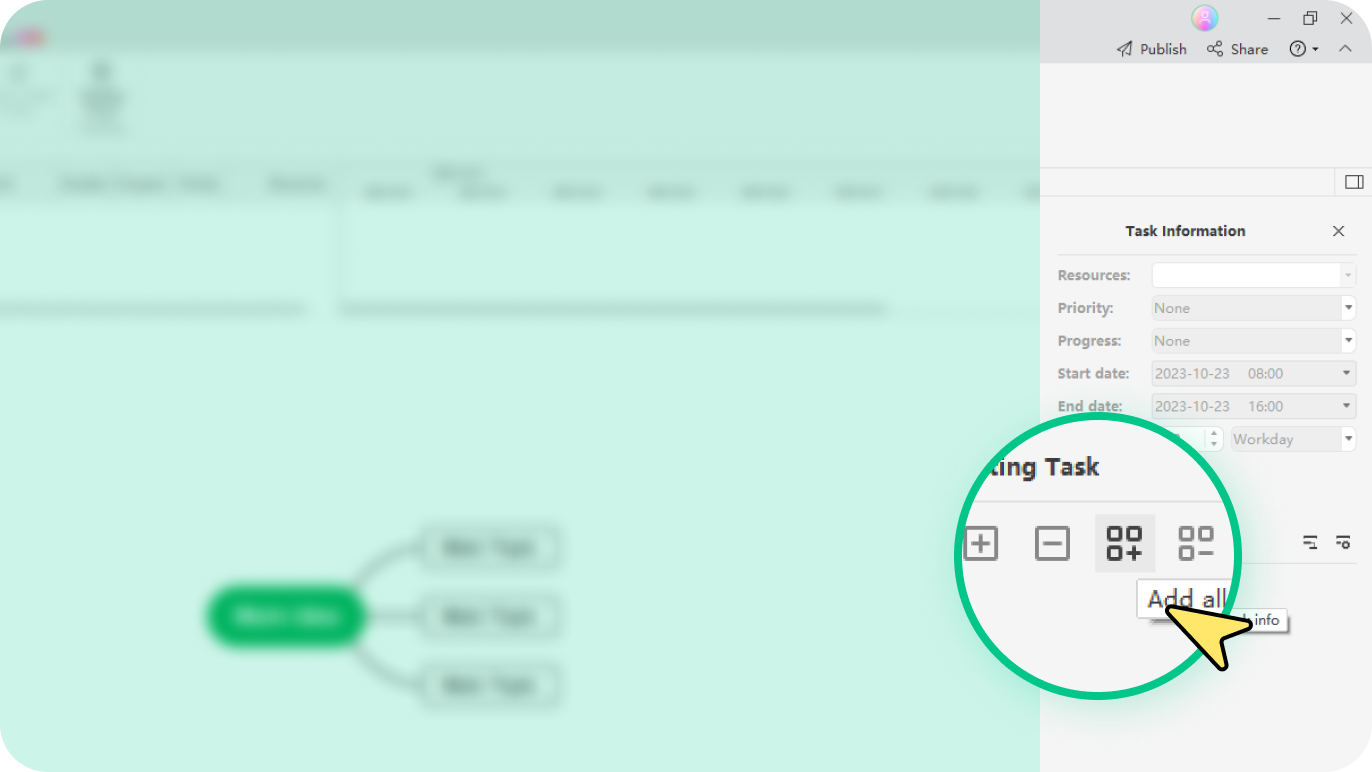
Step 2 Add or remove tasks
Choose a topic and click the "add task info" icon in the Setting Task menu on the right. Click "delete task info" to delete tasks. -
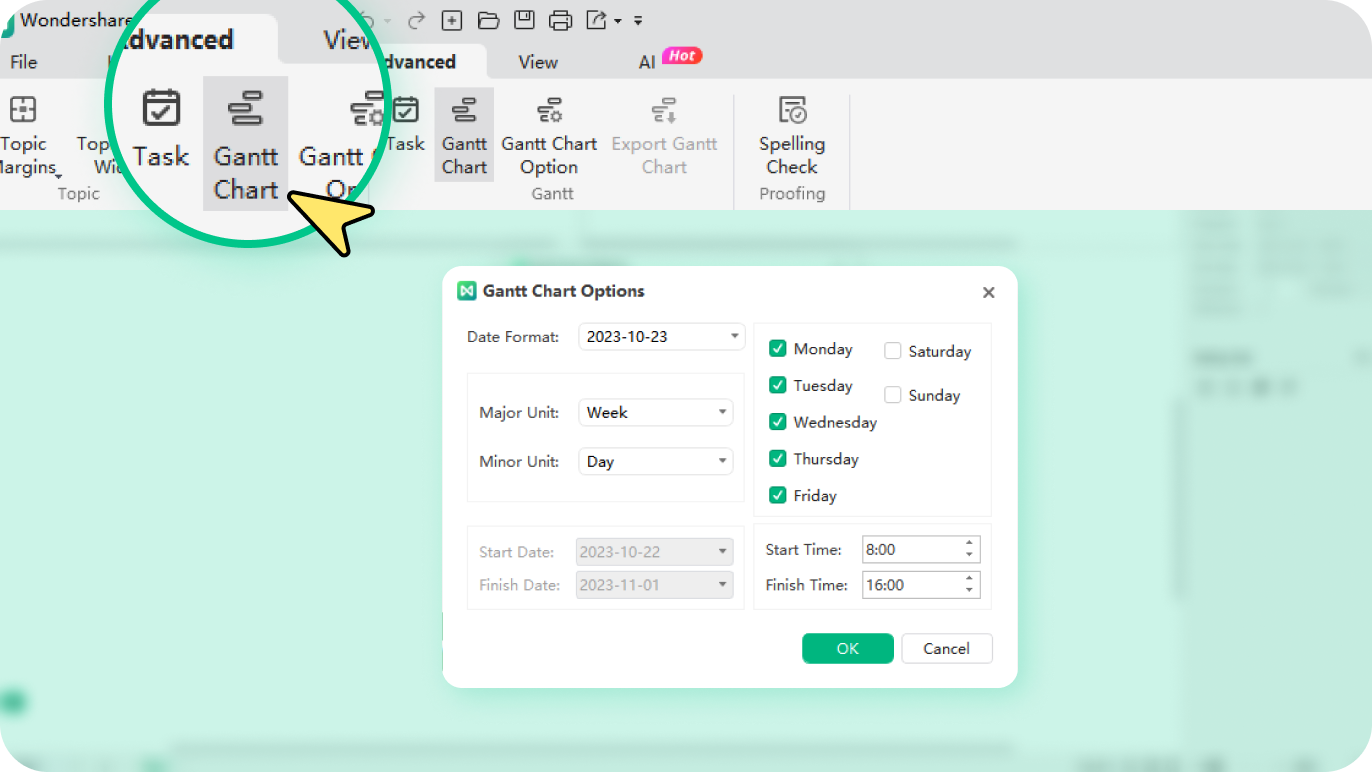
Step 3 Modify task Info
Go to Advanced > Gantt Chart Option to modify the data format, the major unit, the minor unit, the start time, and the finish time. -
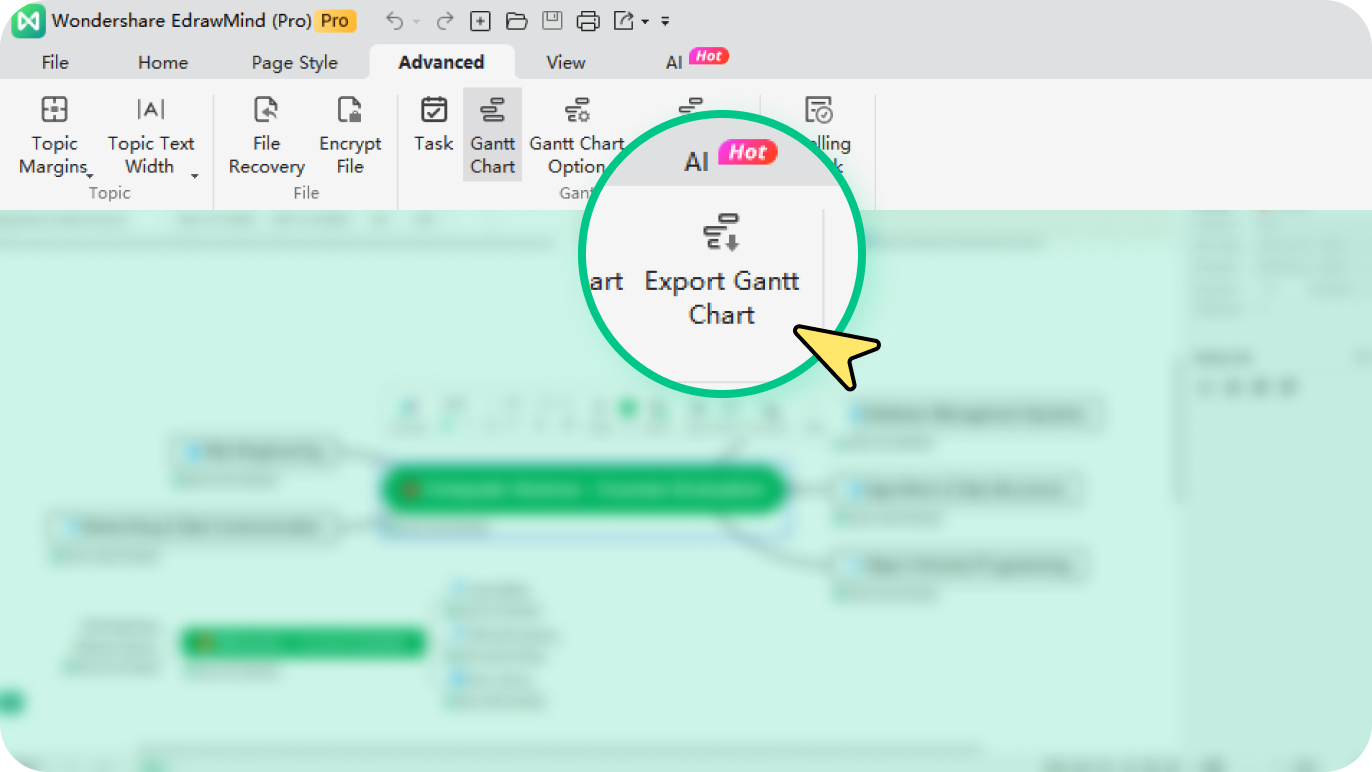
Step 4 Export Gantt Chart
Go to Advanced > Export Gant Chart. Type a name for the Gantt chart in the saving window. Click Save.
Gantt chart templates in EdrawMind
EdrawMinder voices


FAQs on Gantt charts
What are the main components of Gantt chart?
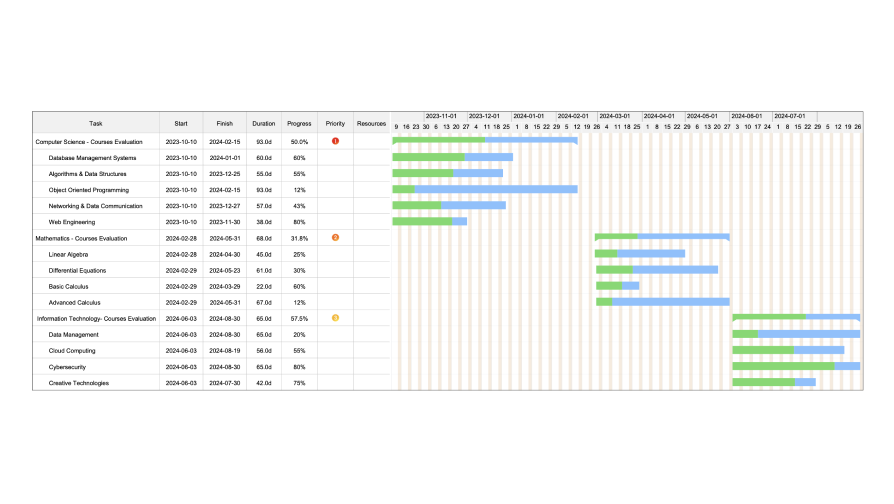
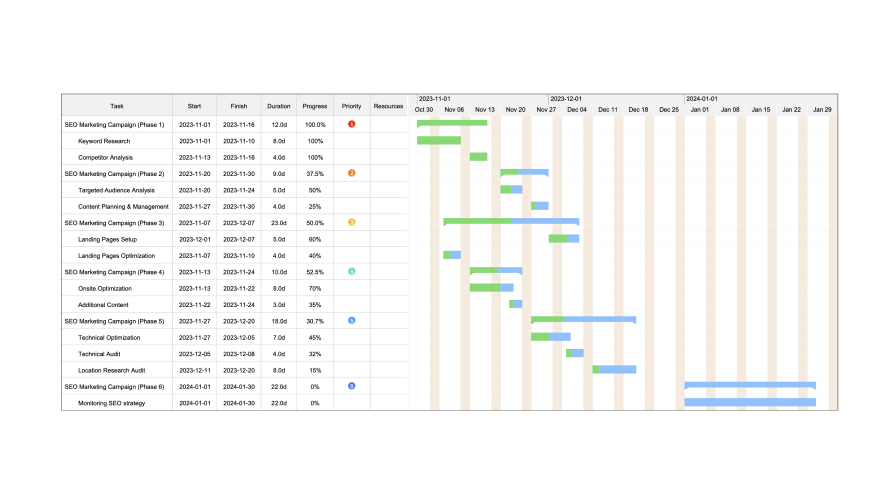
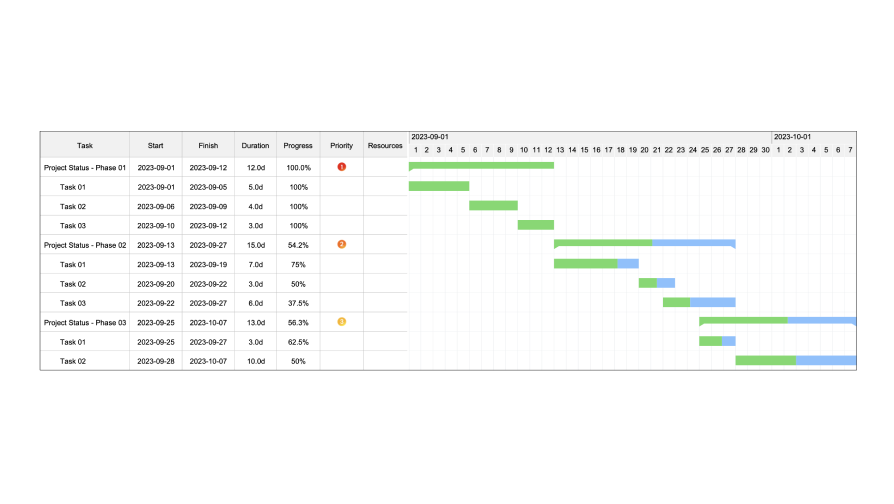
A Gantt chart has four main groups of components: the task
list, timeline, bars, and dependencies. The task list
shows all project tasks. The timeline represents project
duration. Bars depict tasks and their durations.
Dependencies demonstrates task relationships and
sequencing.
What is the Gantt chart used for?
It is a project management tool to visually represents
task schedules, dependencies, and progress and support
project planning, task scheduling, progress tracking,
resource management, and communication.
What are the main benefits of using a Gantt chart?
Through visualizing project schedules and dependencies, it
can promote efficient task and resource management,
progress tracking, improved communication and
collaboration, optimization of time and resources, and
informed decision making for project stakeholders.
How to create a gantt chart?
To create a Gantt chart, identify tasks, set start and end
dates, create a timeline, plot tasks as bars, adjust bar
lengths for durations, use colors/patterns for clarity,
label tasks, review for accuracy, and share with
stakeholders for effective project timeline communication.
How to create a Gantt chart in Excel?
To create a Gantt chart in Excel, input task data,
calculate end dates, insert a stacked bar chart using the
data range, customize the horizontal axis through "Format
Axis," and adjust settings to your preference.
Ignite your creativity with EdrawMind AI's futuristic mind mapping.
