Start with EdrawMind Desktop Guide
User Guide for PC
-
Get Started
-
Topics
-
Notes & Knowledge Base
-
Symbols
-
Layout
-
Theme and Style
- Change and Customize the Theme
- Change Topic Font
- Theme Color and Colored Branch
- Hand-Drawn Style
- Change Background and Add Watermarks
- Change Text Style and Color
- Change Topic Shape and Border
- Change Topic Colors
- Change Styles of Topic Shadows
- Change Branch Style
- Adjust Topic Margins and Topic Text Width
- Change Connector Style
- Format Painter and Style Follows
-
AI & OCR
-
Outline Mode
-
Slides Mode
-
Brainstorming Mode
-
Mind Map Gallery
-
Task Management Tips
-
Document Operations
-
View Mind Map
-
Open, Save, Share and Print
-
Real-time Collaboration
Gantt Chart View
A Gantt chart visually overviews a project's timeline, displaying tasks along a time axis. This tool is widely used in project management to aid teams in planning, scheduling, and tracking task progress. In the chart, each task appears as a horizontal bar. The length of the bar reflects the task's duration, while its position shows the start and end times.
Open/Close Gantt Chart Panel
Within EdrawMind, you can harness the Gantt Chart view, effortlessly transforming your mind maps and diagrams into Gantt charts. Task management occurs seamlessly in this view. Editing task details in the Gantt chart also updates corresponding information on the mind map. Follow these steps to switch to the Gantt Chart view.
Step 1You can access the Task Information sidebar in two ways for the Gantt chart view:
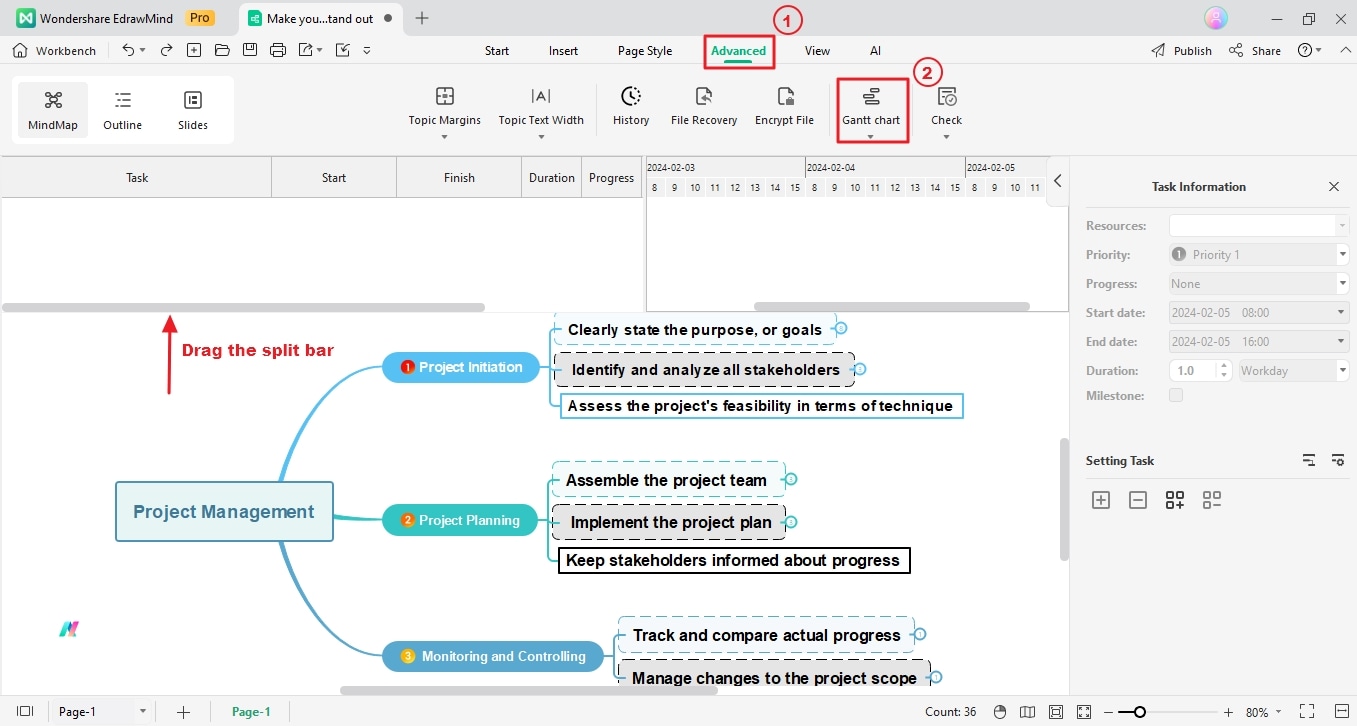
- Navigate to Advanced > Gantt Chart in the upper navigation pane.
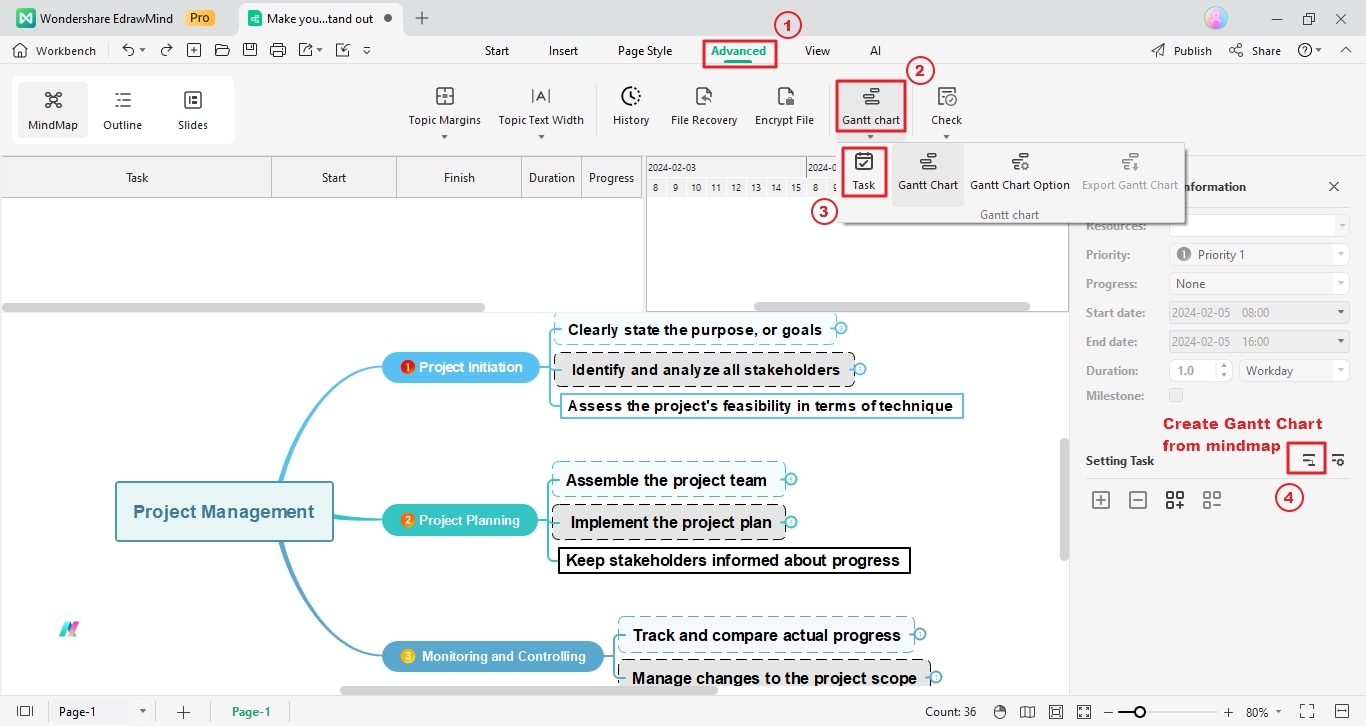
- Alternatively, go to Advanced > Task in the upper navigation pane. Then, from the Task Information left sidebar, click the Create a Gantt Chart from the mind map icon in the Setting Task section to show or hide the Gantt chart.
Note:
Double-click and drag the split bar to customize the area occupied by the Gantt chart and mind map on the canvas.Step 2Add essential task information to the Gantt chart from your diagram using these methods:
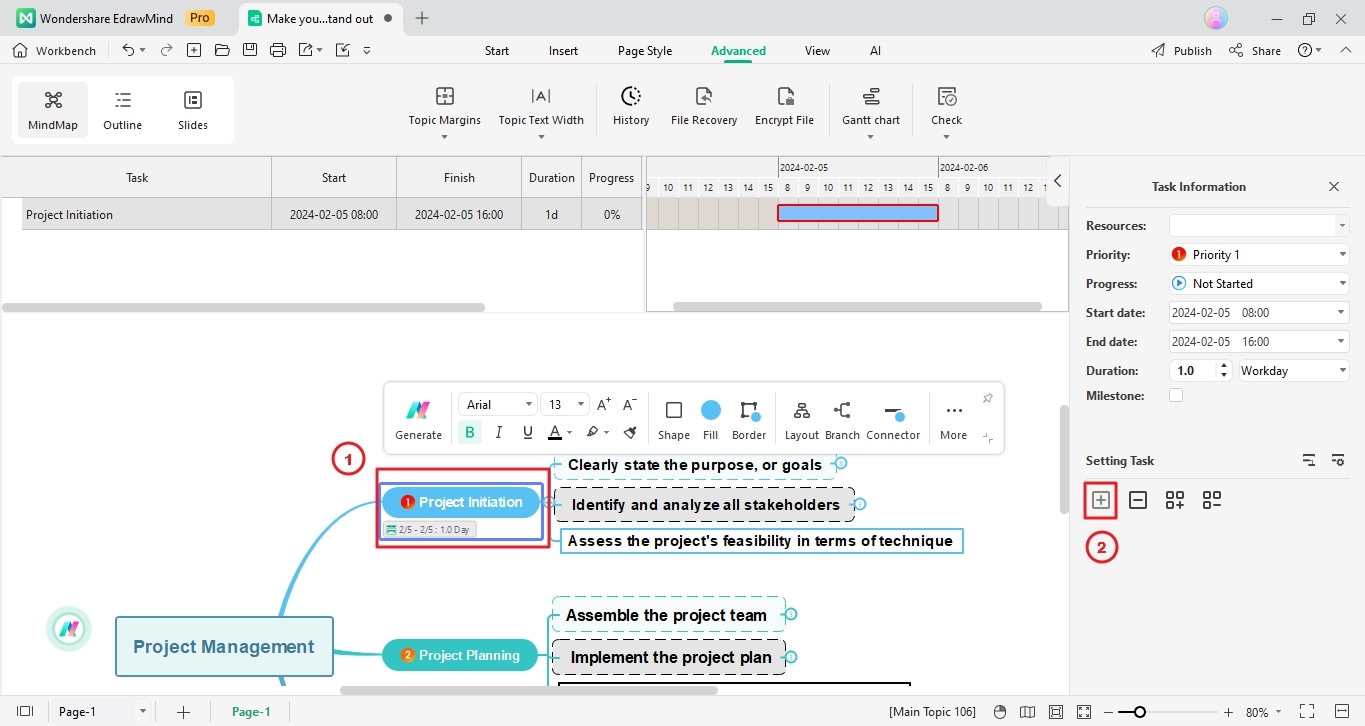
- You can choose a specific mind map task to include as an activity on the Gantt chart. To do so, select a task in the diagram. Next, from the Task Information sidebar on the left, click the + Add task info icon below the Setting Task section.
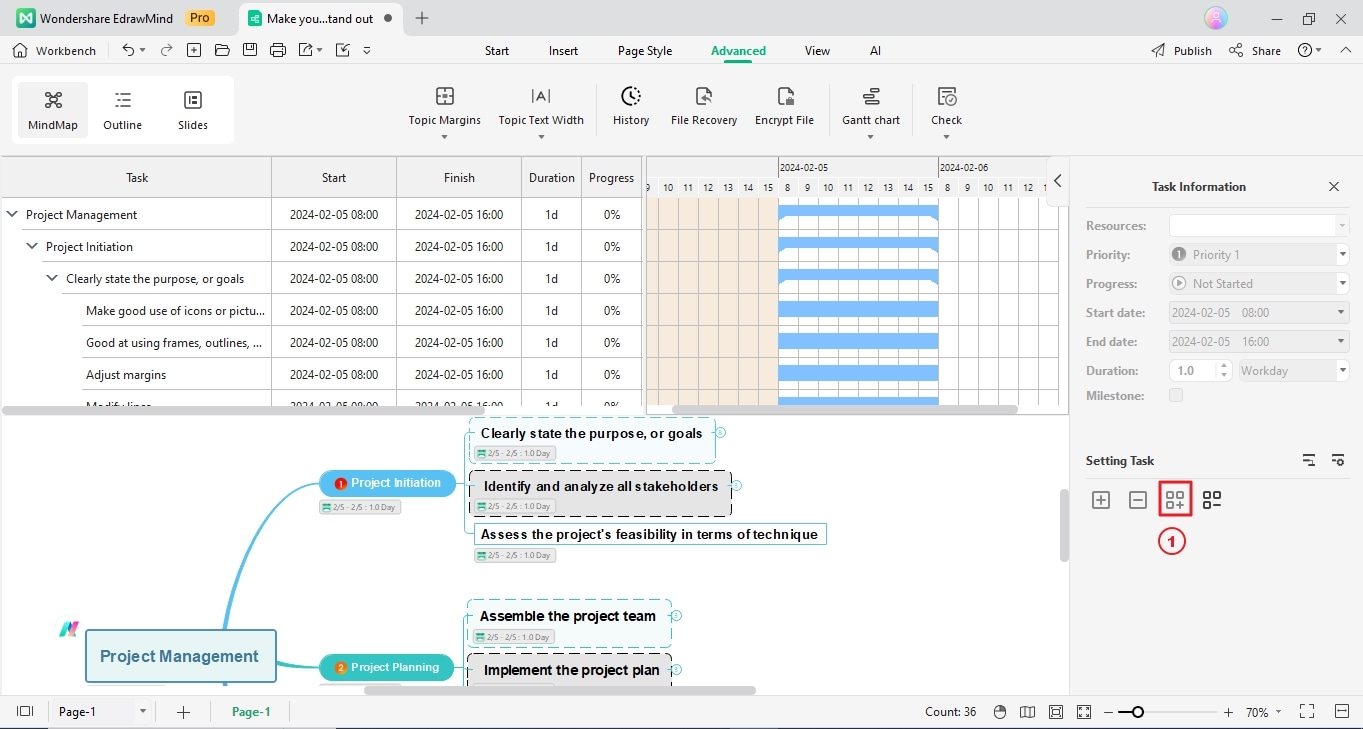
- Or, you can add all the tasks from the diagram directly into the Gantt chart. To do so, access the Task Information left sidebar. Then below the Setting Task section, click the Add all task info icon.
Step 3Click any of the aforementioned buttons to close the Gantt Chart panel.