Simple fishbone diagram maker
Unlock the potential of problem-solving with our free and easy-to-use Fishbone diagram maker. Effortlessly identify root causes with the power of AI assistance.

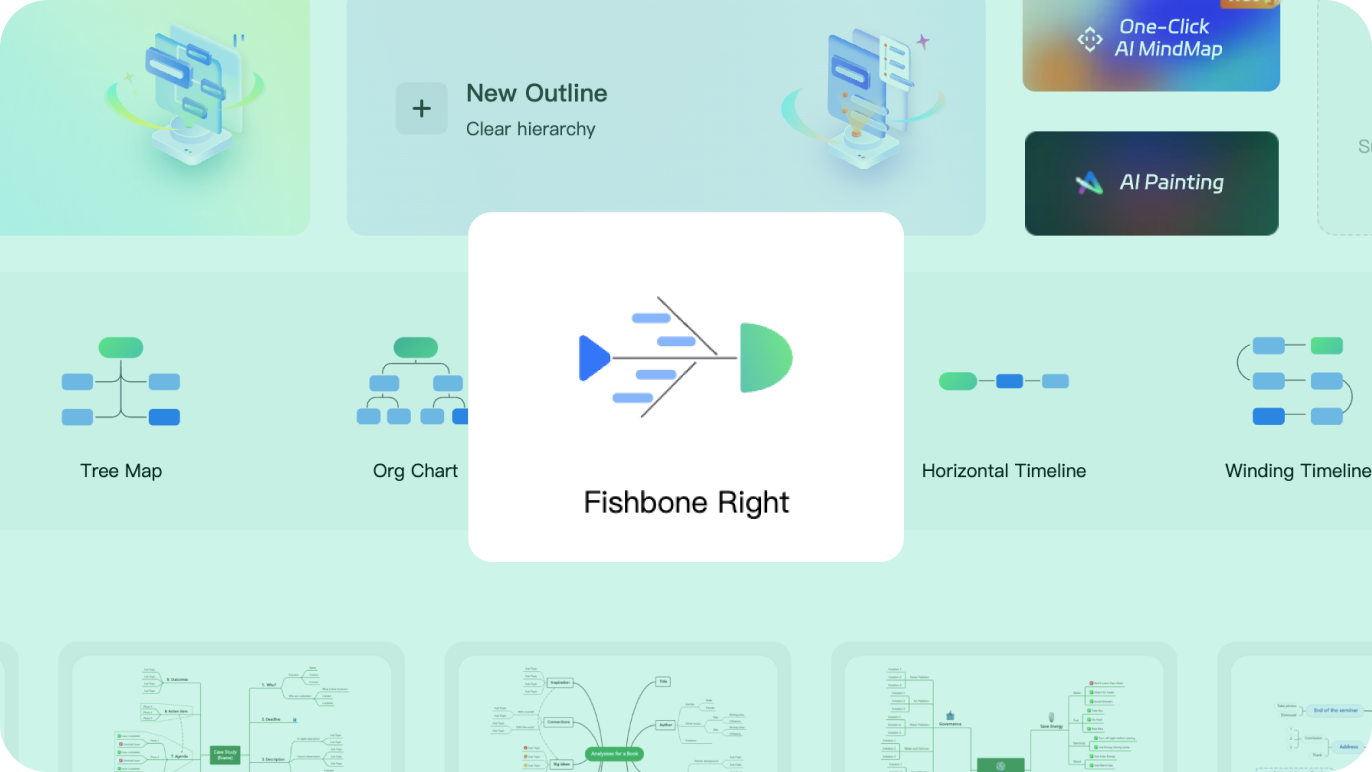
AI-powered fishbone diagram maker Hot
Why use fishbone diagrams?
Whether you are a student or a business owner, fishbone diagrams are
the key to unlocking your problem-solving potential.

 Efficient ideation: fishbone power
Unleash creativity by harnessing the potential of fishbone
diagrams. Generate ideas, solve problems, and analyze root
causes to drive innovation and achieve success in your
endeavors.

 Seamless teamwork: fishbone collaboration
Unlock enhanced collaboration through the use of fishbone
diagrams. Foster multi-angle discussions, facilitate
brainstorming sessions, and streamline problem-solving processes
to boost productivity and promote effective teamwork.

 Quick solutions: fishbone speed
Experience the efficiency of fishbone diagrams, swiftly identifying root causes, analyzing relationships, and providing concise solutions. Accelerate your progress towards success.
How to create a fishbone diagram?
-
Step 1: Download or try online
Download EdrawMind or try it online. If this is your first time using it, sign in by e-mail or social media accounts or create a new account. -
Step 2: Create a fishbone diagram
Get started with a template by going to File > New > Fishbone or click "Create a new mind map" on the top left corner to make one entirely on your own. -
Step 3: Customize the fishbone diagram
Change the template's symbols and icons according to your needs by dragging and dropping elements from libraries. Modify styles of shapes and lines through the Design menu. -
Step 4: Export the fishbone diagram
Completing your flowchart, you can now export it in various formats, including Office, PDF, MindManager, Office, or SVG. In addition, you can save the document on Google Drive or Dropbox for cloud storage.

Step 1: Download or try online
Download EdrawMind or try it online. If this is your
first time using it, sign in by e-mail or social media
accounts or create a new account.
Step 2: Create a fishbone aiagram
Get started with a template by going to File > New > Fishbone or click “Create a new mind map” on the top left corner to make one entirely on your own.
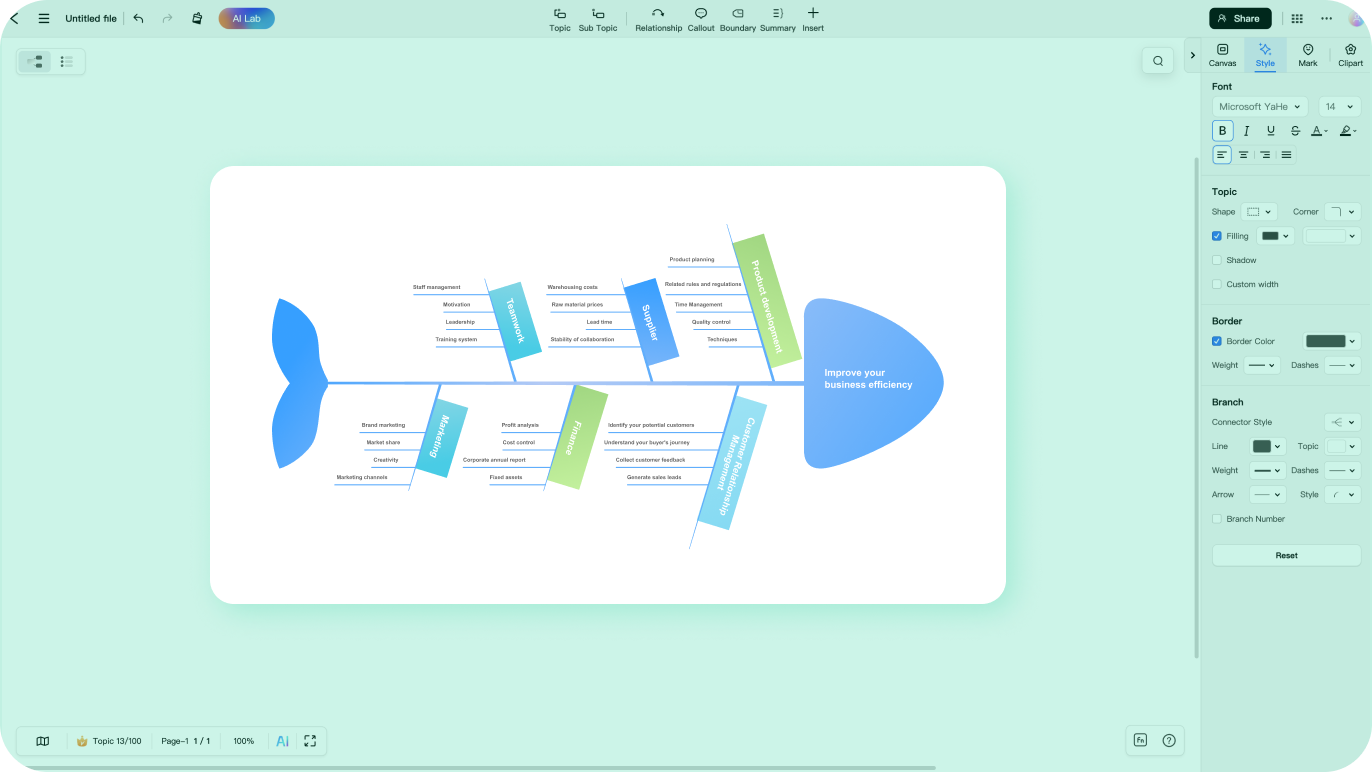
Step 3: Customize a fishbone diagram
Change the template's symbols and icons according to your needs by dragging and dropping elements from libraries. Modify styles of shapes and lines through the Design menu.
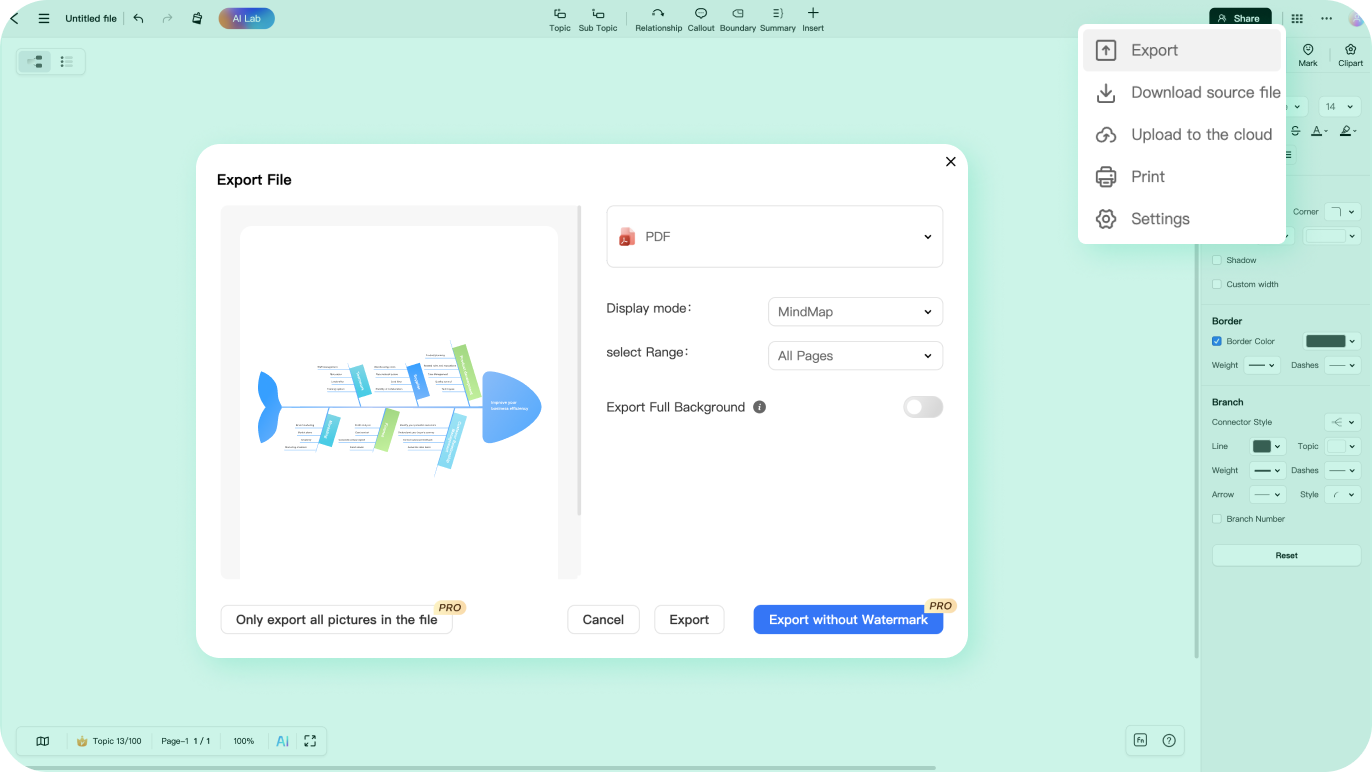
Step 4: Export a fishbone diagram
Completing your flowchart, you can now export it in various formats, including Office, PDF, MindManager, Office, or SVG. In addition, you can save the document on Google Drive or Dropbox for cloud storage.
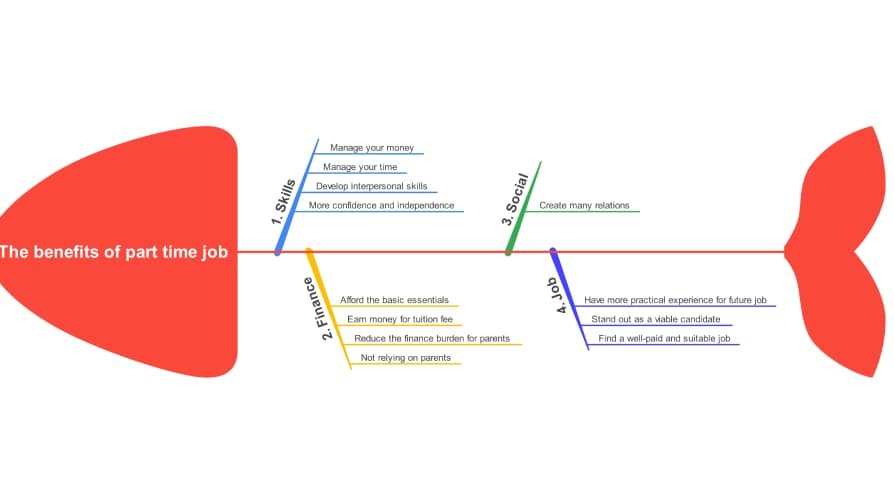
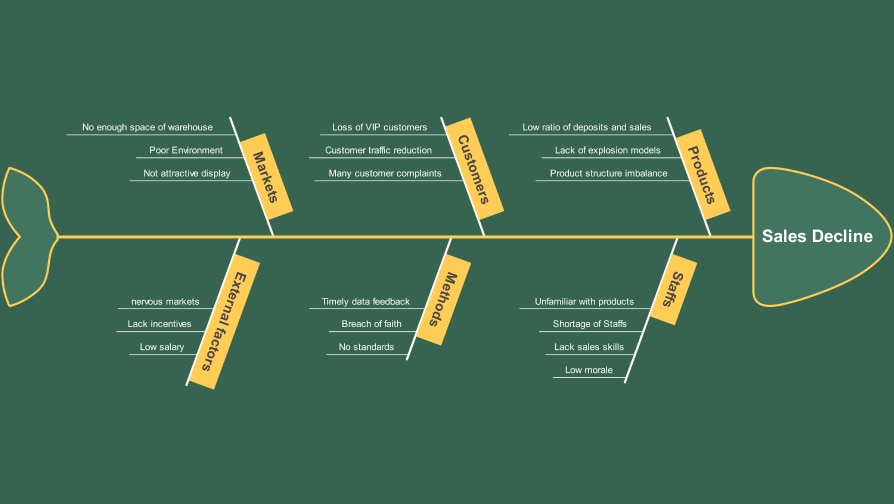
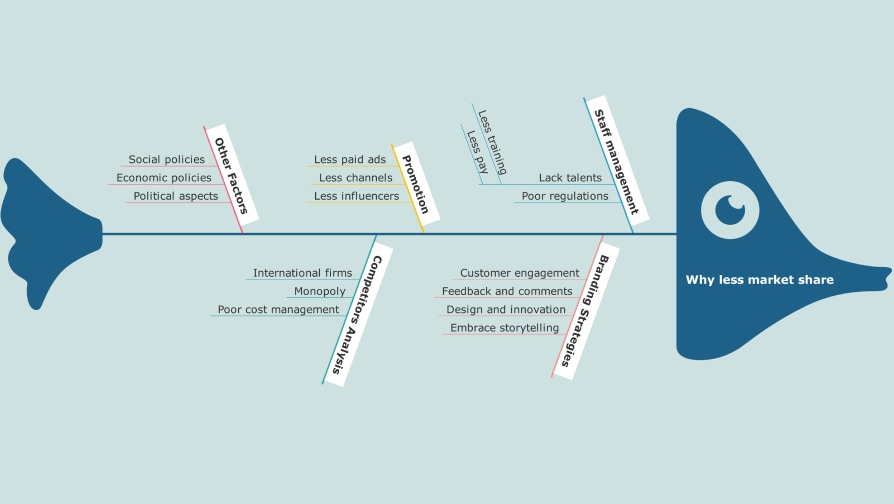
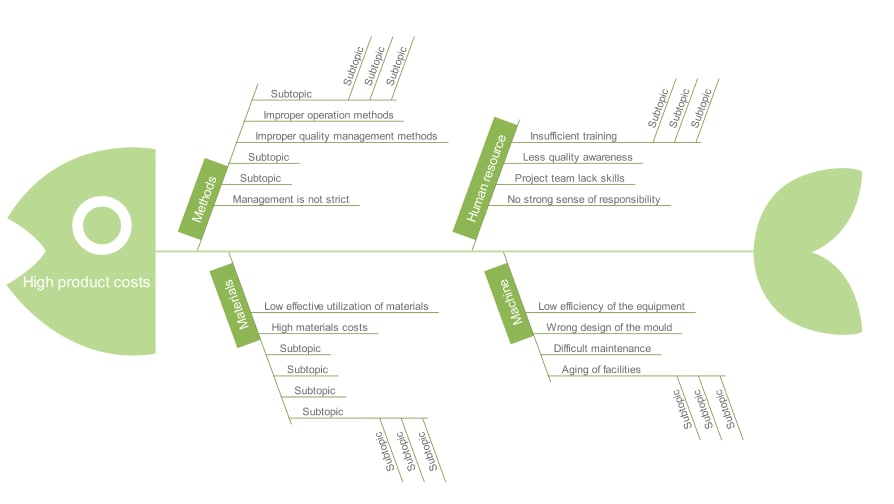
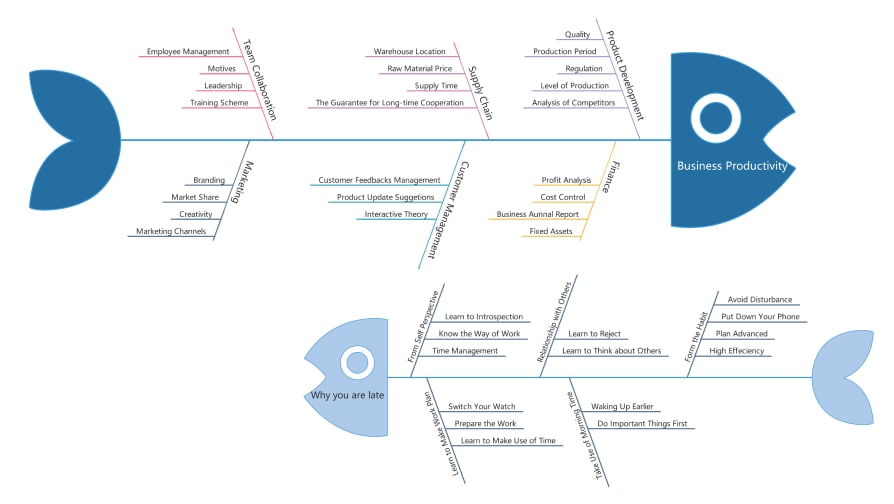
Fishbone diagram templates In EdrawMind
EdrawMinder voices

A great solution for students, teams, and
decision-makers to work together, share ideas, and
break down complex topics.
I found EdrawMind to be very useful and helpful in
assisting me in my ability to simplify complex
knowledge, information, and ideas into orderly
structured mind maps.
It has all the features that every user needs.
There's no other mind map app on the marketplace
that is at the same level as they are. EdrawMind is
a supreme product.

FAQs on fishbone diagram makers
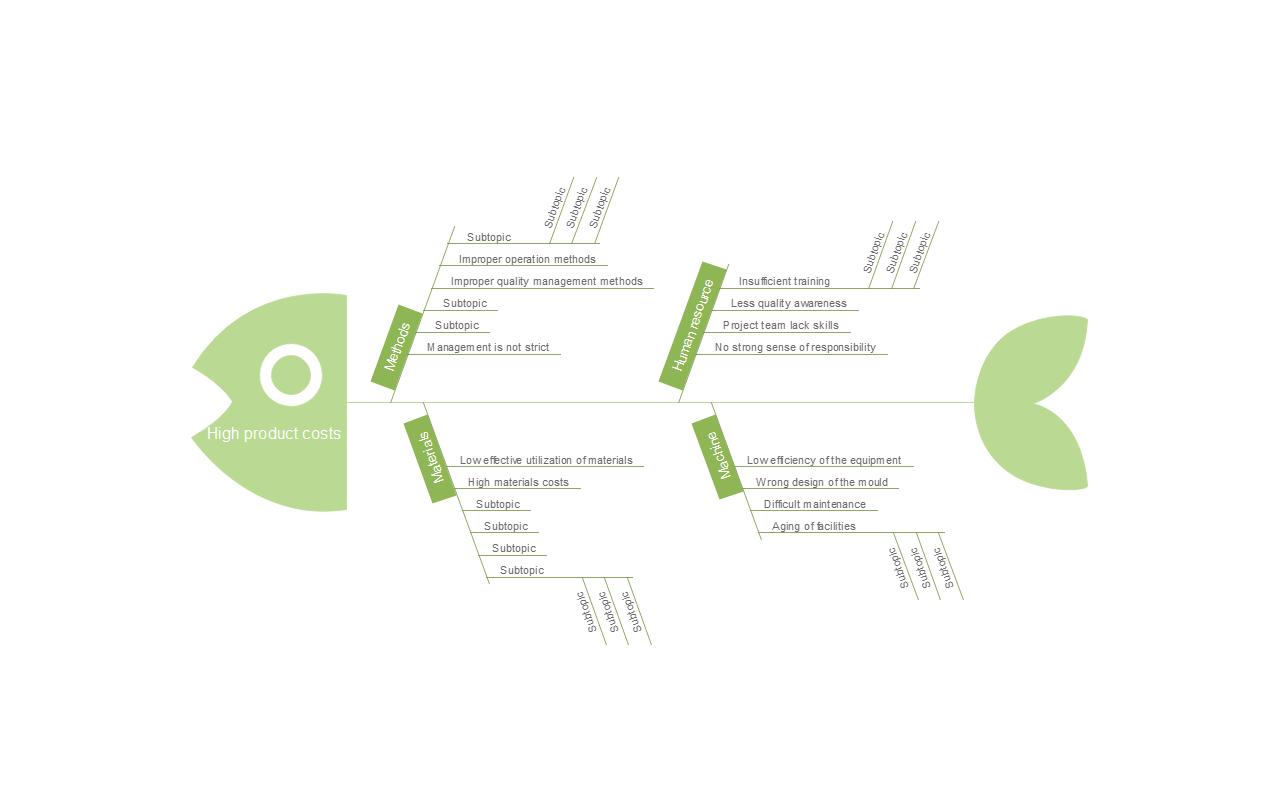
What is a fishbone diagram?
A fishbone diagram is a visual tool used to identify and
analyze the potential causes of a problem. It resembles the
skeleton of a fish, with the problem or effect at the head
and the possible causes branching out like bones.
What are the key elements of the fishbone diagram?
The key elements of a fishbone diagram, often called the 5Ms, are manpower, methods, machines, materials, and measurements. These elements help identify and categorize potential causes systematically, aiding in analyzing and understanding the problem or effect being studied.
Is there another name for the fishbone diagram?
It is also called the herringbone diagram, the cause-and-effect diagram, or the Ishikawa Diagram, as it is a causal diagram created by Kaoru Ishikawa to show the potential causes of a particular event.
What are the pros and cons of the fishbone diagram?
Its simplicity can be seen as both a strength and a weakness. On the positive side, the simplicity of the fishbone diagram makes it easy to understand and use for visualizing causes and effects. However, this simplicity can also be a drawback in complex situations where the interrelated nature of problems and causes may need to be adequately represented.
How to build an Ishikawa diagram in 5 steps?
Ignite your creativity with EdrawMind AI's futuristic mind mapping.