AI-powered tree diagram maker Hot
Why use a tree diagram?
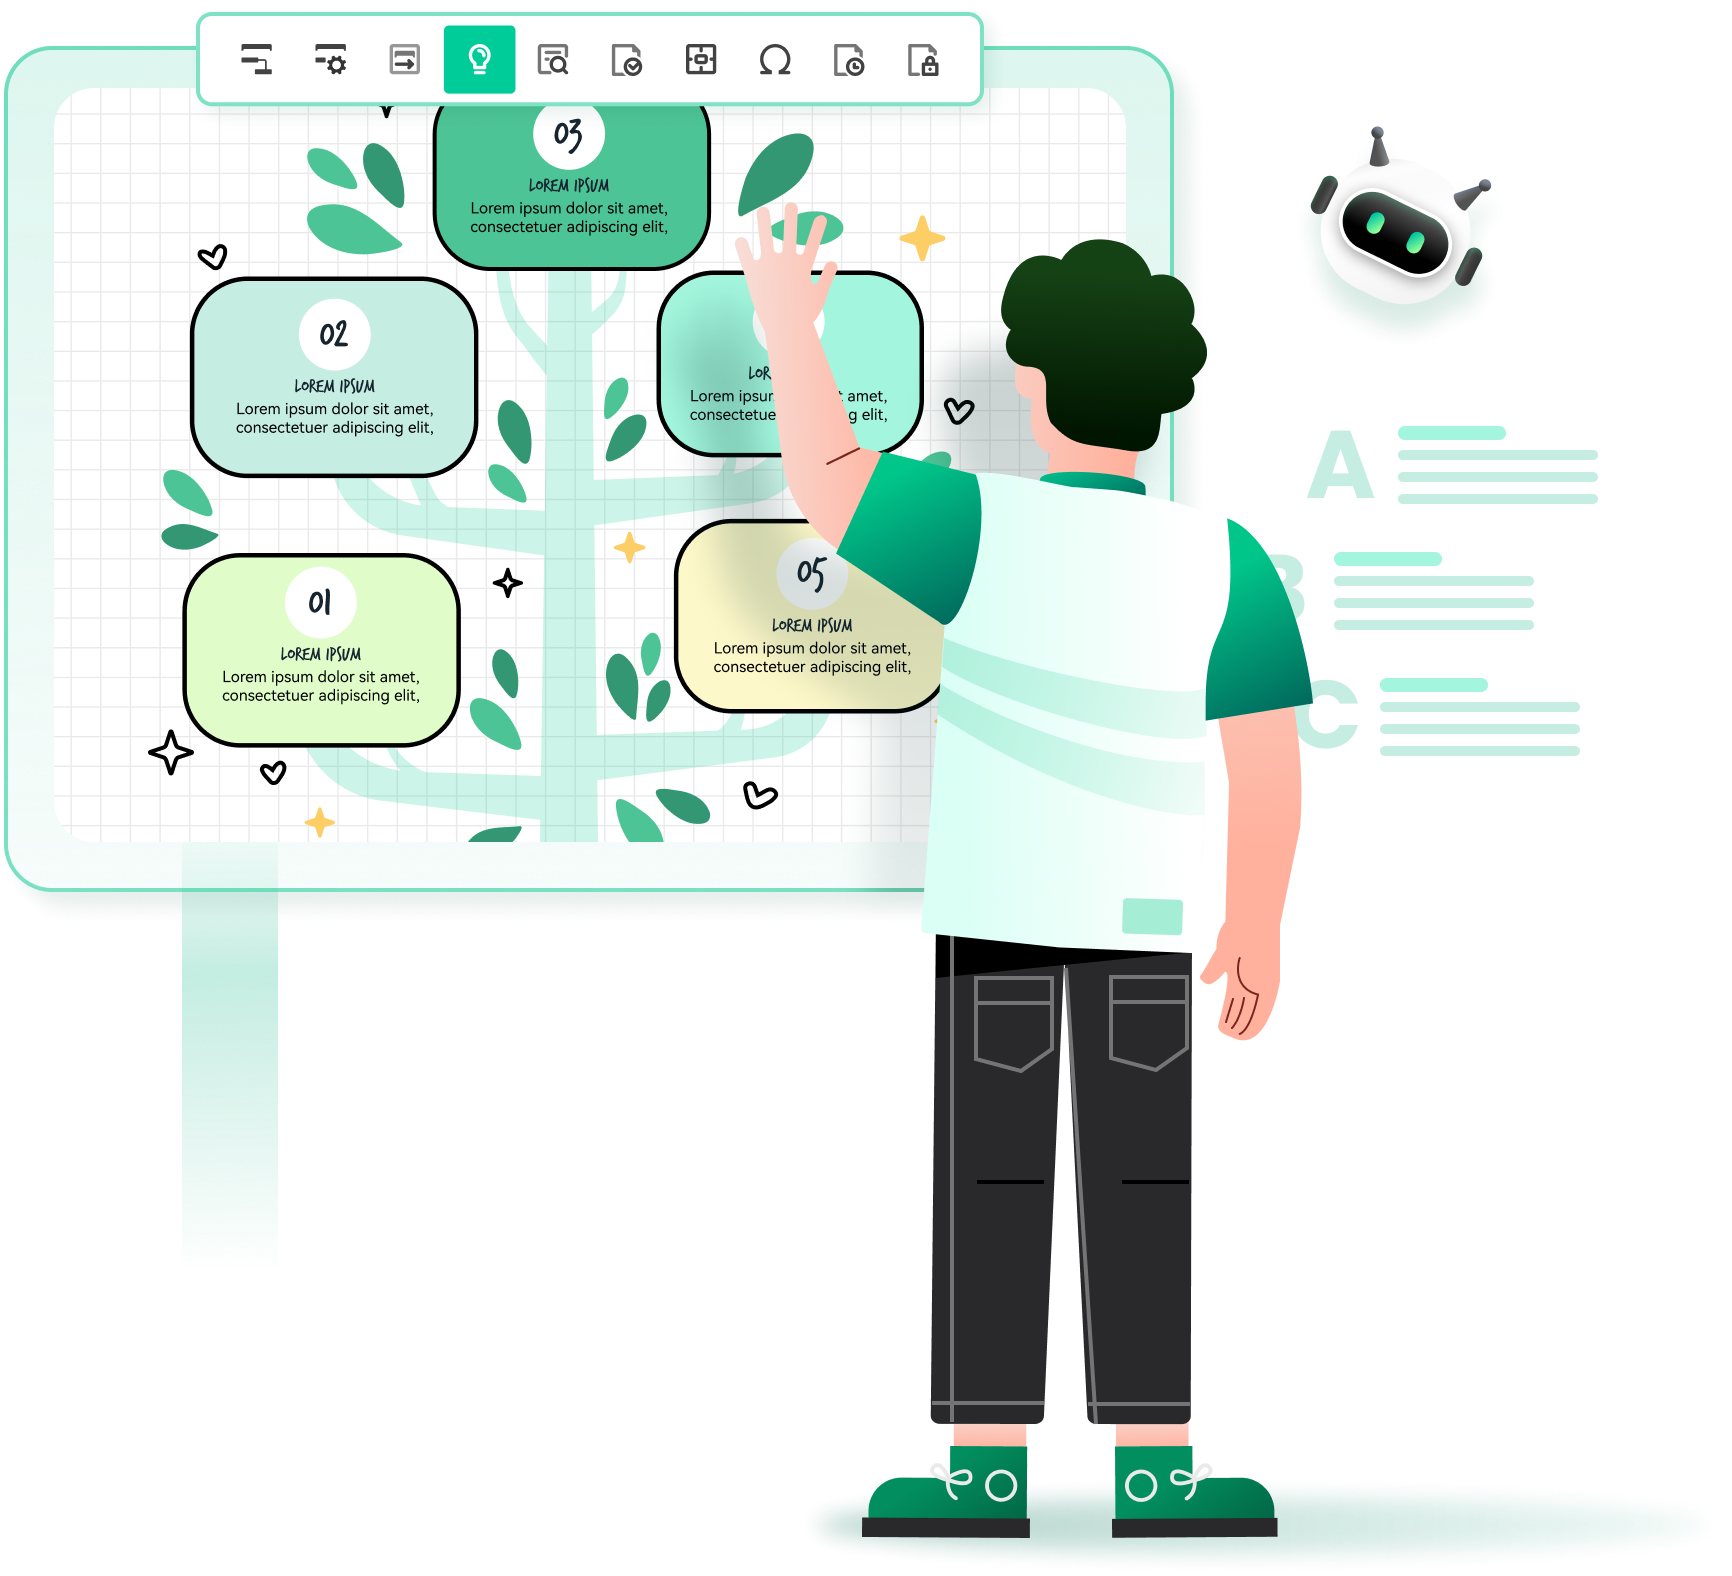
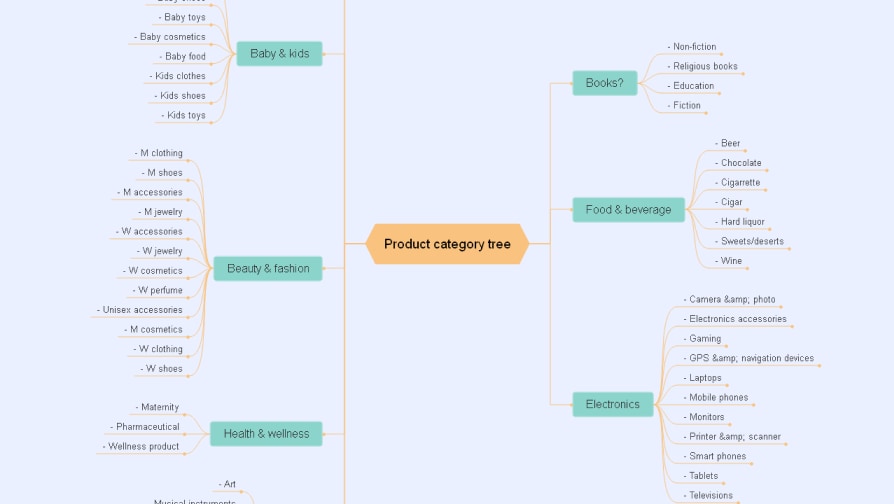
A tree diagram is a visual representation of a hierarchical
structure. It consists of nodes or circles connected by branches.
The nodes represent individual elements or concepts, while the
branches show the connections or relationships between them. Tree
diagrams are commonly used in various fields like biology, computer
science, linguistics, and decision analysis to organize and
illustrate complex information.

 Probability calculations
Effortlessly analyze probabilities with EdrawMind. Use tree
diagrams to simplify complex probabilistic scenarios, making it
easy to evaluate risks and predict outcomes, aiding in clearer,
more informed decision-making processes.

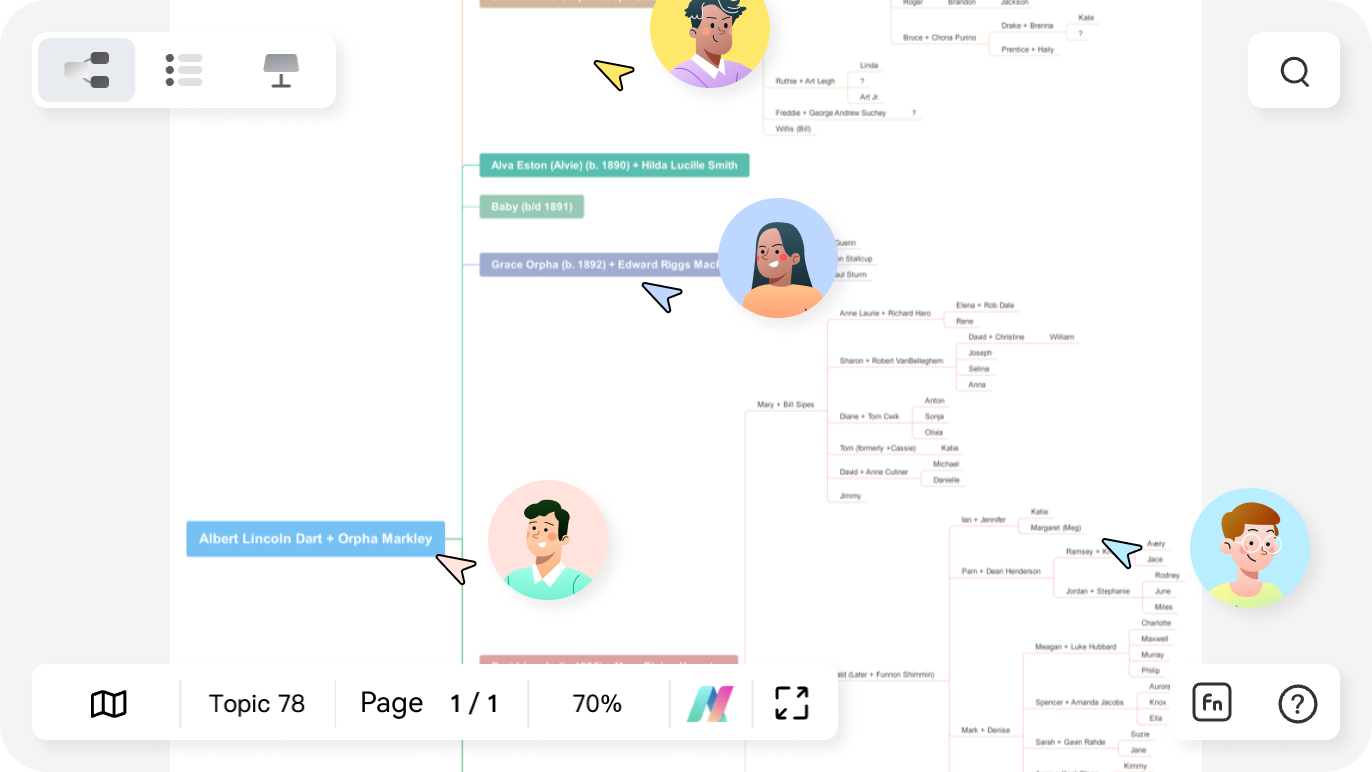
 Genetics and inheritance
Unlock the secrets of genetics and inheritance patterns and
visualize hereditary connections and traits with intuitive tree
diagrams, essential tools for educators, researchers, and
students to understand genetic complexities.

 Business forecasting
Strategically forecast future business scenarios, explore
various market trends and outcomes, aiding in effective business
planning and decision-making. Tree diagrams are ideal for
visualizing potential business paths and preparing for market
changes.
How to draw a tree diagram?
-
Step 1: Identify main concept
identifying the main concept or element, placing it at the top or center as the root node of the tree. -
Step 2: Adds sub-concepts
Add branches from the root to represent major categories or sub-concepts, ensuring each branch leads to a node. -
Step 3: Establish relationships
Further subdivide these branches into smaller nodes to detail finer elements or subcategories, maintaining a clear hierarchical structure. -
Step 4: Expand & review
Label each node and branch clearly to depict the relationships and connections, ensuring the diagram is easy to understand.
Tree diagram templates in EdrawMind
EdrawMinder voices


FAQs on tree diagram makers
1. What are the main types of tree diagrams?
The main types of tree diagrams include organizational
charts, family trees, decision trees, fault trees, and
parse trees. Each type serves a specific purpose, from
visualizing hierarchies and relationships to illustrating
decision processes and grammatical structures in
linguistics.
2. What are the best tree diagram makers available?
Yes, there are several free spider diagram makers
available such as EdrawMind. These tools offer a range of
features to create spider diagrams and other types of
visual maps.
3. Can I create a tree diagram online for free?
Yes, many online tools like EdrawMind, draw.io, Canva, and
Creately offer free versions that allow you to create
basic tree diagrams.
4. Do tree diagram makers require technical skills?
Most modern tree diagram makers are user-friendly and
don't require advanced technical skills. They often
provide templates and drag-and-drop interfaces for ease of
use.
5. Are there any specialized tree diagram makers for
specific fields?
Yes, some tools are specialized; for example, Genealogy
software for family trees, and software like Graphviz or
LaTeX for computer science applications.
6. Can tree diagram makers facilitate collaboration?
Many tools, such as EdrawMind, Lucidchart, and Microsoft
Visio, support collaborative features, allowing multiple
users to work on the same diagram in real-time.
7. What is a syntax tree?
A syntax tree, or parse tree, is a diagram used in
linguistics and computer science to represent the
grammatical structure of sentences. It shows how sentence
elements are grouped and ordered in hierarchical levels,
clarifying their syntactic roles. Syntax trees are
essential in language analysis and compiler design.
8. What is a decision tree?
A decision tree is a graphical tool used for
decision-making and probability analysis. It represents
choices and their possible outcomes, including chance
event outcomes, resource costs, and utility. It's a
tree-like model of decisions and their potential
consequences, widely used in business, finance, and
machine learning.
Ignite your creativity with EdrawMind AI's futuristic mind mapping.

