Free bubble map maker
Create visually stunning bubble maps effortlessly with
EdrawMind's bubble map maker, a tool that aims to unlock your
creative potential and efficiently structure your ideas.
AI-powered bubble map maker Hot


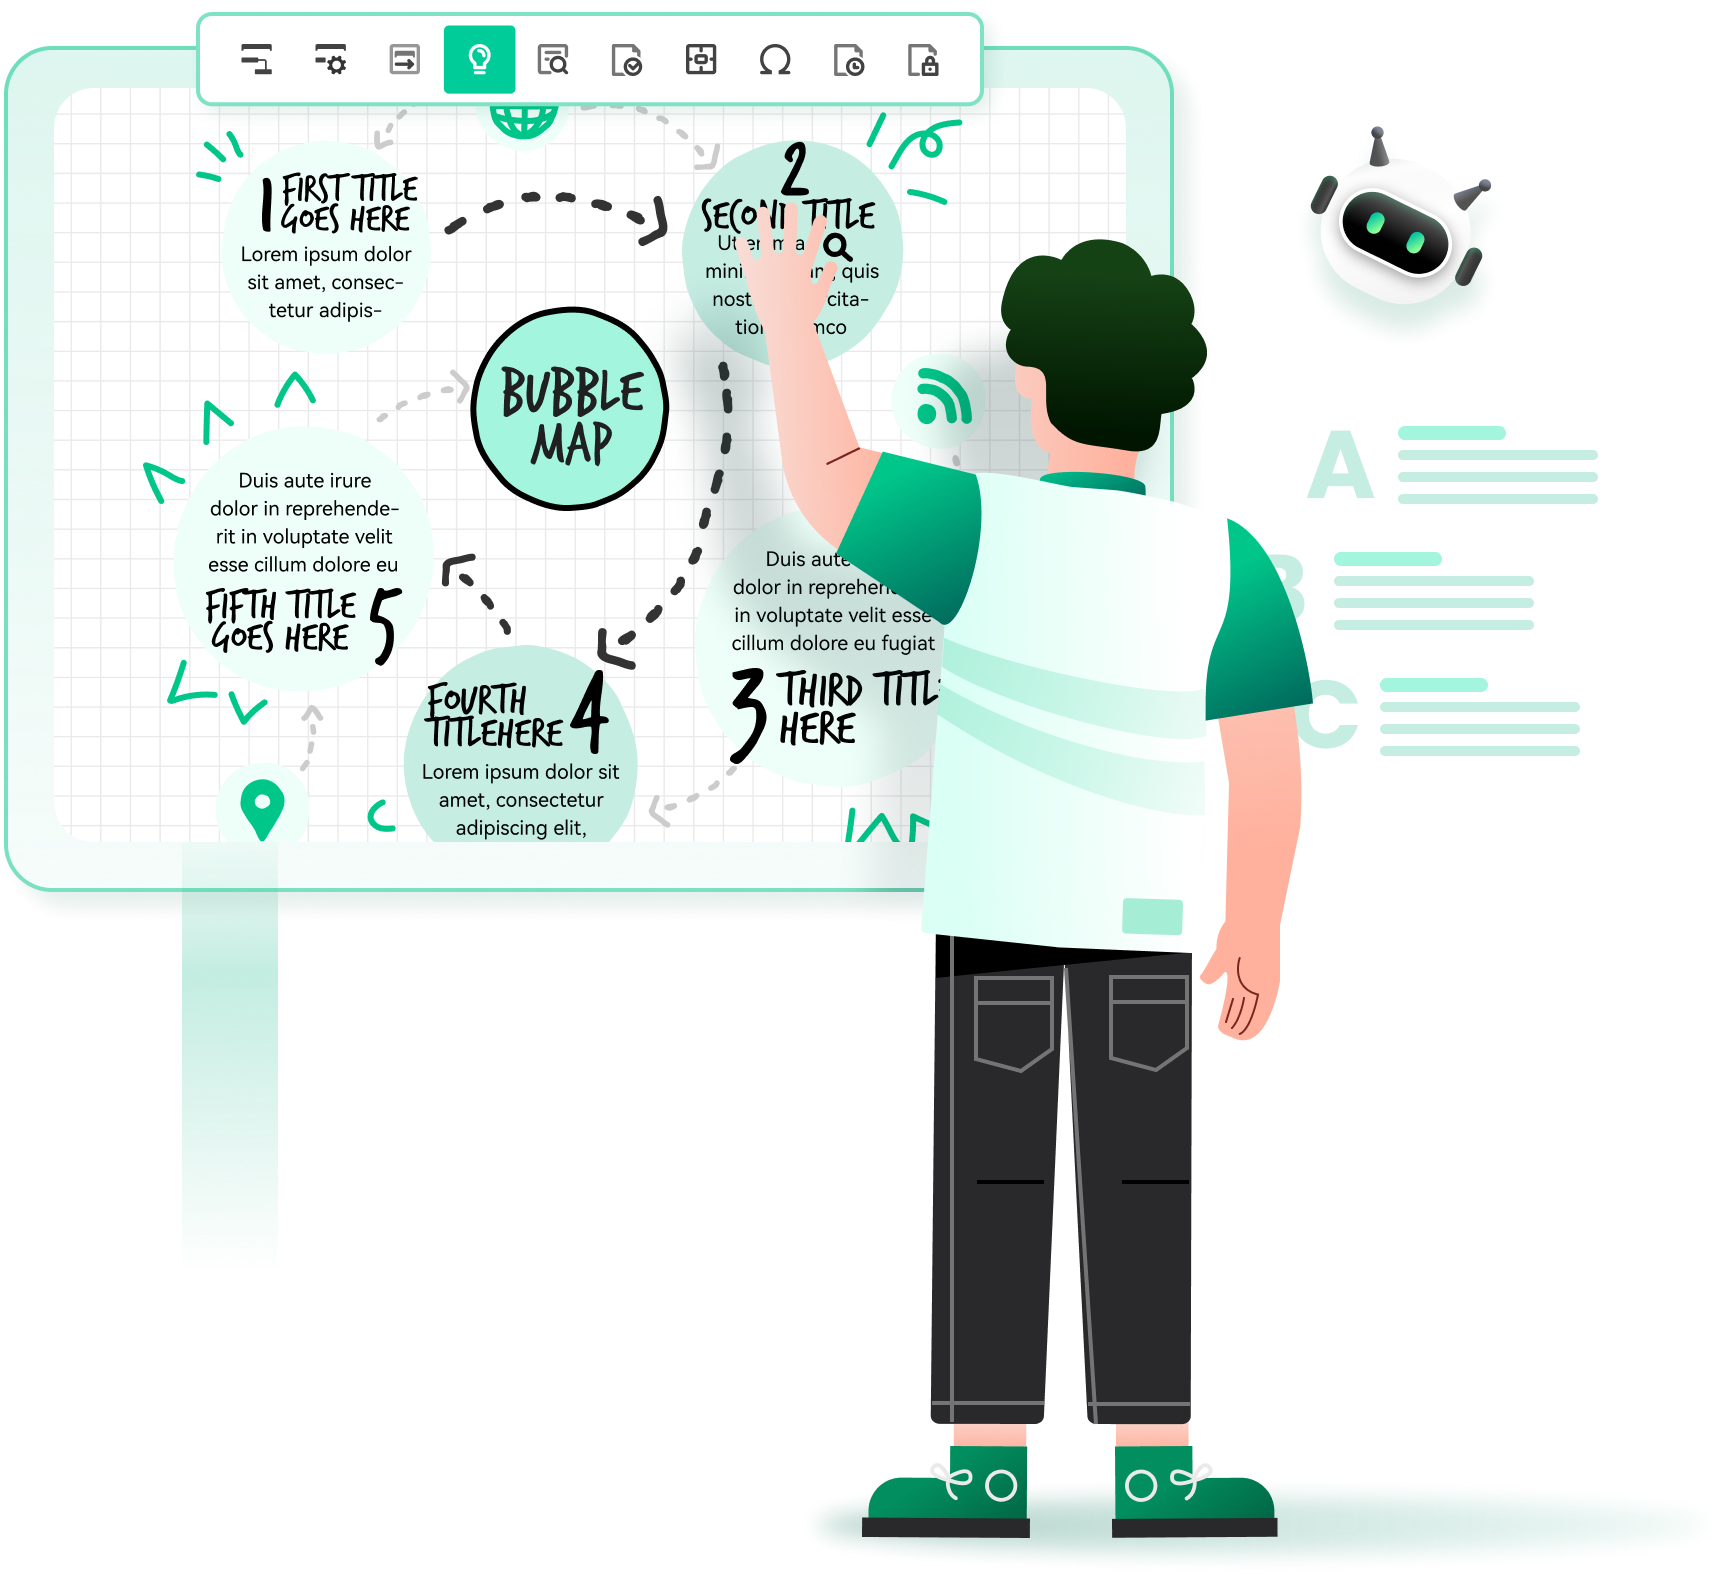
Why use a bubble map ?
A bubble map is an invaluable tool for brainstorming and organizing
thoughts visually. It facilitates effortless grouping and
categorization of interconnected concepts, making it perfect for
information organization and project planning. Utilize this tool to
streamline your thought process and unlock creativity.

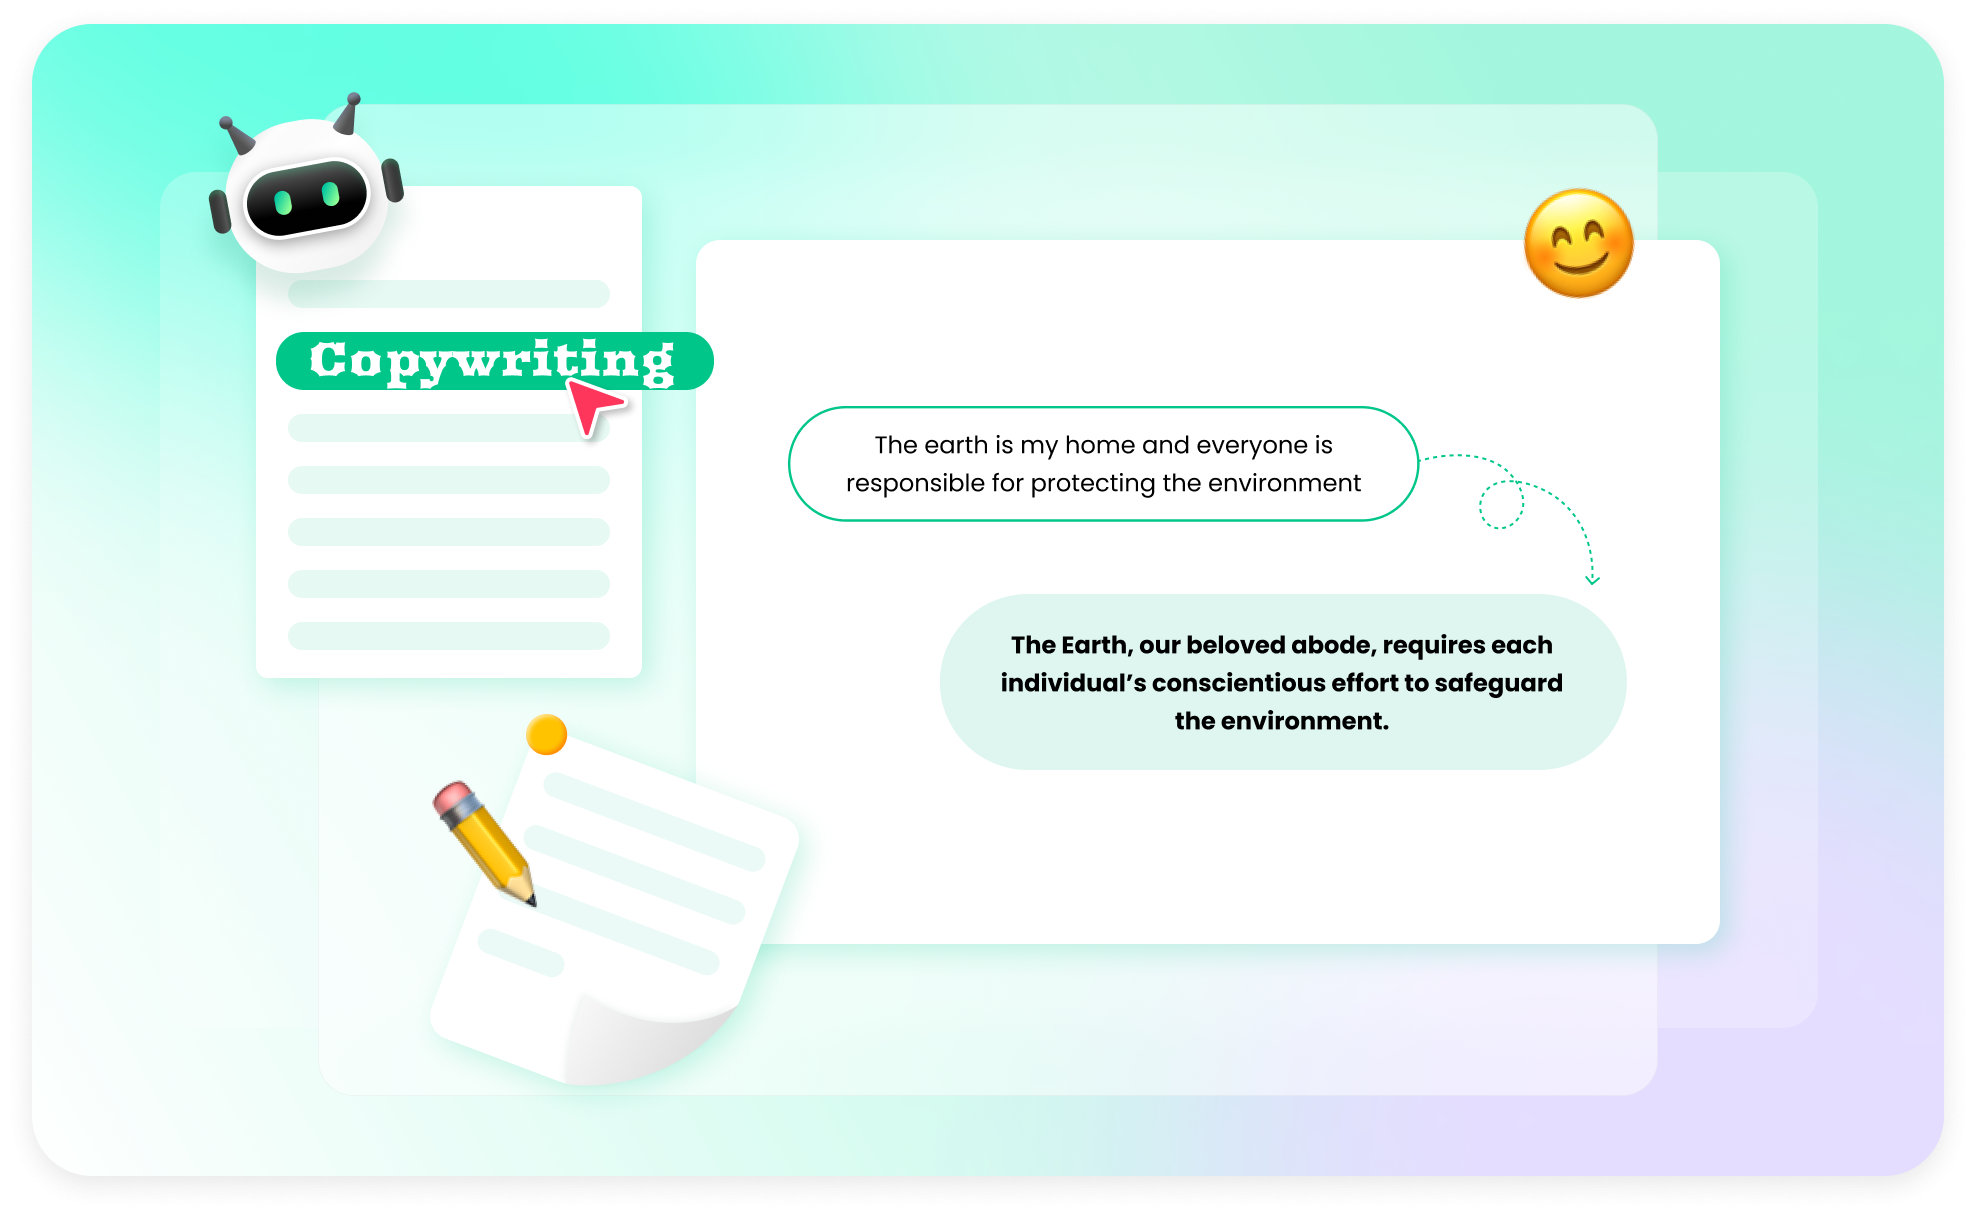
 Unleash creativity for brainstorming
Use the power of bubble maps during brainstorming sessions to
generate fresh ideas, concepts, and solutions. Capture all your
thoughts related to a central theme and establish connections
among them. By visualizing the relationships, bubble maps
provide a valuable tool for unlocking creativity.

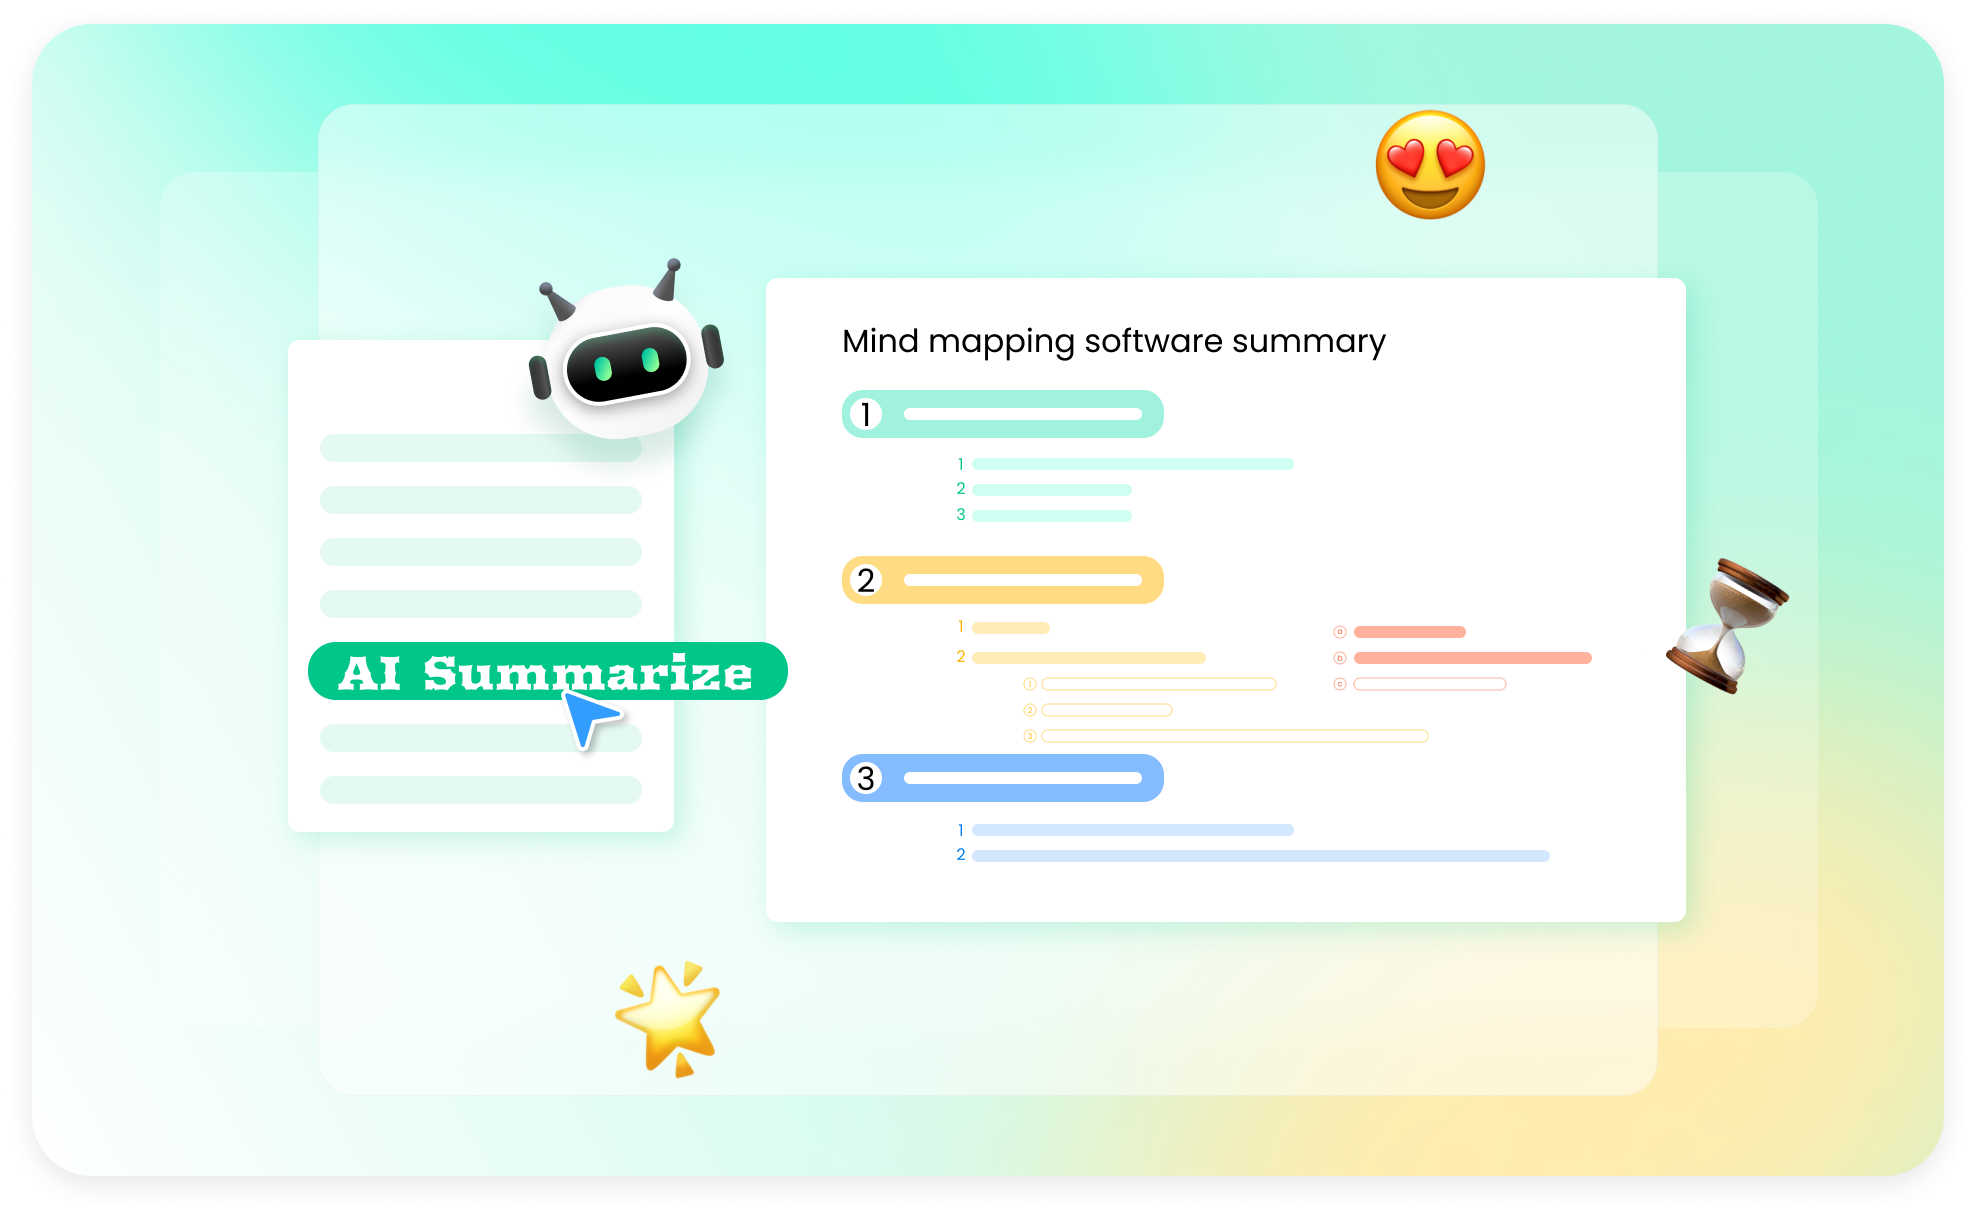
 Organize ideas efficiently
Harness the organizational power of bubble maps to effectively
structure information. Group related ideas or concepts and
establish connections between them using lines, resulting in
clear and distinct categories. This visual approach highlights
relationships, facilitating a comprehensive understanding of
complex or multi-faceted subjects.

 Simplify problem-solving
Utilize bubble maps to gain a comprehensive understanding and
make informed decisions. When you are solving a problem, bubble
maps prove invaluable in analyzing factors and identifying
potential solutions. By visually mapping out elements, causes,
consequences, and solutions, you can effectively evaluate the
pros and cons of various options.
How to make a bubble map?
-
Step 1: Choose a way to start
Get started with a ready-made template from EdrawMind or start from scratch. -
Step 2: Add or remove bubbles
Edit the template to meet your needs or create subtopics around the central topic if you start from scratch. -
Step 3: Connect bubbles
Connect the bubbles with connector lines you have created to show their relationship. -
Step 4: Customize the bubble map
Customize the bubbles by adjusting their size, color, or style. Add icons or text.
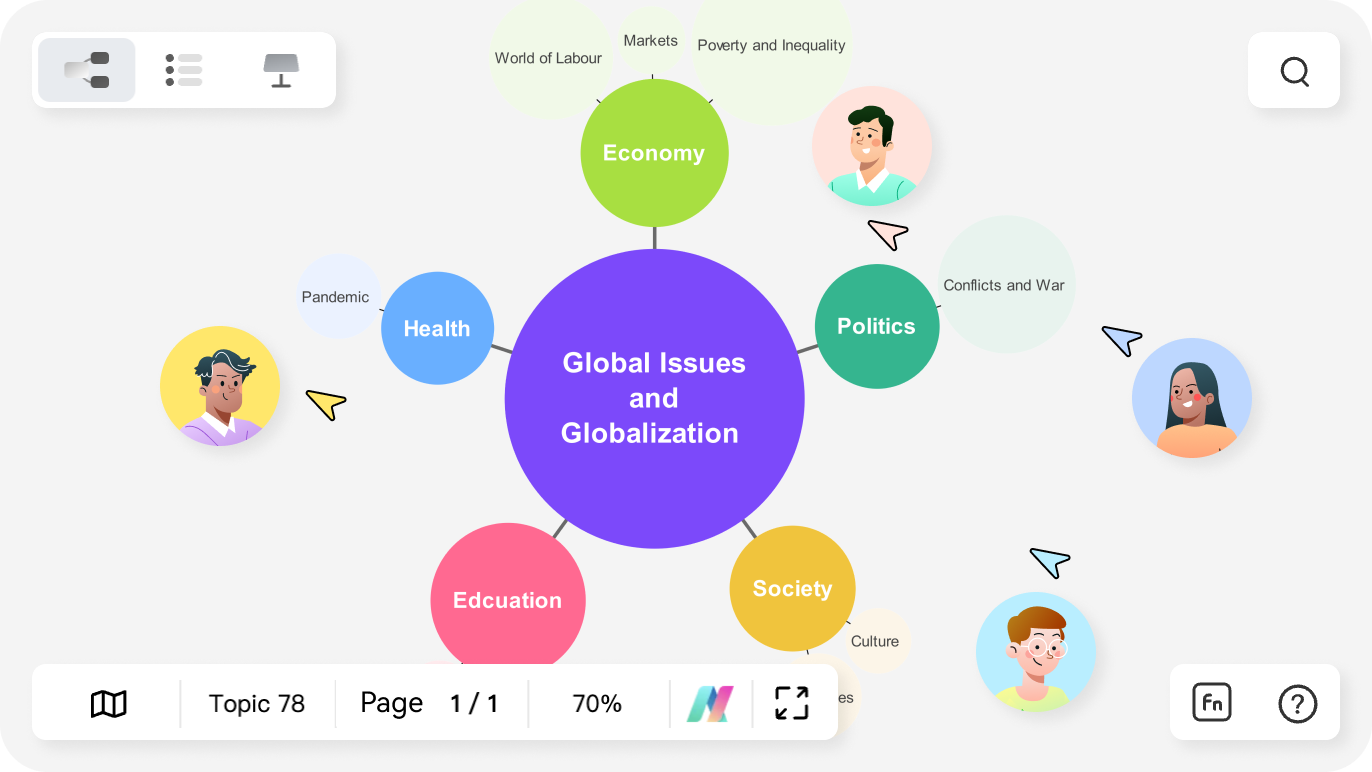
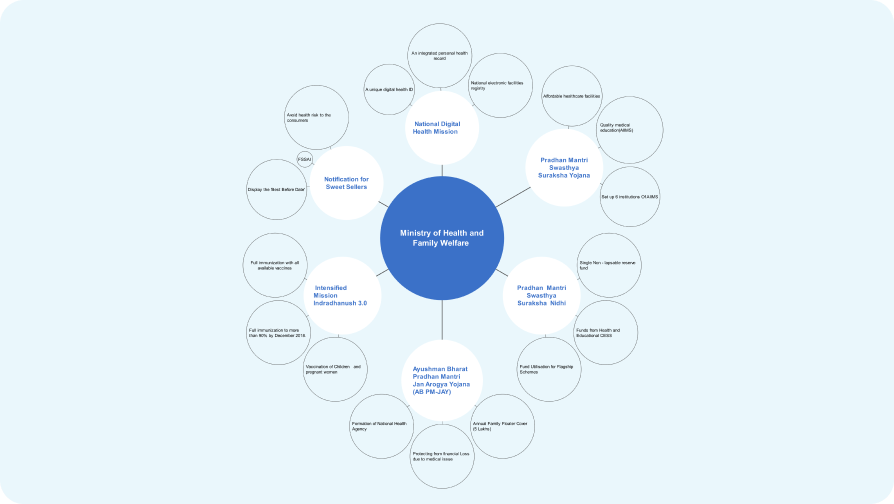
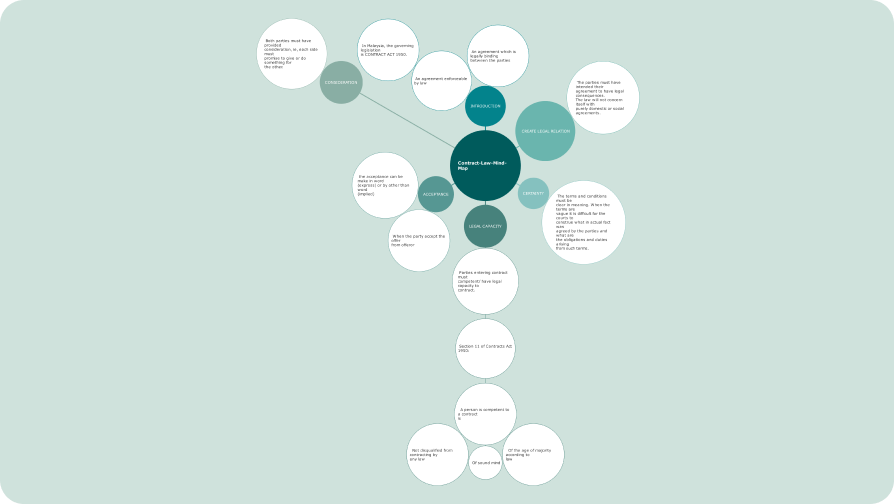
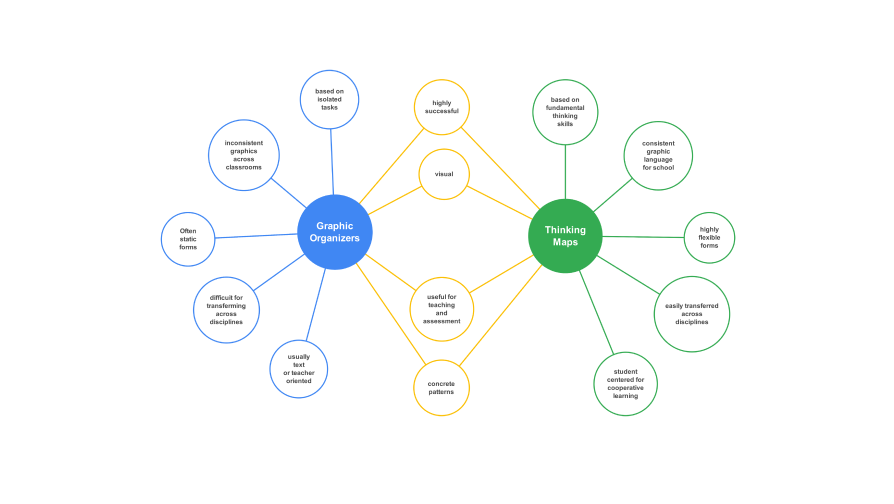
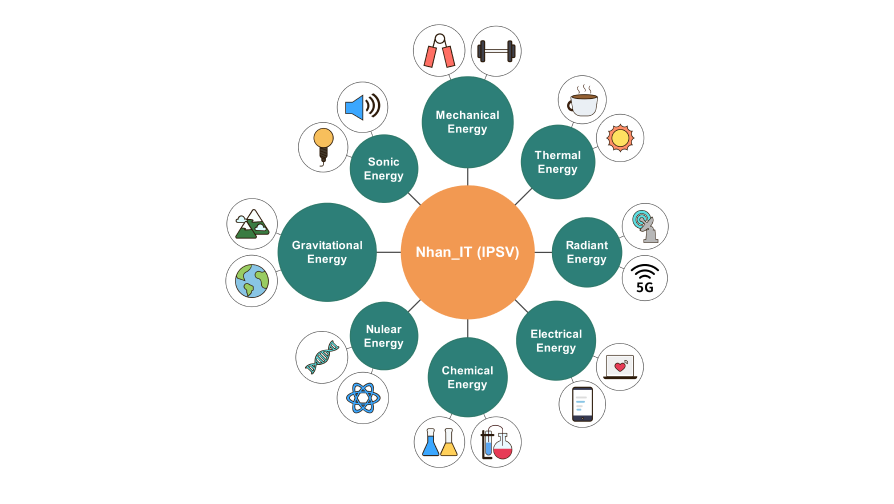
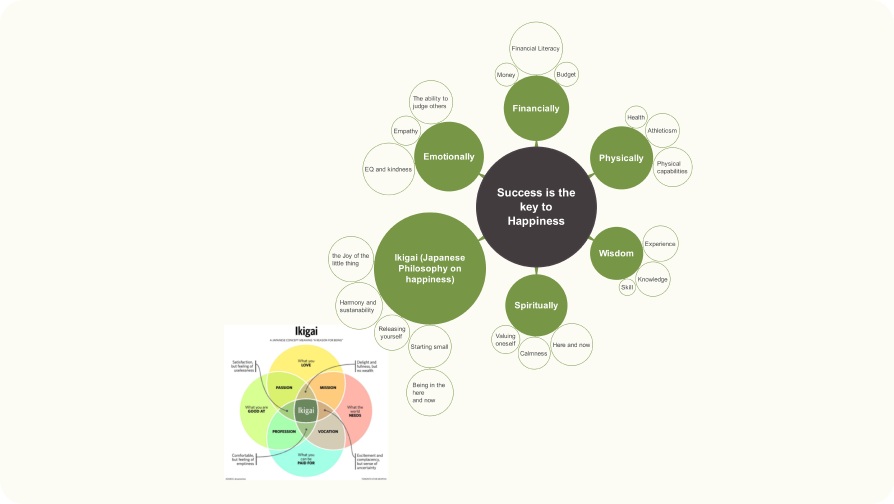
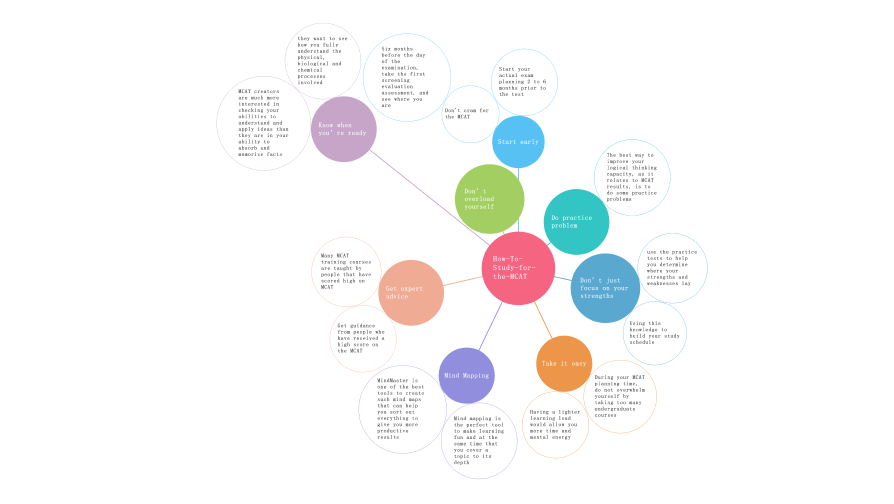
Bubble map templates in EdrawMind
EdrawMinder voices

A great solution for students, teams, and
decision-makers to work together, share ideas, and
break down complex topics.
I found EdrawMind to be very useful and helpful in
assisting me in my ability to simplify complex
knowledge, information, and ideas into orderly
structured mind maps.
It has all the features that every user needs.
There's no other mind map app on the marketplace
that is at the same level as they are. EdrawMind is
a supreme product.

Bubble map maker FAQs
What is the difference between a tree map and a bubble map?
The main difference between a tree map and a bubble map
lies in their representation of data. A tree map
visualizes hierarchical data using nested rectangles,
while a bubble map represents categorical data using
circles/bubbles.
What is the characteristics of a bubble map?
A bubble map is a type of graphic organizer that uses
bubbles or circles to represent ideas or concepts. It is
often used to brainstorm and visually organize
information, with the main idea in the center and related
ideas branching out.
Is there any editable bubble map example?
Definitely. You can find a number of free editable bubble
map examples from EdrawMind's gallery, with a variety of
themes and styles for you to choose from. With the
ready-made templates, you can easily start and get
inspired by works of professionals.
How do I create a bubble map in Excel?
To create a bubble map in Excel, go to "Insert" > "Charts"
> "Bubble". Assign data values to X and Y axes, and use a
third data series for bubble size. Customize the chart by
adjusting labels, axis scales, and formatting options.
What website or app can be used to make a bubble map?
You can use EdrawMind to create a bubble map. It features
a beginner-friendly UI and rich templates. In addition, it
offers a free version with access to most of its features.
Also, you can access EdrawMind online.
How do I make a bubble map on Google Docs?
To create a bubble map in Google Docs:
Step 1. Enter data in a table format.
Step 2. Select the data.
Step 3. Click "Insert" and choose "Chart."
Step 4. Select "Scatter chart" type.
Step 5. Customize the chart by adjusting labels, titles, and marker styles for bubble representation.
Step 1. Enter data in a table format.
Step 2. Select the data.
Step 3. Click "Insert" and choose "Chart."
Step 4. Select "Scatter chart" type.
Step 5. Customize the chart by adjusting labels, titles, and marker styles for bubble representation.
Ignite your creativity with EdrawMind AI's futuristic mind mapping.