


Root Cause Analysis (RCA) is a systematic procedure used to identify the causes of a problem. It can help in the investigation of factors contributing to those causes. This analysis type identifies the reasons for system failures and allows continuous improvement. Hence, it is often used for developing strategies to avoid future errors.
RCA diagrams allow for the visual representation of the causes of a problem. These diagrams are not only attractive infographics but also offer a structured approach to brainstorming ideas.
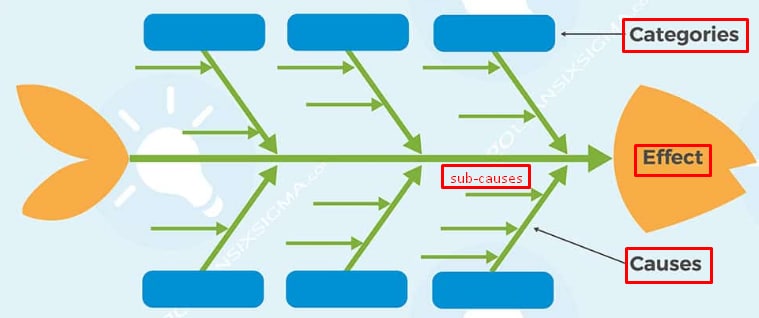
The mouth of the diagram highlights the effect/problem, whereas the extending branches/bones are responsible for cause identification. These causes can further branch into sub-causes to better identify the root cause.
In this article
What is a fishbone diagram?
The fishbone diagram is the other name for a cause-and-effect diagram. It allows one to investigate the root cause of a specific problem. Though spotting the root cause is the major goal, the diagram can also depict minor issues. It can also highlight the reasons behind the major cause, i.e., sub-cause of a problem.
Thus, the diagram is important when adopting strategies and coping measures. The term fishbone was first given by Kaoru Ishikawa in 1990 and features a fish body design. The mouth depicts the problem, while bones highlight the causes and sub-causes.
There are six major categories to group the causes. These are; methods, measurements, materials, people, machines, and environment. These are suitable for problem identification in different sectors. This includes but is not limited to marketing and manufacturing industries.
How to use the fishbone diagram for root cause analysis?
Fishbone root cause analysis isn’t rocket science. You only need the following 5 steps to point out the analysis.
Step 1Pin down the problem statement
Pin down the problem statement at the mouth/head of the fishbone diagram. The problem statement refers to the major issue faced. For example, in the manufacturing industry, this could be improperly packaged goods. It could also be the lack of allergen information on the delivered items.
Step 2 Name the categories
Use the six major categories to group the cause behind the problem occurrence. In the example stated above, this could be people, materials, and methods. Identifying the categories will help in narrowing down the choices at the end.
Step 3 Identify the causes
Brainstorm the causes/reasons behind the occurrence of the problem. Write them down on the bones/branches in the diagram. Ask 'why' questions and list down as many causes as possible. For example, Why were the goods packaged incorrectly? Why were the goods not checked for allergen information before delivery?
Step 4 Investigate the sub-causes
Keep asking the 'why’ questions and identify the sub-causes. These sub-causes branch out of the main causes in the form of smaller bones. For example, the peanut was not labeled as an allergen. You could ask, ‘Why were peanuts not listed as an allergen on the chocolate bar?
Step 5 Spot the root cause
Continue asking why until you find the answer and identify the root cause of the problem. For example, here, the peanut was not labeled. This is because the chocolate bar does not contain peanuts. Then the one drawing out the root cause analysis diagram can ask, ‘Why did the allergen end up in the chocolate bar?
Follow this trail of thought until you identify the root cause of the problem. Here, this might be cross-contamination. This is because of the use of the same site for manufacturing peanut butter and chocolate bars.
Tips for using a fishbone diagram
Here are some tips to improve your fishbone diagram root cause analysis.
- Use an erasable medium to draw the fishbone diagram. This will help you with hassle-free modification and provide room for errors.
- Continue seeking sub-causes for problems unless you run out of ideas. This can be useful when working in a team and can lead to the identification of new causes and sub-causes.
- Remember to focus on causes rather than effects. You already have the problem, the focus is cause identification and problem resolution.
- Keep asking ‘why’ questions until you achieve a satisfactory result. Asking the ‘why’ questions can help you brainstorm. When coupled with the 5W and H techniques, i.e., (when, what, who, why, where, and how), it can contribute to an effective outcome.
- Finally, during teamwork, ask your groupmates to each highlight three root causes. This voting session will make it easier to pin down the root cause of the problem.
Root cause analysis of fishbone template
The above fishbone diagram contains elements essential for diagnosing the root cause. This includes problem statements, categories, causes, and sub-causes, as highlighted below.
The above fishbone diagram contains elements essential for diagnosing the root cause. This includes problem statements, categories, causes, and sub-causes, as highlighted below.
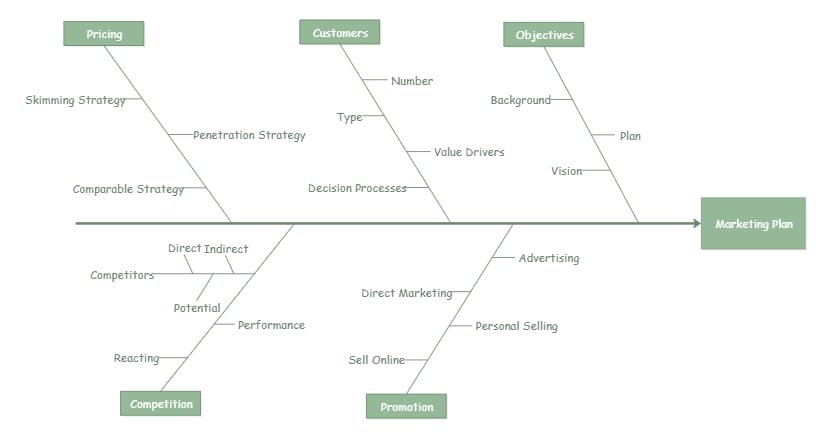
- Categories: pricing, customers, objectives, competition, promotion.
- Causes:
Pricing (skimming strategy, penetration strategy, comparable strategy).
Customers (number, type, value drivers, decision processes).
Objectives (background, plan, vision), Competition (competitors, performance, reacting).
Promotion (advertising, direct marketing, personal selling, selling online). - Sub-causes: Sub-causes in this diagram are Competition > competitors > (direct, indirect, potential).
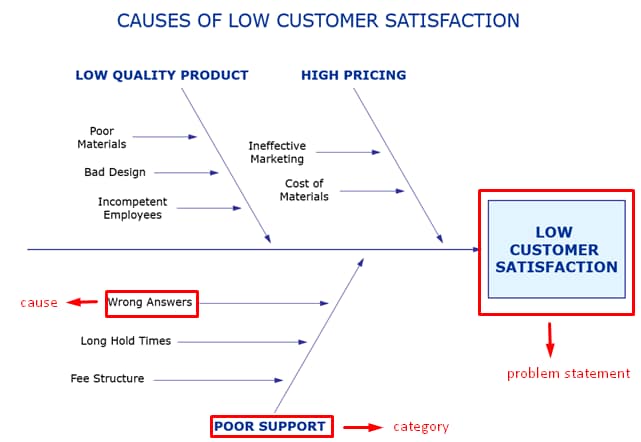
In this example, the root cause of the problem can be declining customer satisfaction. The main category would be poor support from the customer support team. Different causes include a lack of personnel, long waiting times, and wrong answers. This wrong answer is further subdivided into a lack of knowledge about the product.
So, the final outcome is Declining Customer Satisfaction > Poor Support > Wrong Answers > Lack of Knowledge about the product. So, the root cause of the problem is a lack of knowledge about the product.
Conclusion
A fishbone diagram is a perfect visual to brainstorm the causes behind a specific issue. However, things get messy if you do not leave room for additions and errors as you explore new causes. To be honest, it might be difficult to achieve best results with paper mapping techniques.
These methods limit your ability to modify an existing diagram without disrupting it. The best way to do root cause analysis is EdrawMind. It can help you perform all modifications without any hassle or mess. Plus, the tool utilizes artificial intelligence to help you generate maps and brainstorm ideas in a snap.
What’s best about this software is its over 6,000 available templates. In simple words, you get free ready-made fishbone templates that you can edit and use as your own. Hence, allowing you to focus on the fishbone root cause analysis without any concern. No stress of creating a template, no worry of losing the data, and the beginner-friendly interface makes RCA even easier.
Frequently Asked Questions
-
1. How do you perform a fishbone analysis?
You can perform fishbone analysis by drawing mind maps. These maps state the problem’s categories and causes. The head of the fish indicates the problem while the protruding bones depict the causes and sub-causes. -
2. What are the 4 P's of root cause analysis?
The four P technique is often adopted during the fishbone root cause analysis. The P specifies four categories that can outline various causes of the problem. These include place, process, people, and policies.
