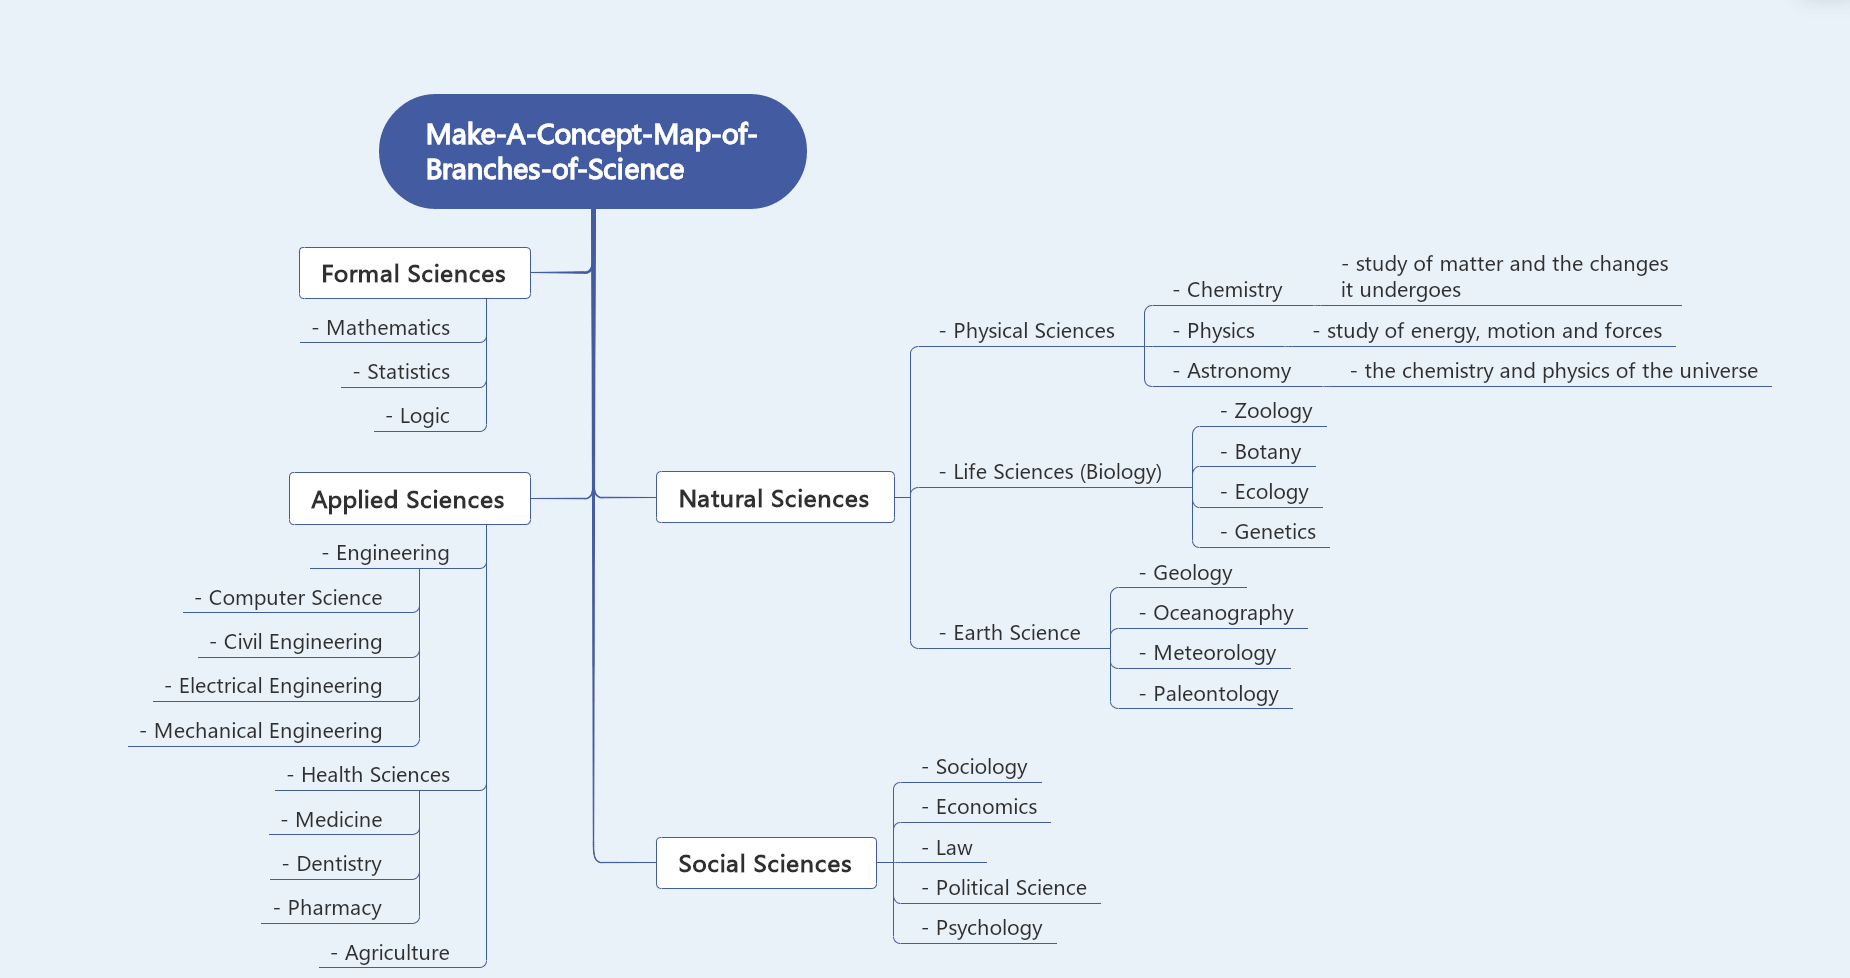
In a fast-paced world where information overload is a daily challenge, the ability to simplify complex ideas, foster creativity, and enhance learning is a prized skill. Thinking maps can help you achieve these goals quickly and with perfection. From empowering students to facilitating effective problem-solving in the professional world, these maps offer a structured approach to clearer thinking and communication.

In this blog, we will discuss what is a thinking map and its benefits. We’ll also explore how it can simplify your cognitive processes and provide 8 examples with usable templates to help you gain better insights.
In this article
What is a Thinking Map?
A thinking map is a highly effective graphic organizer used in various educational settings. It is a valuable learning tool that benefits students, educators, researchers, curriculum developers, consultants, and trainers alike.
Thought maps provide a structured framework for brainstorming, organizing information, and problem-solving. The maps are commonly used to enhance critical thinking, comprehension, and communication skills necessary for academic success.
The Benefits of Thinking Map
Thinking maps offer several benefits in various educational and professional contexts:
- Enhanced Critical Thinking: Thinking maps encourage individuals to analyze, categorize, and connect ideas. They promote critical thinking skills by requiring users to organize thoughts in a structured manner.
- Effective Learning and Comprehension: These visual tools help students organize information about any complex subject matter in a structured way and aid in memorization and comprehension.
- Problem-Solving: By helping individuals break problems into their components and identifying patterns and connections that might not be immediately obvious, thinking maps make it easier to identify solutions.
- Collaboration: In group settings, thinking maps promote collaborative thinking. They provide a visual framework that can be shared among team members, fostering effective teamwork and idea generation.
- Versatility: Thinking maps can be applied across various subjects and disciplines, from science and mathematics to literature and history. They can be adapted for different thinking processes, making them versatile tools.
- Improved Communication: These visual tools are especially useful for explaining complex ideas to others, making presentations, or summarizing information.
- Goal Setting and Planning: Thinking Maps can be used to set goals, plan projects, and outline strategies. They provide a roadmap for achieving objectives and tracking progress.
- Creative Thinking: Thinking Maps also leave room for creativity. Users can customize them to suit their needs and thinking processes, allowing for creative exploration of ideas.
Thinking Maps Examples
There are many types of thinking maps that help individuals organize information, analyze concepts, and visualize relationships. Each thinking map serves a unique purpose, making them valuable aids for various educational and problem-solving scenarios.
Below are 8 examples of thinking maps that help you better understand how thinking maps can be effectively employed:
1. Circle Map
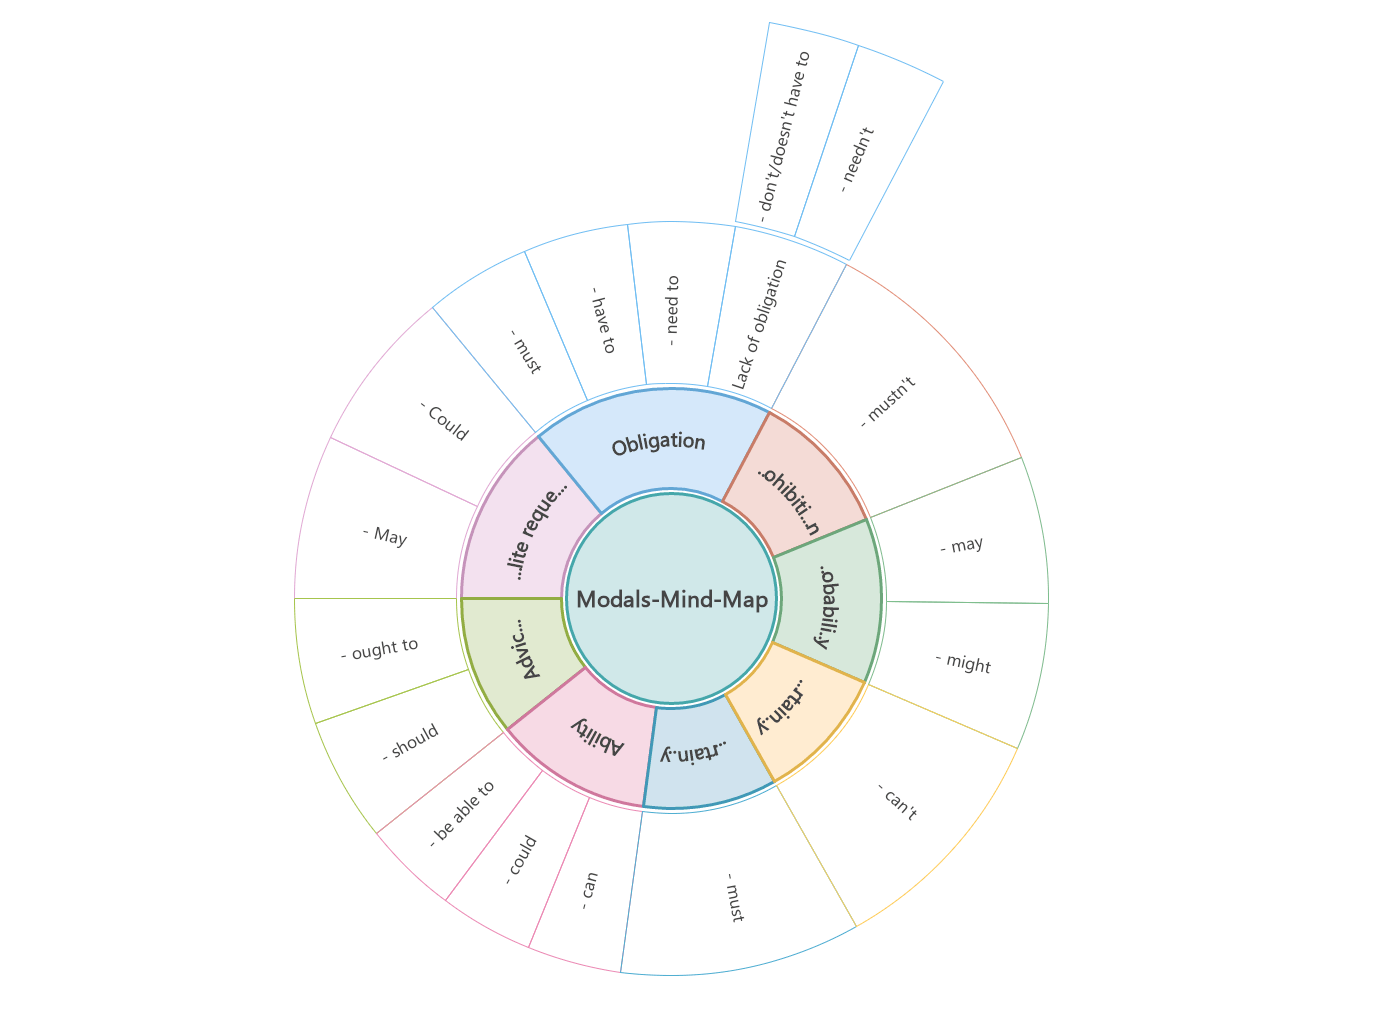
The circle map is a type of thought map used to define and explore a central concept or topic within a particular context. It assists learners in generating relevant information and brainstorming ideas related to the central idea, represented within the center circle.
The main components of a circle map include:
- Inner Circle: This is where you place the central concept or the main idea you want to brainstorm.
- Outer Circle(s): These surround the inner circle, where you place the words or phrases relevant to the central idea.
To create a circle map, draw a central circle and place your idea in it, then expand the central circle by adding relevant terms into segments, creating a larger outer circle. This way, you can organize your thoughts and explore a topic better.
2. Bubble Map
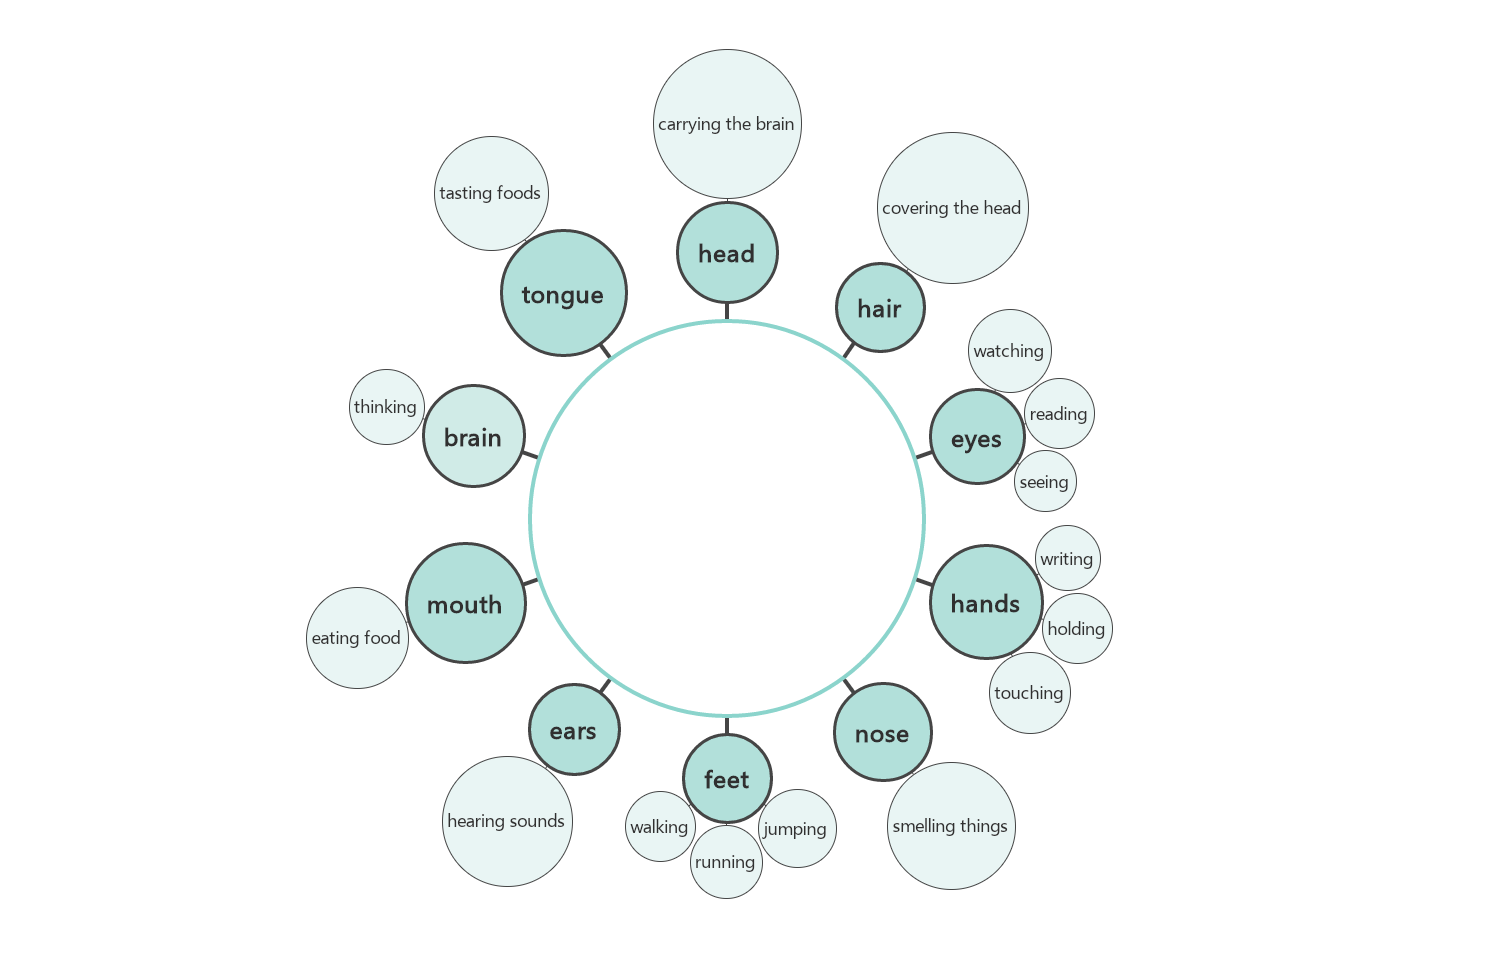
Bubble maps are another type of thinking charts serving the same purpose as circle maps but different in structure. It has an inner circle–a bubble that contains the central idea or concept, but instead of the larger outer circle, it contains smaller bubbles enclosing the terms relevant to the inner term. These terms are connected to the inner bubble with the lines.
Imagine a Bubble Map as a cluster of bubbles floating on a surface, where the central bubble represents the core idea and the smaller bubbles around it hold the supporting terms and ideas. This visual arrangement helps individuals organize their thoughts, identify relationships, and explore a topic in a structured and creative manner.
3. Flow Map
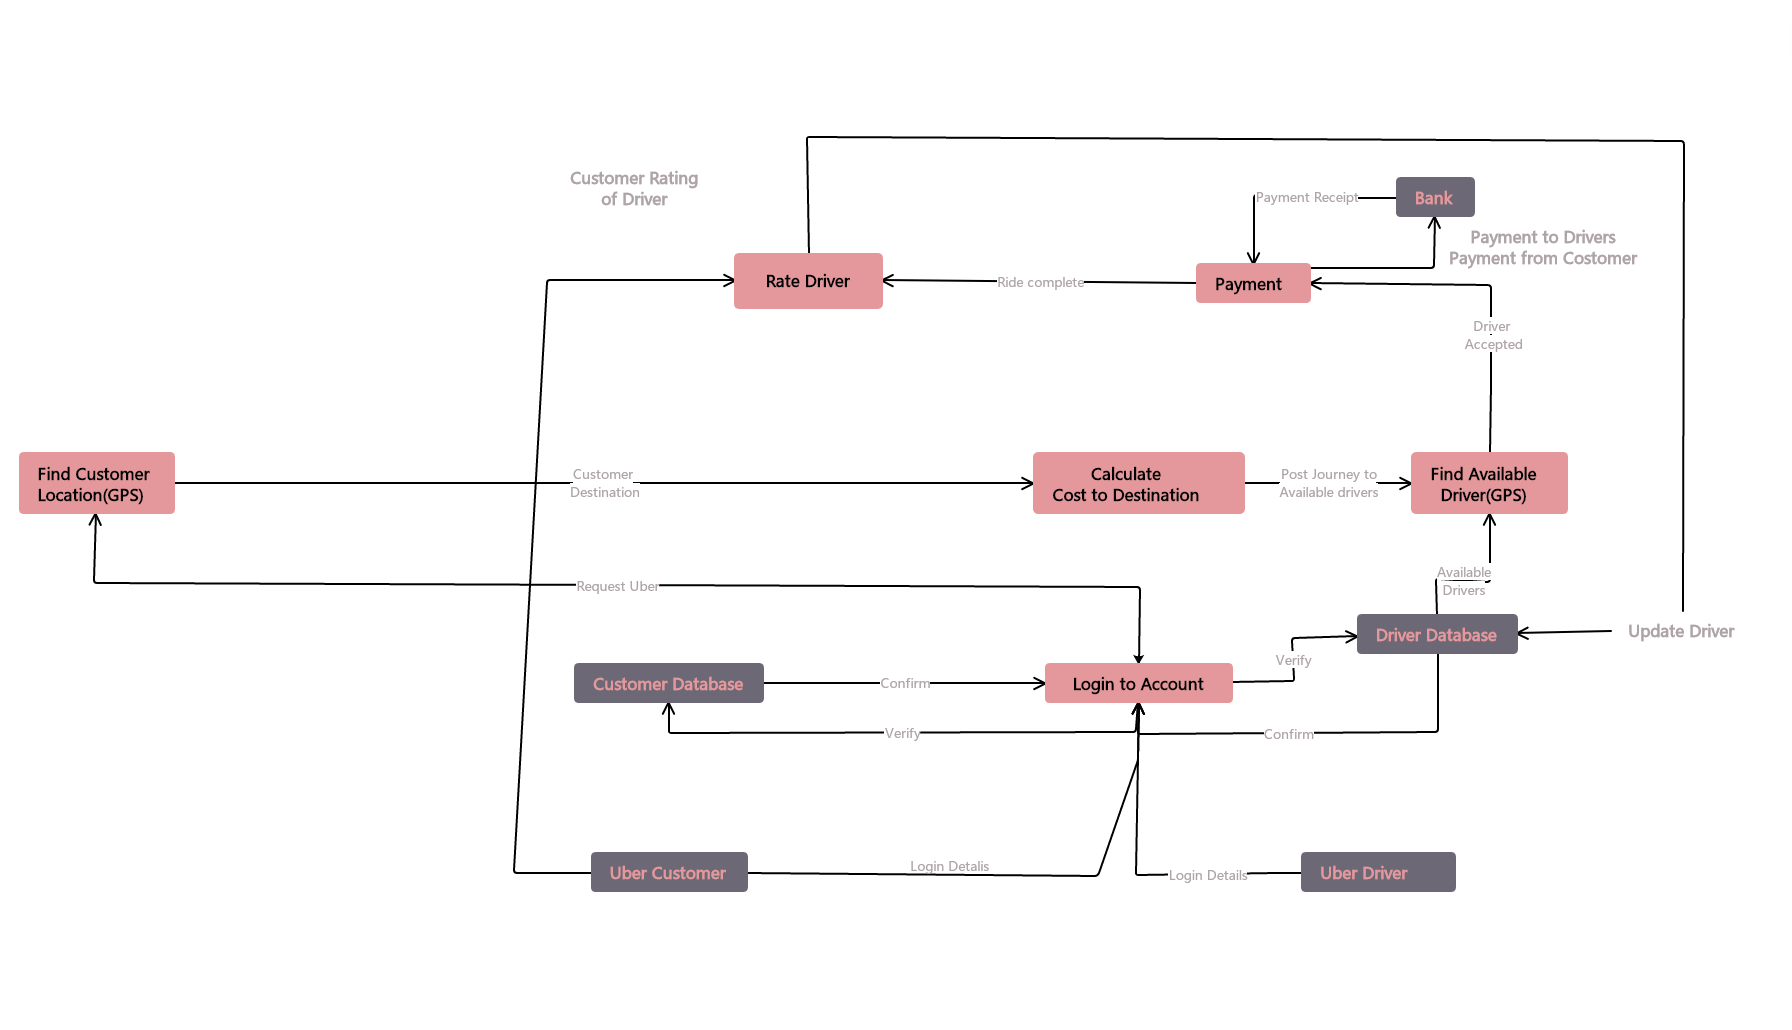
A flow map is used to represent and illustrate the sequence of steps, processes, or events in a clear and organized manner. This visual tool is especially useful for showing how things progress from one stage to another, making understanding complex processes or systems easier.
It is commonly used in various fields, such as project management, process documentation, education, and business analysis, to help people understand and communicate the flow of information, materials, or activities within a system or project.
Some common characteristics of a flow map include:
- Flow Direction: Flow maps use arrows or lines to show the direction of movement or progression from one step or stage to another. This helps viewers understand the chronological or logical sequence of events.
- Nodes or Boxes: A node or box usually represents each step, process, or event in the flow. These nodes contain brief descriptions or labels to explain what happens at each stage.
- Connections: Lines or arrows connect the nodes or boxes, indicating how they are related and the order in which they occur. These connections create a visual path that guides the viewer through the process.
4. Multi-Flow Map
A multi-flow map shows how various elements within a particular subject or topic are interconnected. It is mostly used by students who want to grasp the larger context of their studies.
The primary visual elements in a multi-flow map are arrows and bubbles that work together harmoniously to represent the connections between various aspects of the topic. Arrows symbolize the flow of information or influence, guiding the viewer's eye from one idea to another, while bubbles enclose individual concepts or aspects.
Multi-flow maps provide a straightforward yet highly effective means of conveying complex ideas. Whether breaking down a multifaceted concept or exploring the interplay of various elements within a subject, these help educators simplify explanations, making it easier for students to absorb and retain knowledge.
5. Brace Map
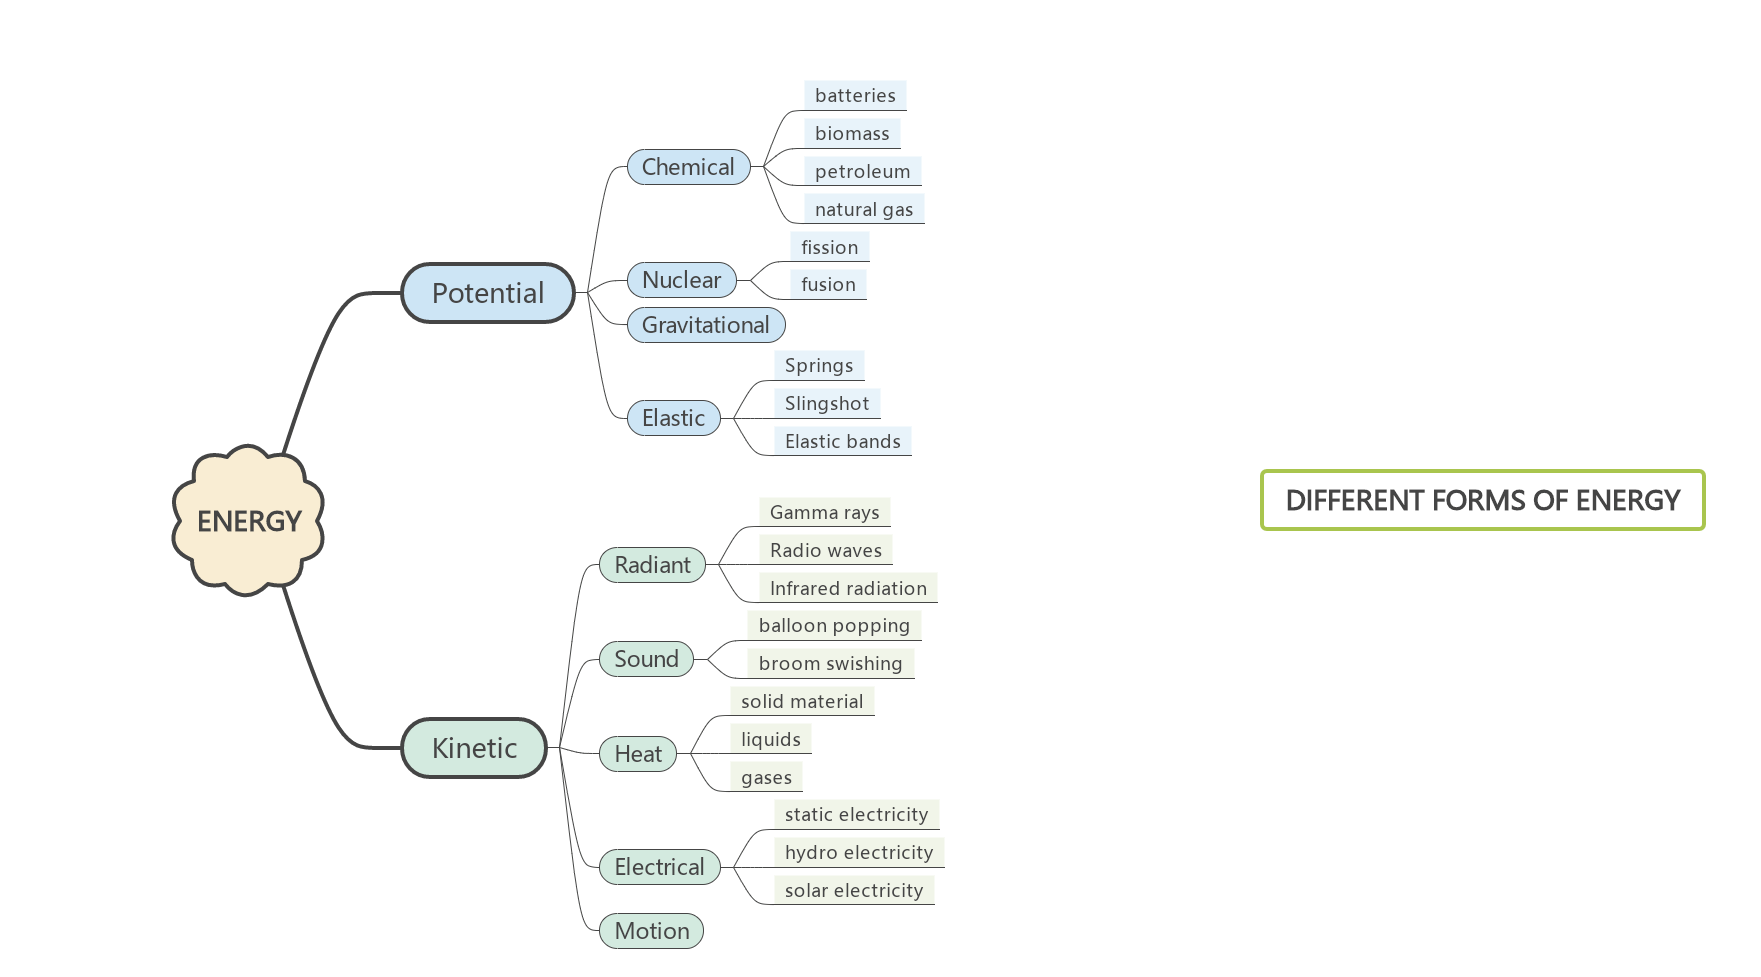
A brace map, also known as a Warnier Orr diagram, was originally designed for program design but is now widely used for breaking down physical objects. It's like taking apart a complex thing to understand it better. You start by focusing on the final result (output) and work backward to determine what you need to make (inputs).
Brace maps help students and businesses explore and learn about objects, making complex things easier to understand. In education, brace maps help students connect new knowledge with what they already know, boosting memory retention by up to 15%. In a business context, they can help break down a product into its components, allowing for cost analysis and improvements.
Creating a brace map involves starting with the whole object, breaking it down into main components, then further into smaller parts, and so on. The map is complete when you've covered all relevant components.
6. Treemap
A Treemap is a technique to visualize data display hierarchical or structured data in a rectangular format. In a treemap, the data is represented as nested rectangles, where each rectangle represents a category, item, or element, and the size and placement of the rectangles convey information about the data.
Treemaps are commonly used in data visualization, business intelligence, and information management to represent complex data structures, explore hierarchical relationships, and communicate data-driven insights effectively. They provide an intuitive and visual means of understanding patterns, proportions, and hierarchies within data sets.
Individuals often use color-coding techniques while creating treemaps to add layers of information. Different colors can represent different attributes or values, providing more insights into the data.
7. Double Bubble Map
A double bubble map is a graphic organizer or thinking map for comparing two subjects, concepts, or ideas. It helps individuals analyze the similarities and differences between two things side by side.
Here's how a double bubble map typically works:
- Main Bubbles: A double bubble map has two main bubbles, one for each subject or concept you want to compare. These bubbles are usually labeled with the names of the subjects.
- Connecting Lines: Connecting lines or branches extend from each main bubble. These lines connect to smaller bubbles or shapes, where you write down specific points of comparison.
- Similarities and Differences: The smaller bubbles with points are used to identify similarities and differences between the two subjects. Similarities are placed in the overlapping area between the two main bubbles, while differences go in the separate parts of each main bubble.
8. Bridge Map
A bridge map is a visual tool that reveals connections and relationships between two different ideas, topics, or areas. Its primary purpose is to identify similarities and differences between pairs of words or cause and effect between elements, allowing a deeper understanding of how they relate. These maps are frequently used for explaining scientific concepts, historical events, and mathematical relationships.
To draw a bridge map, pinpoint the common "relating factors" that link your comparing pairs. These factors serve as the bridge between the two ideas. In each pair, the item at the top of the map relates to the item at the bottom in a specific way. On the right side of the bridge map, you write in the second pair of elements that share the same relationship.
You can extend the bridge maps to include more related factors, providing a comprehensive view of the relationships between the ideas being compared.
Conclusion
Thinking maps are powerful tools that facilitate clearer thinking, enhanced learning, and better problem-solving. Whether you're a student looking to enhance your learning experience or a professional seeking effective problem-solving techniques, these thinking maps provide valuable assistance.
However, to make the process of creating thinking maps even simpler, try EdrawMind. It is a versatile tool with a user-friendly interface and a wide range of templates that help you harness the full potential of thinking maps and streamline your efforts to brainstorm ideas, grasp complex concepts, and communicate more effectively. It's smart to elevate your learning, productivity, and decision-making.
Try EdrawMind today and experience the difference for yourself!


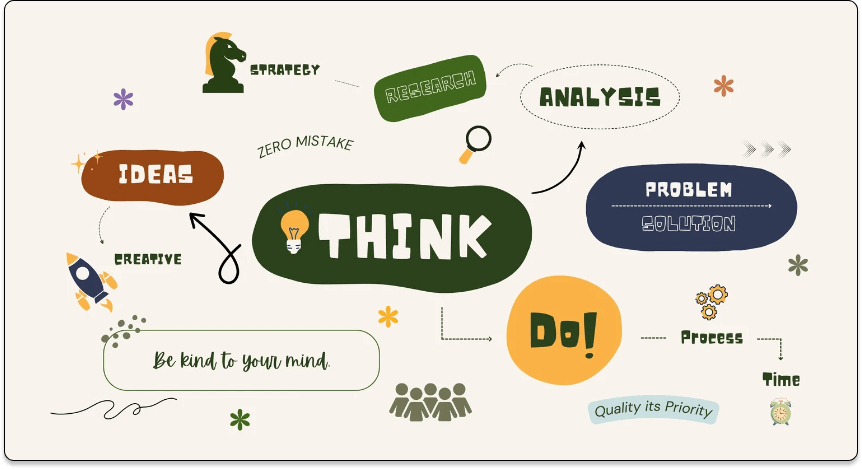
 below.
  below.