


In this article
What is a Cause and Effect diagram?

A cause and effect diagram, commonly known as a Fishbone Diagram or Ishikawa diagram, is a graphical illustration that helps us understand the relationship between various factors that contribute to a specific problem and helps us understand the effect it will have on the entire process.
By conducting a thorough cause-and-effect analysis, teams can easily dissect complex issues into smaller components, leading to a well-structured and holistic approach to problem-solving. With the help of fishbone diagrams, teams can also catch the bottlenecks that might arrive sometime later in the development process and easily brainstorm, using tools like EdrawMind, to find the solution before it's too late.
Some of the importance of creating a cause and effect diagram are:
- Visual Clarity: With cause and effect diagrams, teams will get a visual depiction of the entire problem, which helps them understand the bottlenecks and other root causes.
- Collaborative Analysis: By conducting a cause-and-effect analysis, teams can improve their brainstorming session -- which ultimately leads to a more productive collaborative approach.
- Root Cause Identification: By systematically creating a cause and effect diagram, where we categorize each problem into specific groups, we can easily identify the symptoms and the underlying root cause of all the problems.
Cause and Effect Diagram Example
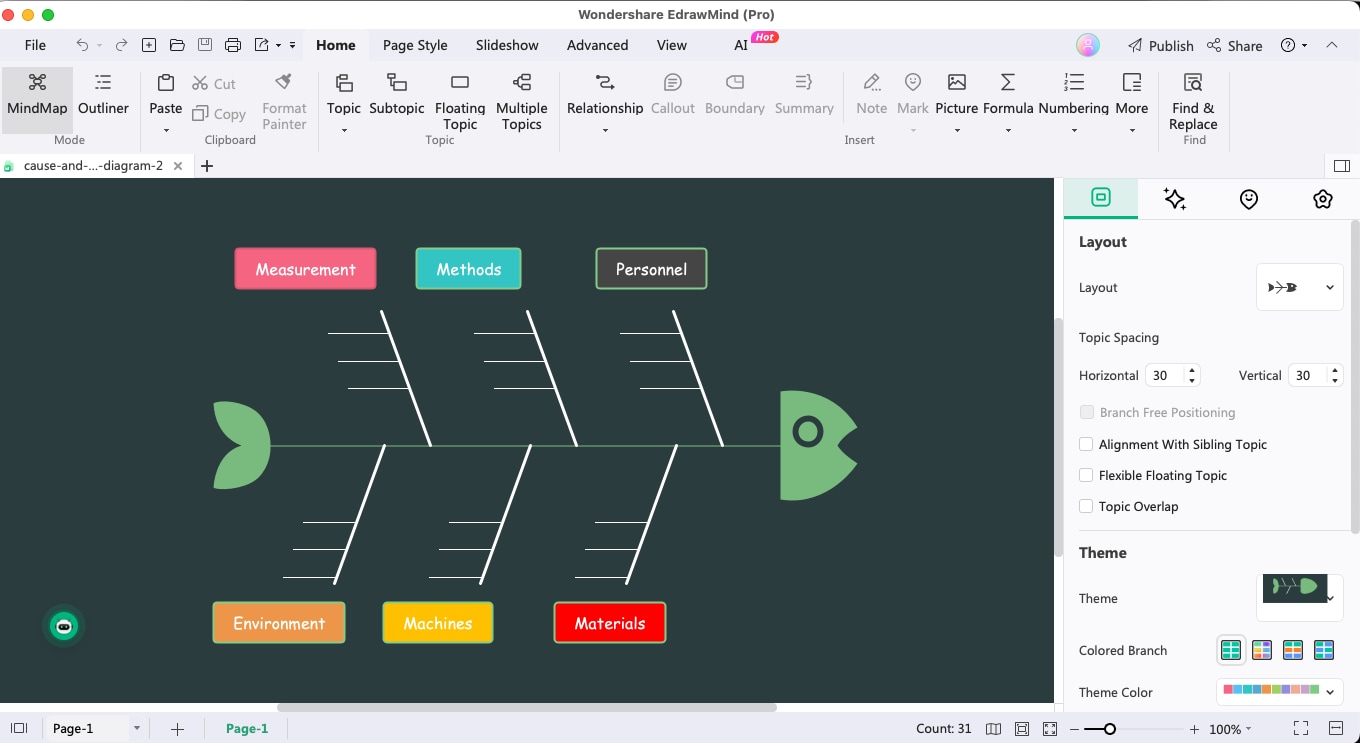
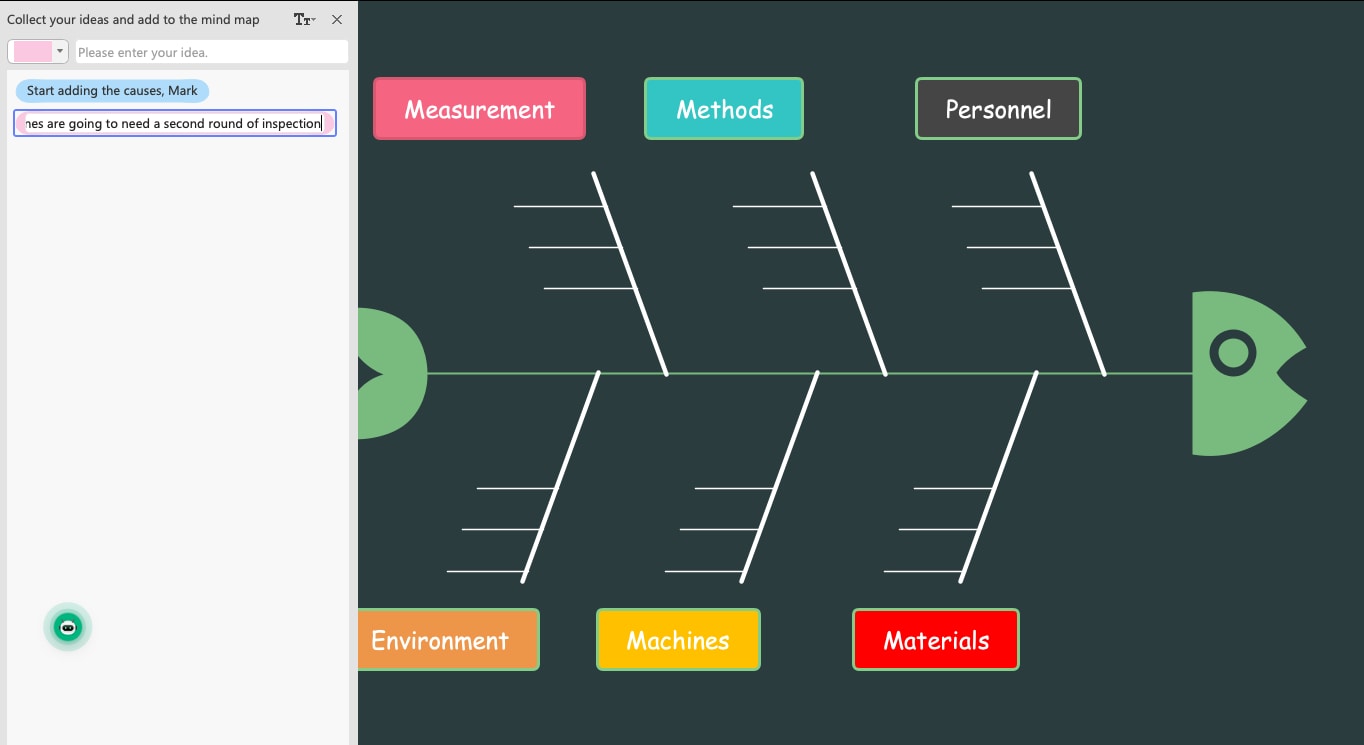
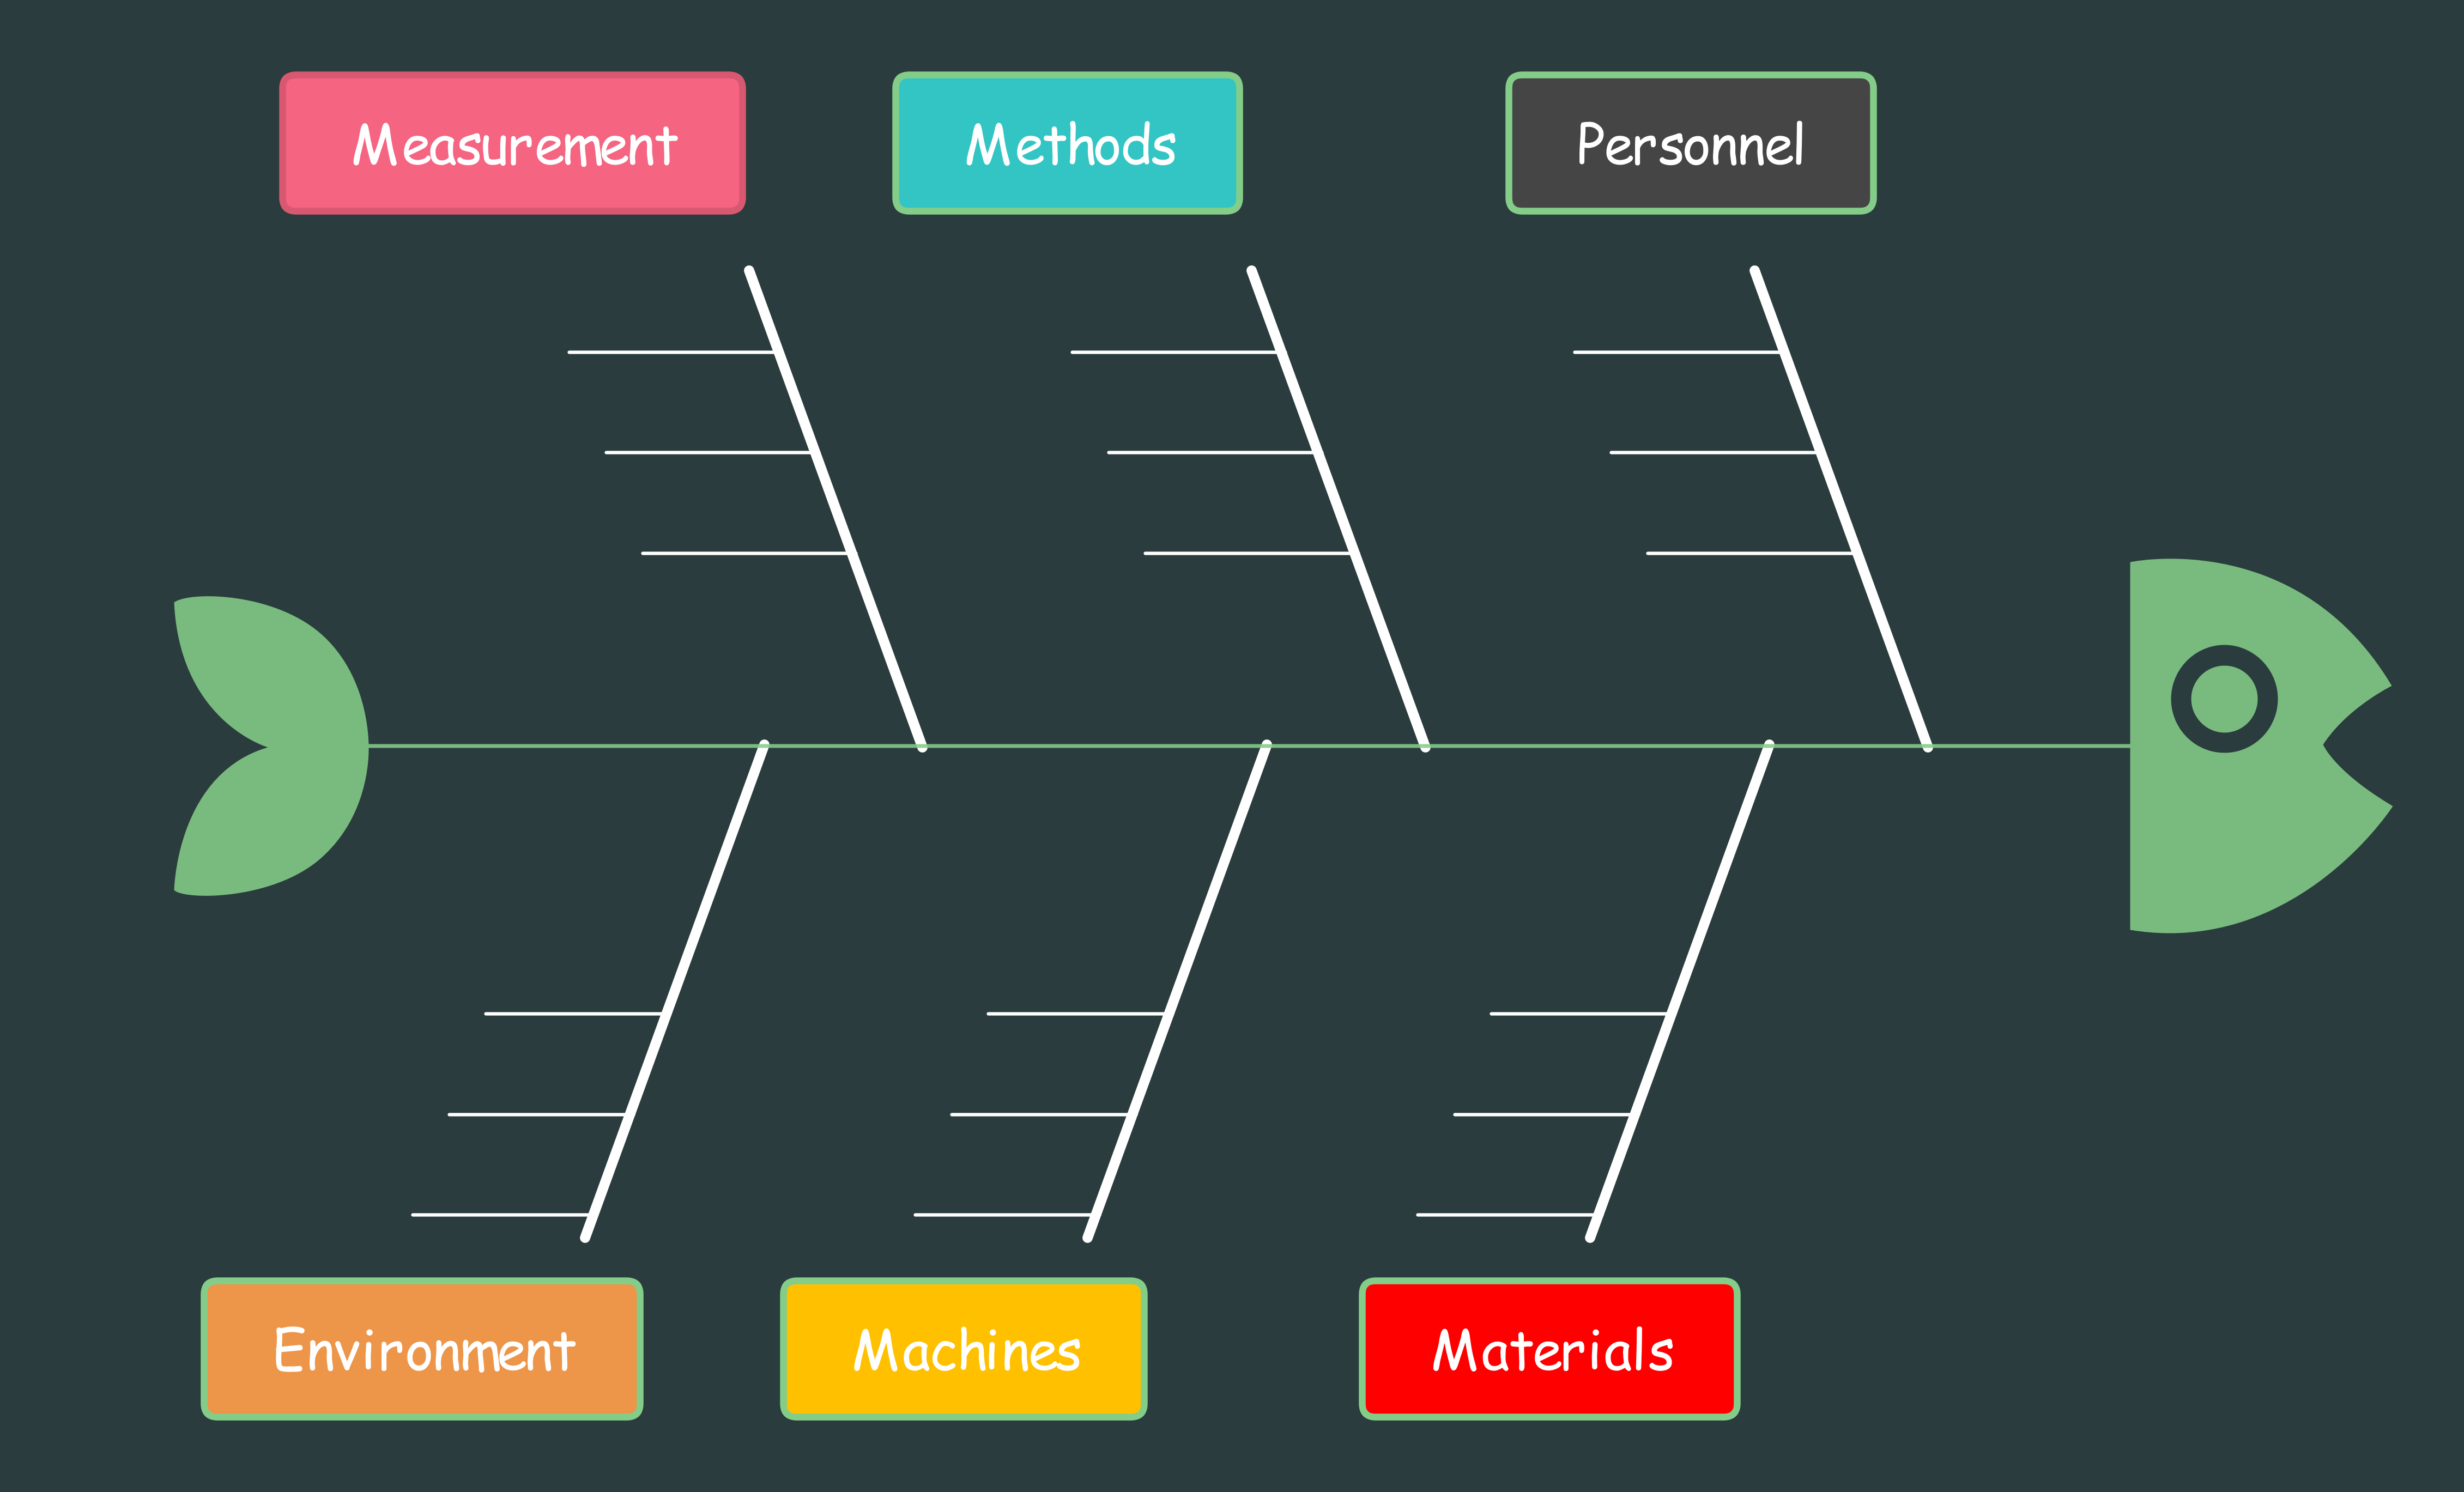
In order to easily understand the fishbone diagram, let us walk you through the following cause-and-effect diagram example created in EdrawMind.
As you can see from this diagram, in the fishl's head, we have added the problem statement in the box. From there, we created a horizontal line representing a fish's spine. We will now start adding the factors that might cause the problem at any stage of the development. By labeling each of these causes, we can later brainstorm effectively.

 below.
  below.
 As illustrated in this cause-and-effect diagram template, we have added potential causes behind every root cause, ensuring we break down the complex problem into multiple smaller segments. After adding all the relevant information, we can customize the template and further brainstorm ideas or even conduct surveys to analyze the process in detail.
This template is created using the built-in features of EdrawMind, which offers more such fishbone diagram templates that are 100% customizable.
3 Basic Types of Cause and Effect Diagram
In order to thoroughly understand the cause and effect diagram, we recommend learning more about the types of cause and effect diagrams. Basically, there are three primary types that help us understand this fishbone diagramming approach more clearly:
- Cause Enumeration Diagram: As the name suggests, a cause enumeration diagram lists all the potential “causes” that would later influence other factors. When we create a cause and effect diagram, keeping this approach in mind, we first lay out the problem on the left using branches to showcase different causes of the mentioned problem. Companies use this approach when they need to thoroughly analyze any problem.
- Dispersion Analysis Diagram: Unlike a cause enumeration diagram, a dispersion analysis diagram groups all the causes into different categories. We use this diagramming process when the potential causes are spread across multiple areas of a given problem, and just looking at the problem in hand won't result in any positive outcome. By following this approach, we can shed light on the broad spectrum of all the causes that might create some sort of hindrance or restrictions.
- Process Analysis Diagram: What sets the process analysis diagram apart from the other two is how it suggests handling the entire “process.” If someone is looking to improve the process of finding an optimal solution, they should go ahead with a process analysis diagram. Such cause and effect diagramming technique breaks down the process into constituent steps that help in identifying the area that might lead to potential issues in the near future.
Main Purpose of Using a Cause and Effect Diagram
At its core, a cause-and-effect diagram functions as a problem-solving tool that helps in analyzing all the root causes of any given problem. By creating detailed cause and effect diagrams, we get a detailed ground to conduct a methodical investigation into different factors that might escalate any particular problem.
Here is how the cause-and-effect diagram works:
- Visual Representation of Relationship: By creating the cause and effect diagram, we can visually illustrate the intricate details along with the relationship between potential causes and their effects. By doing so, we get an understanding of the interconnectedness of different factors.
- Systematic Problem Solving: Since cause and effect diagrams categorize all the causes into specific branches, we can thoroughly analyze different potential influencing factors. Once we resolve one category, we can move on to a different one and repeat the process until all the causes are identified and analyzed.
- Different Symptoms: With tools like EdrawMind, teams can collaborate to analyze the hierarchical structure of the fishbone diagram. This helps them differentiate between different symptoms and their respective root causes.
How to Make Cause and Effect Diagram
Creating a cause-and-effect diagram is educational and fun, as it helps identify all the problems in detail. Additionally, it helps us understand what preventive measures we need to take in order to make informed decisions.
Check out the following steps in order to make a cause-and-effect diagram:
Step1Define the Problem
The first step that you need to follow is to clearly define the problem or effect that actually brought you to conduct the given analysis. Make sure that everyone in the team is well aware of the problem and are thinking in a way to find all the cause, effects, and respective solutions for the same.
Step2Identify Major Categories
There are several categories that might influence the problem. Different factors, like manpower, machine, material, measurement, mother nature, and method, can constitute these categories. Try to create different categories that you think are relevant to your problem.
Step3Brainstorm Causes
Once you have identified all the major categories, you can start your brainstorming session with your team. Sit down with the relevant team members and start asking them relevant questions, which would lead to identifying the potential causes for each category.
Step4Identify Sub-Causes
It is always recommended to break down the causes into multiple sub-causes. This type of agile approach helps identify specific aspects of all the problems. Additionally, once the team creates sub-causes, the chances of missing out on important areas drop down to almost nil.
Step5Analyze Relationships
Try establishing cause-and-effect relationships between different causes and sub-causes. By doing so, one can easily get different insights into the interconnection relationship between different factors that all constitute the given problem.
Step6Analyze Causes
During the brainstorming session, ask your team to assess the significance of each cause and its respective impact on the given problem. If you will conduct cause analysis at different stages, you will stay focused on finding the high-impact areas.
Step7Identify Root Causes
Once you have brainstormed all the causes and their potential influencers, you can conduct a systematic evaluation process, which would help you determine the fundamental causes that will lead to productive problem resolution.
Conclusion
A cause and effect diagram is essential to identify the root cause of any problem and is recommended to avoid unnecessary bottlenecks that might arise in the near future. In this comprehensive guide, we explored the cause-and-effect analysis diagram and showed you the main purpose of using different types of cause-and-effect diagrams. With the help of EdrawMind, you can easily create different brainstorming sessions with your team to make informed decisions and collaborate on different problem-solving processes.
