A concept map is one of the most powerful tools to visualize relationships between concepts. It makes complex information easier to understand. Whether you're a student, educator, or professional, concept maps provide clarity and a structured way to explore ideas.
In this article, we’ll introduce the concept map, explore five different types of concept maps, and guide you on how to create one.
In this article
What is a Concept Map
A concept map or a conceptual diagram is a tool to tell the relationships between concepts, ideas, and thoughts. There's always this major concept in the middle or at the top of the map. Sub-concepts will go branching with arrows or lines.
Compared to mind maps, concept maps can be more free-form. It's a diagram that has no strict formats or standards. It can have one or multiple hubs and clusters while a mind map only has one major topic.
Types of concept maps
The most common and traditional one is the hierarchical concept map. As the name suggests, it has a hierarchical structure. Apart from this, flowchart concept maps, spider concept maps, multidimensional concept maps, and system concept maps are also common types.
Each type works for a wide range of situations. We see people using them in multiple areas like education, engineering, software development, etc.
Hierarchical Concept Map
A hierarchical concept map organizes information in a tree-like structure, with the main theme or concept at the top with related sub-concepts branching out below.
It illustrates the interactions between diverse levels of information, just like an organizational chart, where each level of the hierarchy reflects a different level of specificity or detail.
Who Is It for?
People from various industries can use this map, for example:
- Education: Students, teachers, and researchers can prepare the outlines arrange the notes, or research theories, respectively.
- Businesses and Organizations: Business persons can also use it for project planning, strategy development, and process mapping.
- Counselors and Therapists: Mental health professionals can use this map to explore and visualize client issues and solutions.
A Hierarchical Concept Map Example
To create a hierarchical concept map, ensure you already have planned the important topics/sub-topics to cover and the flow of information.
Then, start with the main idea and branch out the sub-topics strategically– a good hierarchical map should always have a clear hierarchy of information content.
Flowchart Concept Map
A flowchart concept map illustrates the movement of actions or steps involved in a particular process. It includes boxes, circles, and arrows to organize the progression from one action to the next, making complicated workflows or procedures easy to grasp.
Who Is It for?
- Manufacturing: People in the industry can use it to simplify the understanding of production processes and quality control steps.
- Information technology: Software development processes and system troubleshooting can become easier to understand and present.
- Finance: It could illustrate the processes for loan approvals or transaction flows in the finance department for better decision-making.
A Flowchart Concept Map Example
While creating a flowchart, you need to understand flowchart symbols and their uses– rectangles in the diagram represent steps, while diamonds illustrate decision points. Ideally, flowcharts should be logically laid out, and every flowchart should include entry and exit points to the process in question.
Spider Concept Map
A star, web map, or spider concept map, centralizes a concept and distributes subtopics radiating outward from it. It acts as a flexible resource for idea generation and examining the links between a main thought and associated ideas.
Who Is It for?
- Marketing: It aids in creating campaigns by linking thoughts and ideas regarding the theme.
- Research and Development: It is great for deciding on the different areas of the subject, such as research topics or product development.
- Event Planning: It coordinates the ideas and tasks that revolve around a central event theme.
A Spider Concept Map Example
You can create a mind map by keeping the main idea at the center and the sub-topics associated with it move outwards. When it comes to layout, a good spider map should have branches that neatly interconnect the main idea and supporting topics.
Multi-dimensional Concept Map
A multi-dimensional concept map presents complex information from diverse viewpoints. Instead of focusing on linear structure, this kind of map includes various perspectives and illustrates how different elements interact and relate more dynamically. Due to its ability to fuse different dimensions or categories, it is a flexible tool for analyzing various issues.
Who Is It for?
- Project management: It illustrates different project components and their interdependencies through connections.
- Social sciences: It is good for analyzing the correlations between the meaningful factors within social factors and resulting outcomes.
- Strategic planning: They provide clear information regarding different perspectives and show alignment.
A Multi-dimensional Concept Map Example
In a multidimensional concept map, there should be many categories and connections, as shown below. A good map should split the space into layers and depict the relations of objects from different points of view.
System Concept Map
A system's components and interactions form the basis of a system concept map. It illustrates how different parts of a system affect and link to each other, which is usually applied to explain complex systems or networks.
Who Is It for?
- Systems Engineering: To understand and model the engineering systems and some of their sub-components.
- Environmental Studies: When it comes to identifying interactions within an ecosystem and in the case of project environmental assessment.
- Business Analysis: Used for outlining business processes, workflow, and relationships within systems in use within an organization.
A System Concept Map Example
To construct the system concept map, the components in a system and their relation should be demonstrated. As is the case with any concept map, a good system map should emphasize the connections and feedback between the parts of the system and should give a holistic view of the system.
How to Make A Concept Map
EdrawMind is a powerful and intuitive mind mapping software that allows users to visually organize their thoughts and ideas. With a wide range of features and a user-friendly interface, it is a versatile tool for brainstorming, project planning, and organizing information.
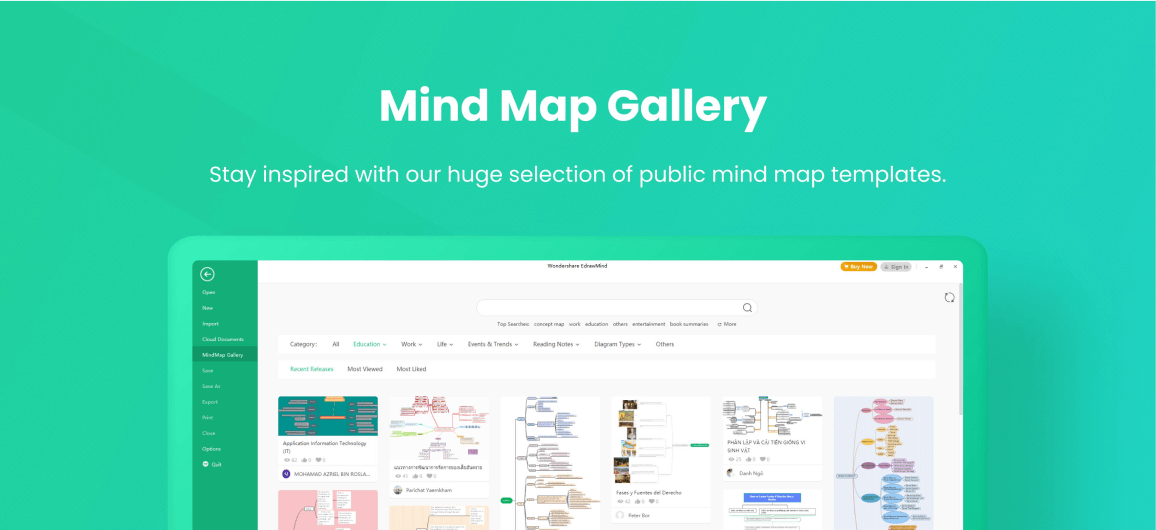
- Mind map gallery?: The software comes with a wide variety of pre-designed Concept map templates, covering different topics and industries. Users can also create their own templates and save them in the gallery for future use.
- Customizable templates: Users can customize the appearance of their mind maps by choosing from a range of themes, styles, and colors.? They can also add images, icons, and hyperlinks to make their mind maps more visually appealing and interactive.

Final Words
A concept map enables you to organize information and makes it easy for the viewers to understand complex concepts easily. Teachers can use these maps for better lesson planning, and these diagrams are a great tool for engineers and research scientists to record all steps of a particular process. The discussion above has presented different types of concept maps to familiarize you with the real potential of this diagram.
Do you want to make a concept for your company's project? If yes, all you need is a dependable mind mapping tool, like Wondershare EdrawMind. It is an AI-powered utility that aims to make mind mapping super easy with some unmatchable features, including AI Presentation, AI Video, One-Click Mind Mapping, and the list continues.
One thing that makes EdrawMind stand out is the availability of a decent collection of pre-built concept map templates and extreme versatility. Moreover, robust toolsets, real-time collaboration, and profound support for multiple file formats (such as HTML, PDF, SVG, PPT, Excel, and Word) add extra value to the credibility of this amazing mind-mapping tool.


 below.
  below.


