Jira is a versatile project management tool used by teams to plan, track, and manage projects. One of the primary ways Jira helps in project management is through Gantt charts. Creating a Gantt chart in Jira provides a timeline of tasks, duration, and dependencies.
The article will guide you on easily creating a Gantt chart in Jira. The page also introduces an alternative tool for more advanced charting needs. Read on to learn more.
In this article
How To Make a Gantt Chart in Jira?
Creating Gantt charts in Jira can significantly enhance project visibility and streamline task management. Jira offers Gantt charting features, making monitoring project timelines and dependencies easier. The platform provides a wide range of charting options that cater to different project needs. The main types include:

Project-Specific Charts: Jira Timelines
Jira Timelines is ideal for tracking work assigned to a single team or department. It provides a project-specific Gantt chart that helps teams monitor their progress toward goals. The collapsible work breakdown structure offers project managers a high-level overview of critical tasks and stories. Jira also includes a free project management template that features Gantt charts, making it easy for teams to adopt this visualization tool.

High-Level Organization Charts: Jira Plans
For larger, cross-organization project planning, Jira Plans is the go-to tool. It helps plan and manage work across teams or the entire organization. It includes advanced tools such as capacity management and automatic scheduling. The high-level organizational chart is crucial for teams that need to manage dependencies and track progress on a larger scale.

Steps To Create a Gantt Chart in Jira
Jira does not include a built-in Gantt chart creator. The platform uses plugins to simulate a Gantt chart. You can easily add this functionality by following these steps:
Step 1: Install a Gantt Chart Plugin
To install a plugin, go to the Jira dashboard and choose the Atlassian Marketplace. Search for your chosen Gantt chart plugin. Follow the installation instructions provided by the plugin. Popular options include BigPicture, Advanced Roadmaps (formerly Portfolio for Jira), and WBS Gantt-Chart for Jira.

Step 2: Launch the Gantt Chart Plugin
After installing the plugin, you can access it from the Jira dashboard. The plugin will add a new tab or option in the project menu. Click this tab to open the Gantt chart interface provided by the plugin.

Step 3: Filling Details of the Gantt Chart
Choose a project where you want to create a Gantt chart. Configure the chart settings, including start and end dates, task dependencies, and milestones. This will form the foundation of your Gantt chart.

Step 4: Refining the Gantt Chart
Add tasks from your project backlog to the Gantt chart. Assign a start and end date to represent its duration. Use the drag-and-drop feature to adjust timelines and link tasks to indicate dependencies.

Step5: Final Review and Saving the Gantt Chart
Adjust timelines, set dependencies, and apply filters to focus on specific tasks, teams, or sprints. Once you are satisfied with the Gantt chart, save it and share it with your team.
Make Gantt Charts Easier and Faster in a Dedicated Tool
While Jira is robust and feature-rich, its primary focus is project management rather than diagramming. This can make creating Gantt charts harder than usual. It can potentially lead to missed features or less intuitive charting experiences.
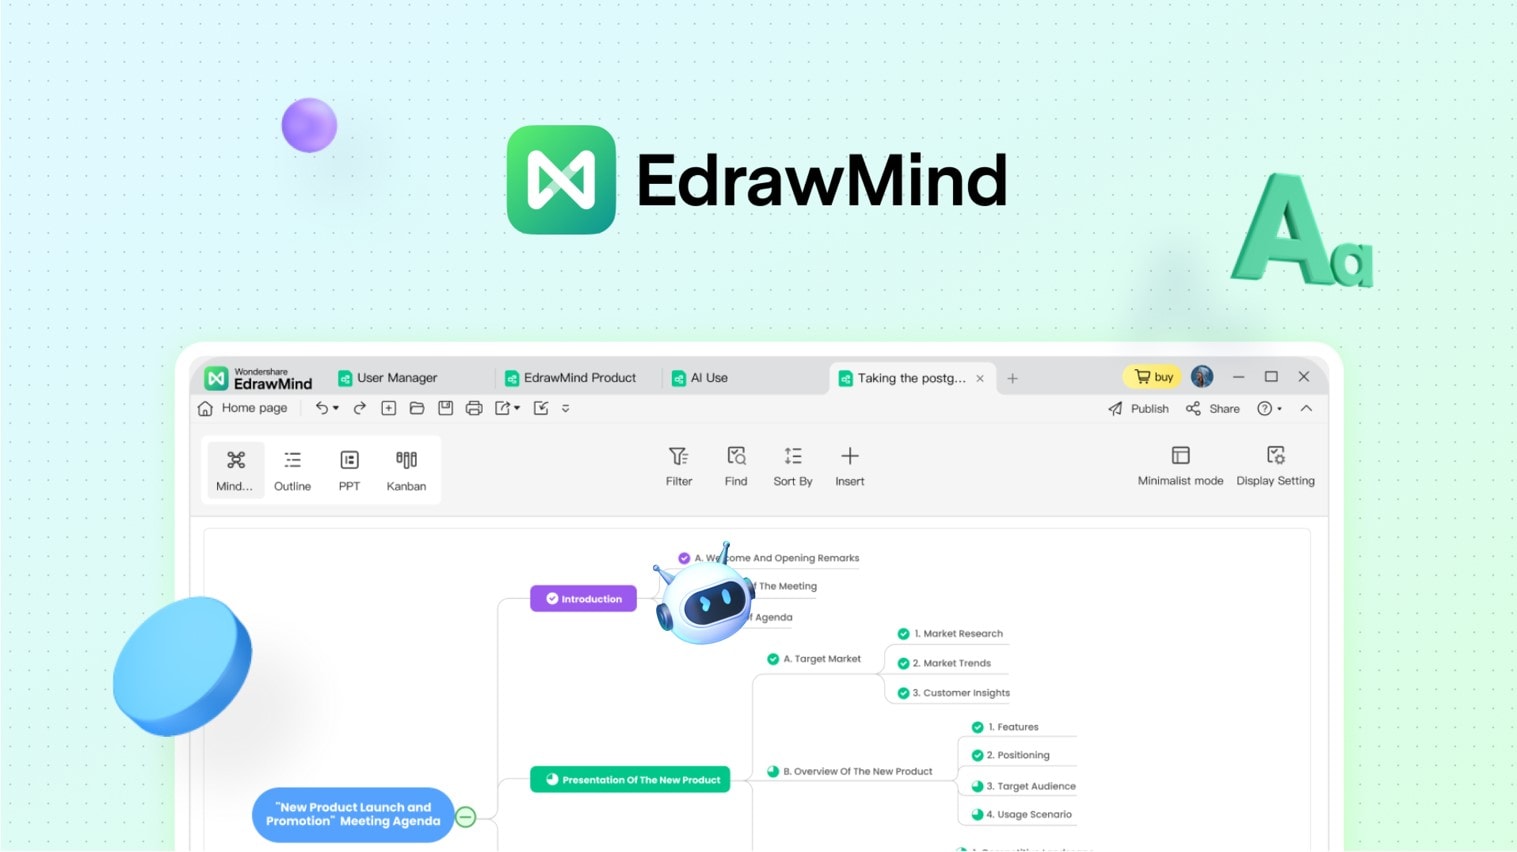
For a more dedicated and feature-rich experience, consider using Wondershare EdrawMind. EdrawMind is a comprehensive diagramming tool that offers advanced Gantt chart functionalities. Here’s how to use it:

EdrawMind is a free Gantt chart maker that offers advanced Gantt chart functionalities. Here’s how to use it:
Step 1: Download, Install, Register, and Launch
Download and install EdrawMind on your computer. Launch the software and log in or register a Wondershare account to get started. Next, click on Create > Local MindMap to start a project.

Step 2: Create a Gantt Chart
Go to the Advanced tab on your top toolbar and click the Gantt chart option. Choose a topic and click the add task info icon in the Setting Task menu on the right. Click delete task info to delete tasks.

Step 3: Save the Gantt Chart
Add the data format, major unit, minor unit, the start time, and the finish time. Type a name for your Gantt chart in the saving window. Click Save. Export the Gantt chart in a compatible format.

Step 4:
Attach the exported Gantt chart to your Jira project as a reference or documentation.
What Is Wondershare EdrawMind?
Having seen the powerful capabilities of EdrawMind for creating Gantt charts, here’s what makes the tool stand out. The key features of EdrawMind are its:
- Intuitive interface: EdrawMind offers a drag-and-drop interface that simplifies the creation of complex diagrams.
- Rich templates: The tool provides a wide range of templates for different diagram types, allowing you to start quickly.
- Customization: Extensive customization options enable you to tailor diagrams to your specific needs, including color schemes, fonts, and shapes.
- Collaboration: EdrawMind supports collaboration, allowing many users to work on a diagram simultaneously.
- Integration: EdrawMind integrates with various platforms, making it easy to share diagrams or incorporate them into other tools like Jira.
- Export options: You can export your diagrams in many formats, including PDF, PNG, and Microsoft Office formats.
Conclusion
Creating Gantt charts in Jira enhances project management by providing clear timelines and task dependencies. Learning how to make a Gantt chart in Jira is the first step to improving your project management efforts.
However, EdrawMind is a robust alternative for more advanced charting needs. The platform uses an intuitive interface and powerful features. You can also get started right away without needing any plugins. EdrawMind is an excellent tool for all your diagramming needs.


