While working in different sectors, people from high authorities and all other positions experience a couple of problems. It could be a budgeting issue, project delivery concern, sales increment issues, and more. When you present these problems in the visual form, finding their possible solutions becomes easy. This is where different diagrams, maps, and charts play their part.
One such diagram is a fishbone diagram. It has proven to be an excellent tool for solving various problems efficiently. If you are looking forward to exploring this subject in detail, keep on reading. You will find everything from what this diagram is, what benefits it comes with, how to create this diagram and much more.
In this article
- What is a Fishbone Diagram
- What is the Main Purpose of the Fishbone Diagram
- Benefits of Fishbone Diagram
- The Top 5 Fishbone Diagram Makers You Can Try
- Making Fishbone Diagram in Action
- Fishbone Diagram Example: EdrawMind for Creativity and Innovation
- Tips for Making Fishbone Diagrams More Effective
- Final Words
What is a Fishbone Diagram

Presenting the root causes of any problem in the casual graphic, fish-like form is commonly known as a fishbone diagram. You can also call it the “Cause and Effect Diagram” or “Ishikawa Diagram.” This diagram was first introduced by Kaoru Ishikawa.
The problem is placed on the fish's head, whereas the root causes of the same problem are represented by the fish's bones. As soon as the managers identify all the causes of a problem, they start searching for the most viable solution to make sure that the same problem won't happen again.
The diagram is often used in the product development sectors. Similarly, this diagram helps you avoid facing quality problems. The best thing about this diagram is that it troubleshoots the problems before they happen again.
At the same time, a fishbone diagram is frequently used in root cause analysis to resolve the issues associated with quality management and other similar domains. You can also use this diagram as a mind-mapping or brainstorming technique. Plus, it can also be used in the healthcare and nursing sectors.
Read more to learn about the benefits of the fish diagram, and if you want to create it, try none other than Wondershare EdrawMind.
What is the Main Purpose of the Fishbone Diagram
The primary objective of a fishbone diagram is to highlight the potential causes of the defect or problem and to prevent them from happening again. The graphical representation of this structure makes it easier to solve quality-related problems.
Are you searching for when to use a fishbone diagram? Well, there could be different scenarios. If you have to identify all the possible causes of a problem, this diagram will be your supportive hand for sure. At the same time, if your team's thinking has become stale, you can use a fish diagram to get out of this trouble.
Now the possible question coming to your mind would be: where to use the fish bone diagram? If this is something you have in mind, you can use this structure in customer service, manufacturing, health sectors, document management, and more. In addition, this diagram can also be used in laboratories for medical purposes.
Are you concerned about who can use this diagram? Well, anyone facing any issue can benefit from it. Similarly, all industries and entrepreneurs often use this fish-like skeleton to solve various issues.
Benefits of Fishbone Diagram
This diagram comes with a series of benefits. Let's look at the most common ones we enjoy.
1. Makes It Easy to Understand the Problem
The fish diagram presents the problem in a casual graphic format, as stated earlier. This way, it becomes quick and easy to understand the leading issue. Once you understand the potential causes, you can look for solutions accordingly.
2. Identifies the Root Causes of the Problem
Regardless of the nature of the problem you are facing, the fishbone diagram enables you to identify and highlight all the causes that lead to the problem. In addition, it helps you clarify and identify the relationships of various variables. The constant drill-down to the root of different problems simplifies complex problems elegantly.
3. Improves Brainstorming
A fishbone diagram is an incredible tool for both individuals and groups to do either mind mapping or brainstorming. You can enhance your brainstorming abilities with this wonderful model.
4. Eliminates Limited Thinking of Teams
The brainstorming process in the fishbone diagram encourages teams to think out of the box. It keeps them away from thinking in a limited zone. This is how it improves your creative abilities and critical thinking.
5. Enhances Problem-Solving Abilities
When you see the root causes in the visual format while working in a team, your problem-solving skills get significantly enhanced. This is what every entrepreneur and industry person dreams of.
6. Opens New Perspectives
Since the fish diagram allows you to work in teams, you will encounter new opportunities or solutions you have never thought of before.
The Top 5 Fishbone Diagram Makers You Can Try
You will find a couple of fishbone diagram makers in today's market. Some of them offer free services, whereas others are paid. Below is a list of the five top fish bone diagram makers. Let's have a look at their potential.

1. Wondershare EdrawMind
When talking about top-grade fishbone diagram-making tools, it will be unfair if we don't put EdrawMind on top of the list. This tool is not only limited to drawing fishbone diagrams but also allows you to create a variety of other diagrams, like mind maps, outlines, charts, and more.
2. Coggle
It is a leading idea management utility. You can use it to make fish bone diagrams efficiently. This tool allows you to collaborate with each other and explore thoughts, brainstorm ideas, and make plans. To use this tool, you dont need to download any program, as it runs completely online.
3. Canva
It is also one of the most popular design tools being used globally for different purposes. One potential feature of this tool is to create fishbone diagrams. If you want to draw a simple yet elegant fish bone diagram, using Canva will be worth it for sure. With a few clicks, you can make an appealing diagram to find potential solutions to the central problem.
4. Smart Draw
With this tool, you can create Ishikawa diagrams online. All you need to do is to use simple commands to get this job done. It keeps a close eye on the format of the diagram you make to ensure greater readability. You can integrate this tool with other applications, like Google Sheets, Google Docs, Word, Excel, PowerPoint, Jira, and more.
5. Miro
This is a free fishbone diagram maker that works online. Miro is known for offering smooth real-time collaboration for teams. It will be a great helping hand if your team relies on daily visual workflows.
Making Fishbone Diagram in Action
Let's learn how to create a fishbone diagram with EdrawMind. It is all about following a few steps, as listed below.
Step 1:Download, install, and open Wondershare EdrawMind. Sign in with your Wondershare ID or an account of Google, Facebook, or Twitter.
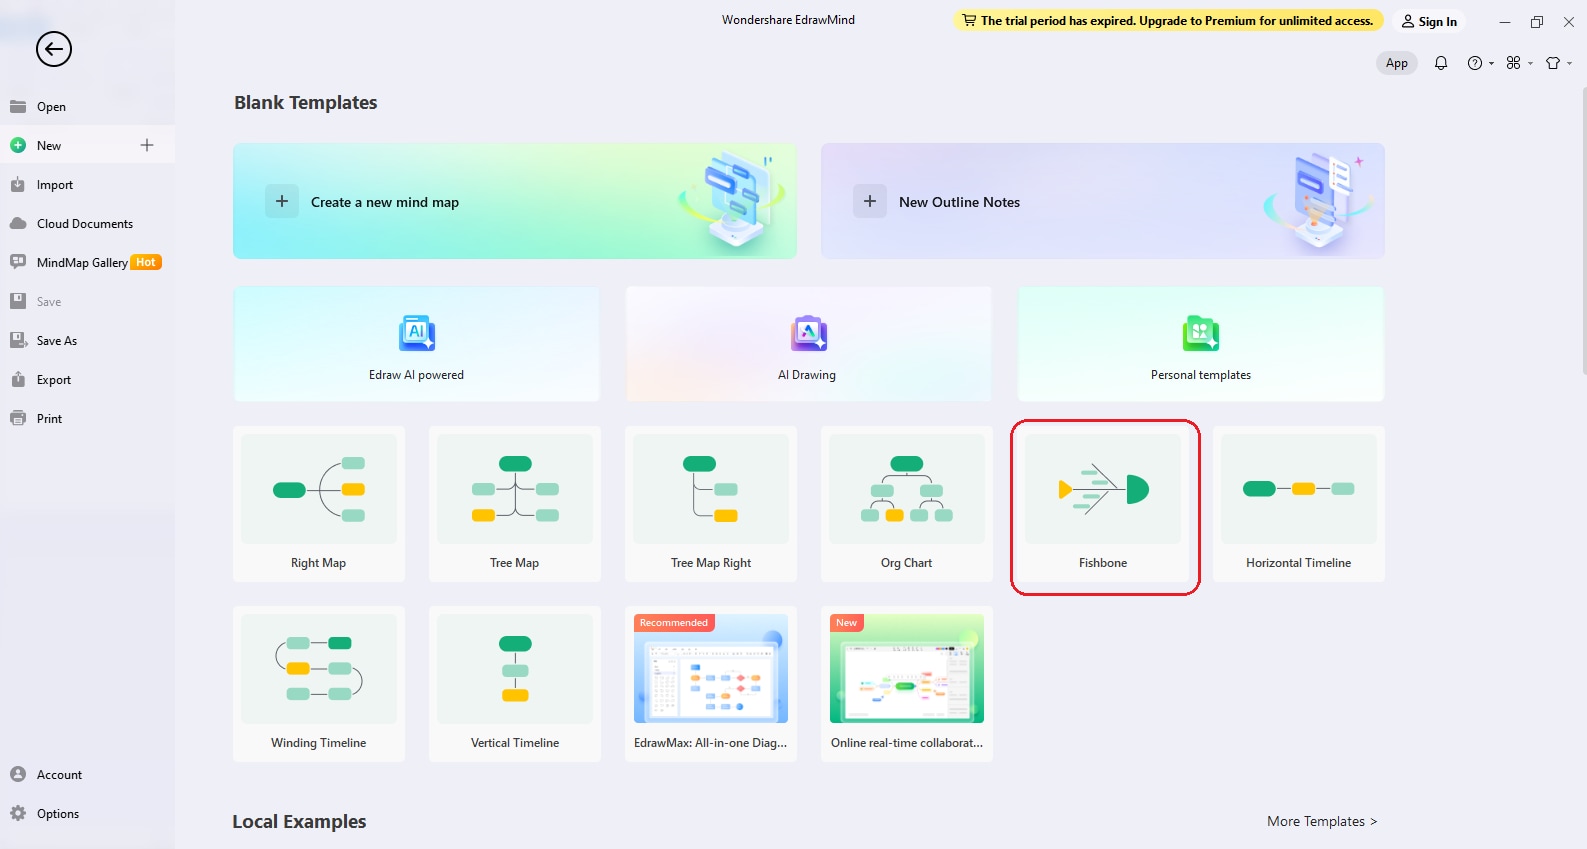
Step 2:On the main interface, you will see different diagrams. From there, tap on “Fishbone”, as shown below.
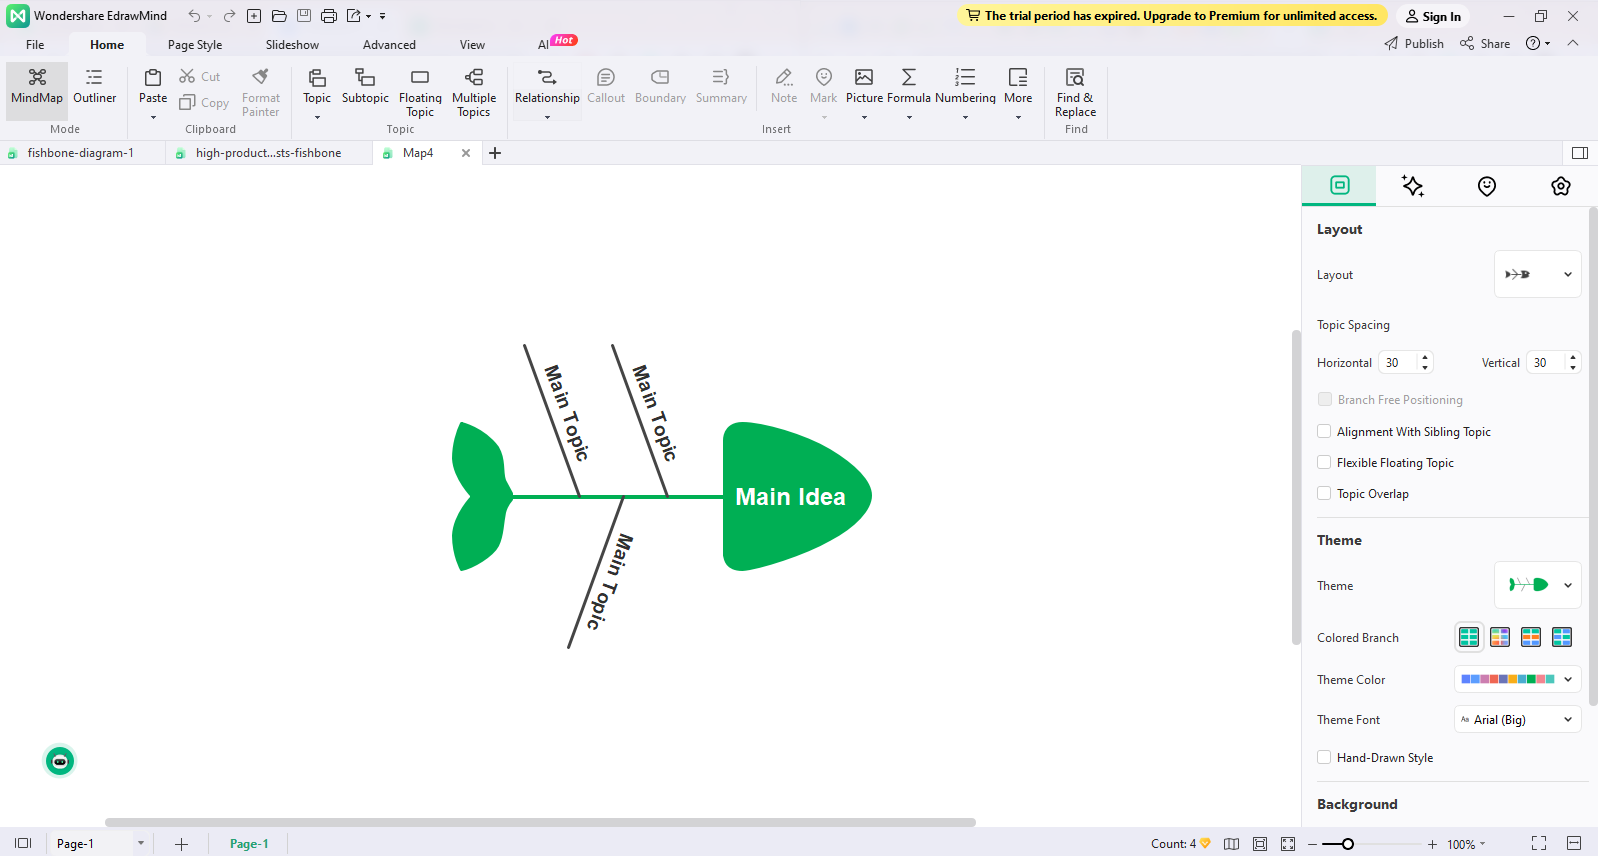
As soon as you tap on the “Fishbone” diagram, a new window will appear, as shown below.
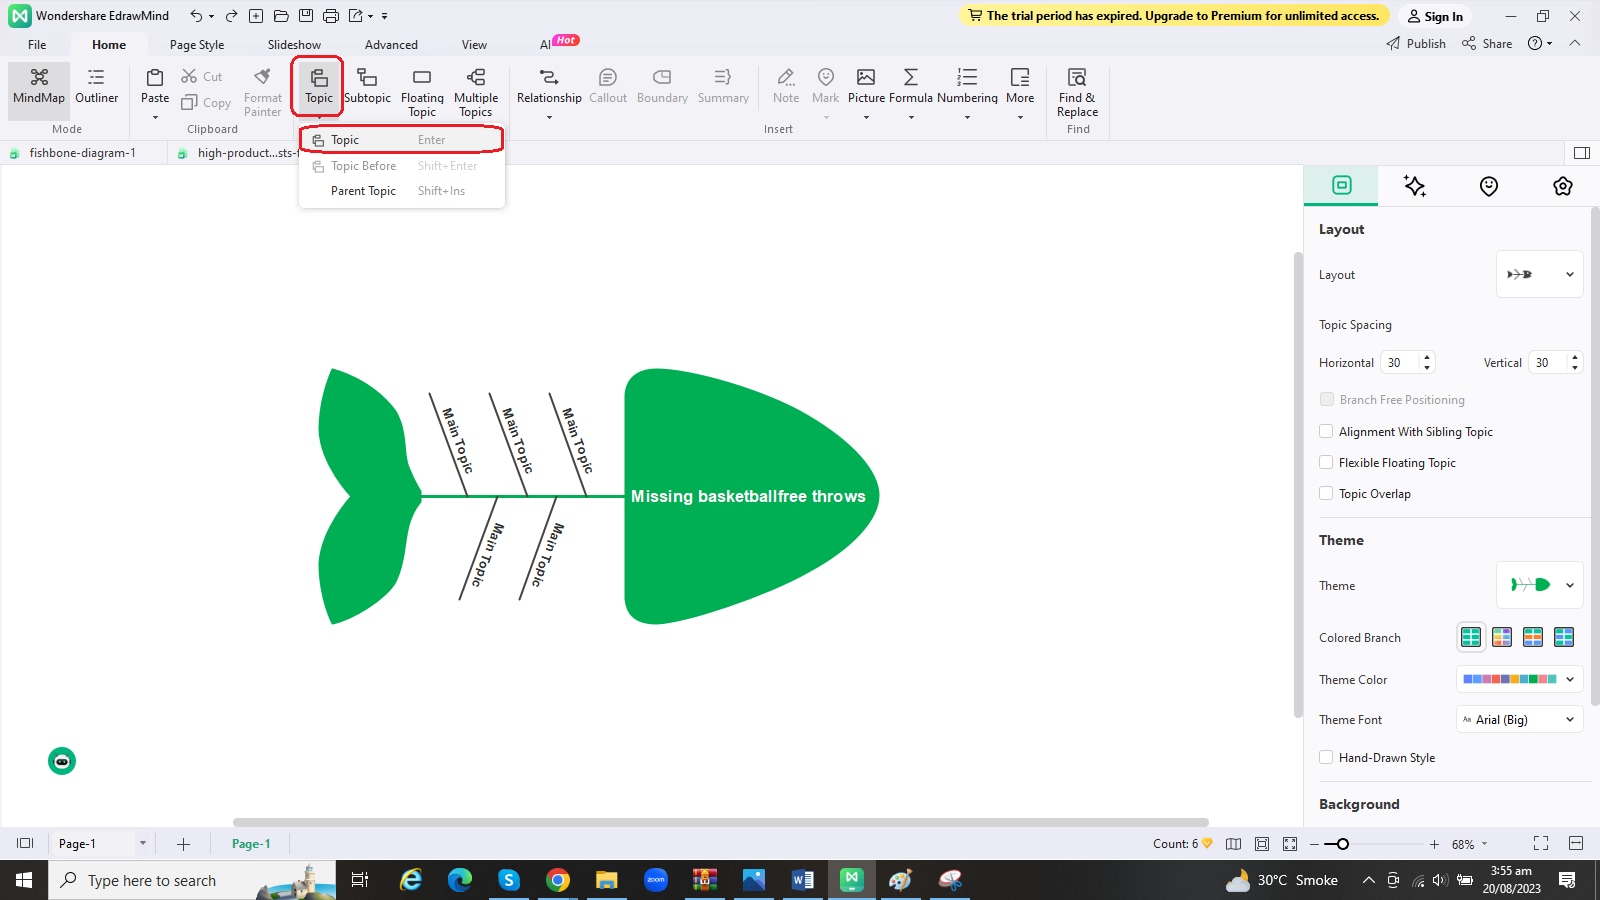
Step 3:Now, place your problem in the fish's head. Then, tap on “Topic” from the toolbar, and choose “Topic” from the list. It will help add causes.
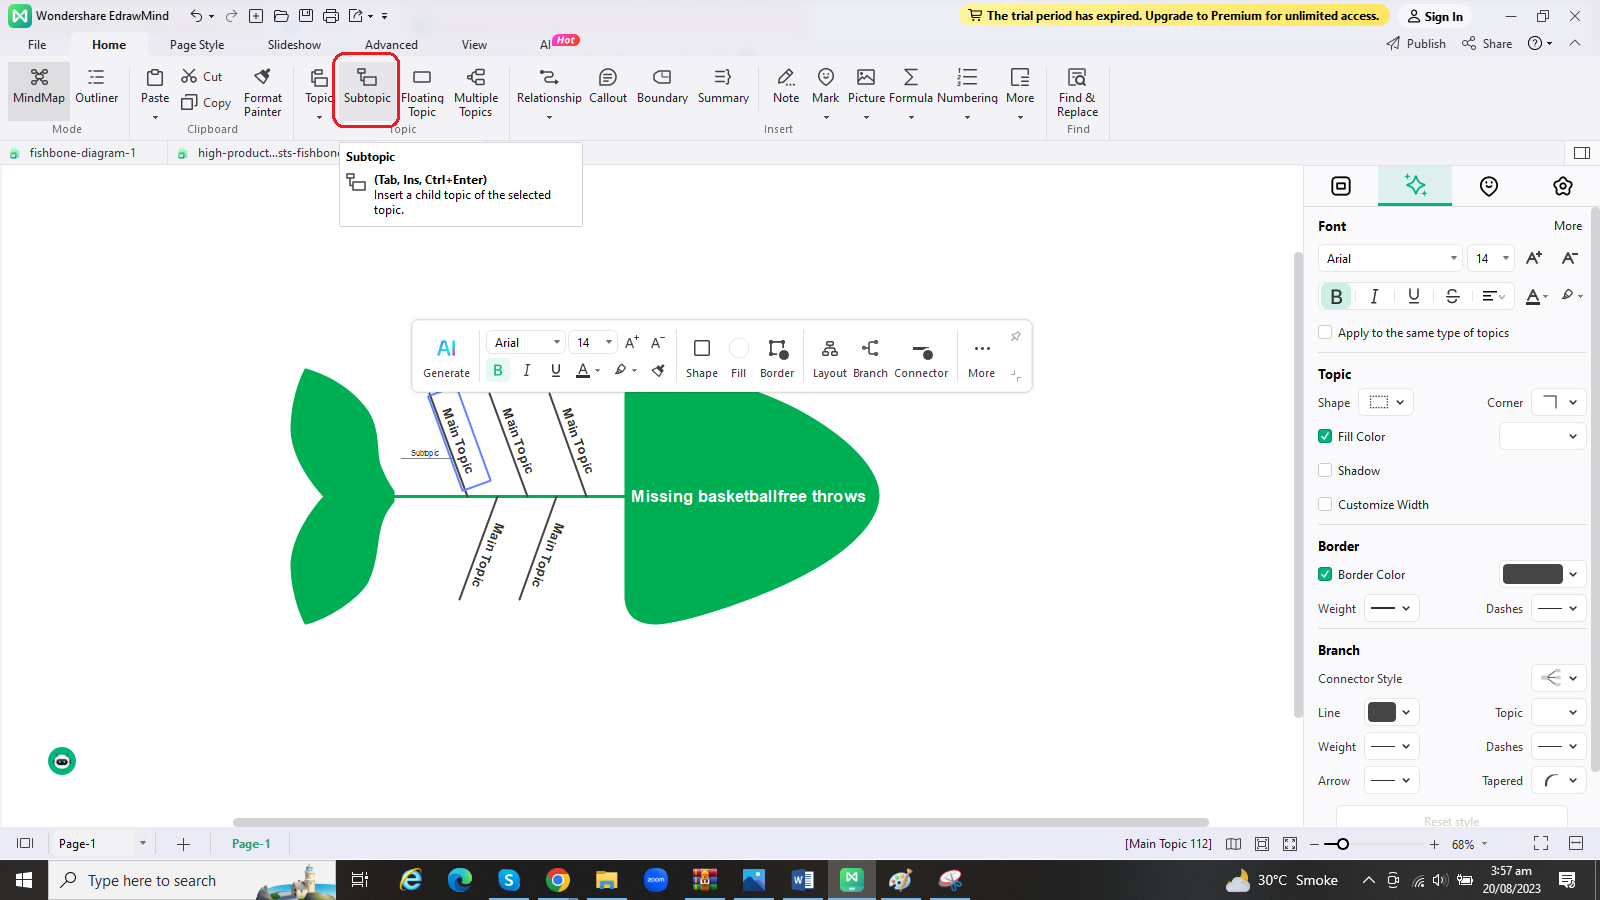
Step 4:It is time to add sub-causes to different causes. For this, just select the cause, and tap on “Subtopic” from the toolbar, as shown below.
Step 5:You can add as many causes and sub-causes as you want. Once you enter them all in the boxes, you are done with creating your fishbone diagram. You can change font colors, sizes, and styles for further customization.
Fishbone Diagram Example: EdrawMind for Creativity and Innovation
This fishbone diagram example is created in Wondershare EdrawMind. It presents the problem as “high product costs.” This problem has four leading causes, including methods, materials, machines, and human resources. Every cause is further divided into sub-causes to get into the details of the problem.
If we talk about the sub-causes of human resources in this example, they include insufficient training, limited skills of the team, less quality awareness, and no strong sense of responsibility. You can see the diagram below for other sub-causes. All root causes of the problem are highlighted, making it easy to develop an effective solution.
Tips for Making Fishbone Diagrams More Effective
- Always use an efficient and trusted fish bone diagram maker.
- Don’t forget to add enough space between different causes and sub-causes so that you can add new information without affecting the readability.
- Encourage every member to participate actively to record their ideas.
- Keep asking for “whys” until you get to the root of the problem.
- You can introduce different colors and fonts to increase readability.
Final Words
A fishbone diagram is known for identifying the root causes of a specific issue. In addition, it ensures that the same problem won't occur again. The above discussion has presented a pre-built template to understand this diagram better. Moreover, you will see a couple of fishbone diagram makers, out of which EdrawMind stands out.




 below.
  below.