


An organizational chart visually represents a company's structure and highlights roles and relationships within it. Excitingly, you can use JavaScript to create this chart. Several organizational chart JS libraries offer advanced functionalities, allowing you to customize your org chart to suit your company's needs.
This article will introduce you to the top 5 organizational chart JS libraries and generators. Plus, at the end is an alternative tool that enables even non-developers to create org charts.
In this article
- BALKAN OrgChartJS for Customizable JavaScript Organizational Chart
- DHTMLX Diagram Library To Generate Flexible Organization Chart JS
- yFiles for JS Robust Org Chart Creation
- Syncfusion Diagram Library for Feature-Rich JavaScript Org Chart
- Wondershare Edrawmind: Professional Organizational Chart Maker
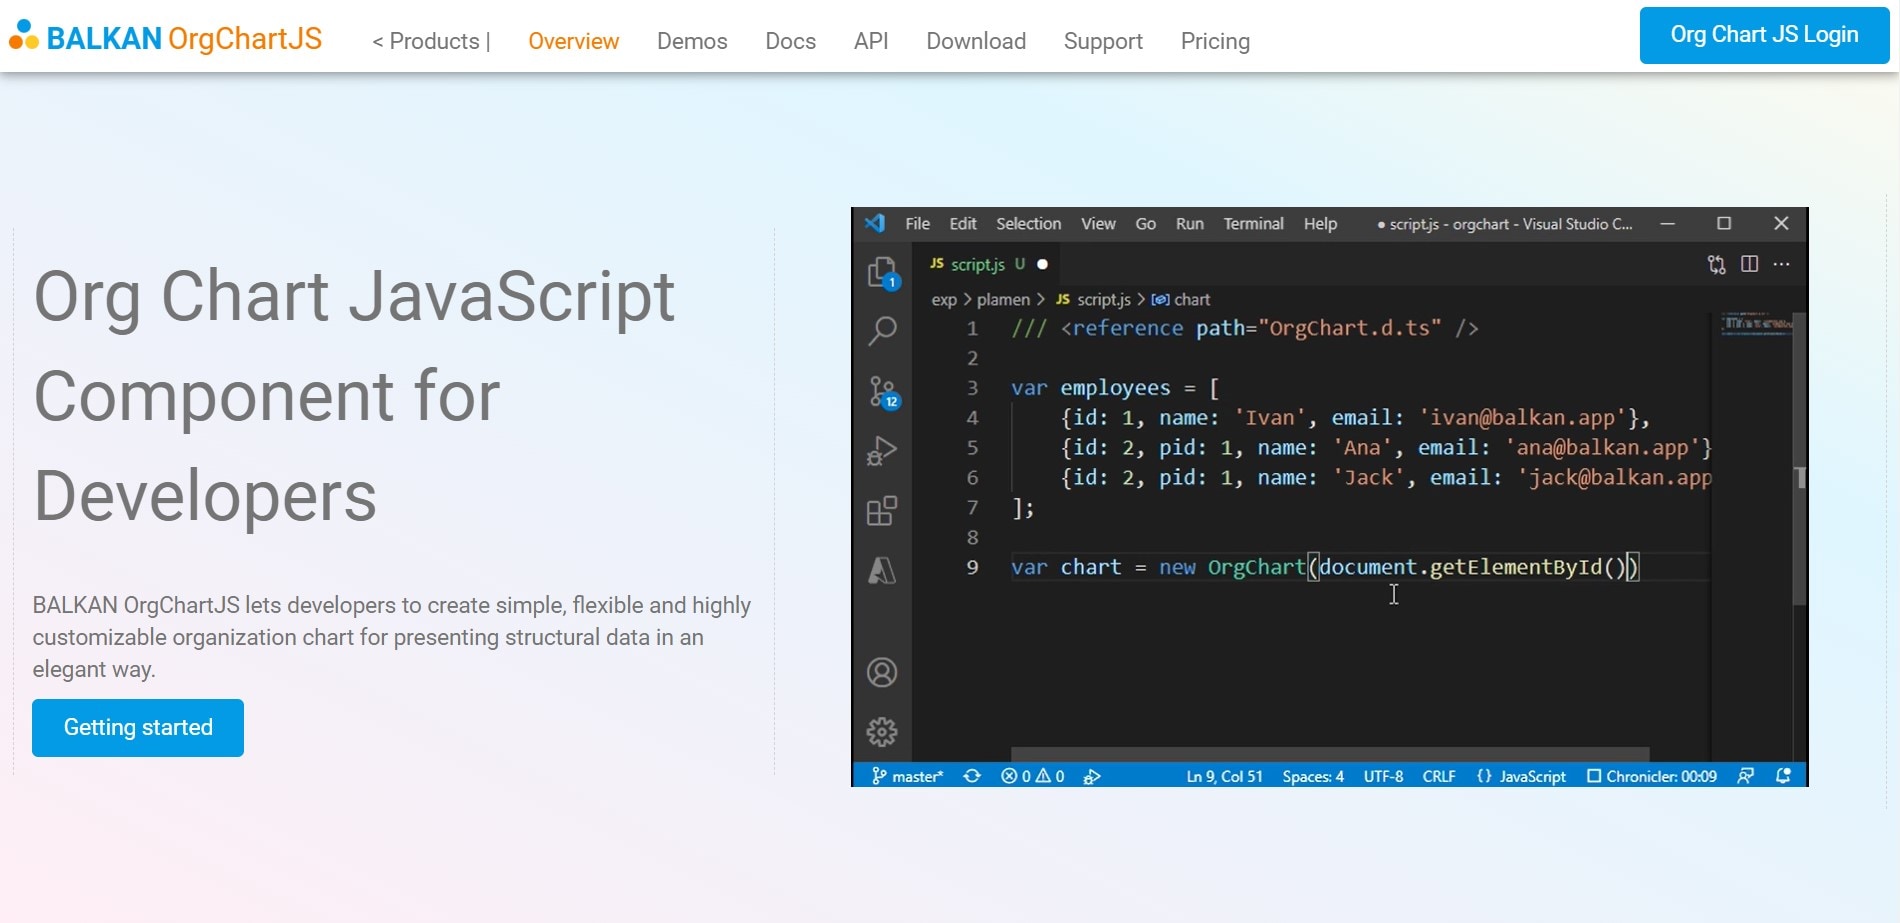
BALKAN OrgChartJS for Customizable JavaScript Organizational Chart
BALKAN OrgChartJS is a versatile tool for creating stunning org charts and data visualizations. It offers simplicity, flexibility, and wide applicability. Showcase your data with style using this powerful library.
With BALKAN, you get a wide range of features out of the box. Let's take a quick look at some of its standout functionalities:
Pros of BALKAN OrgChartJS
- Mixed Orientations: Choose from eight orientation types, allowing you to display charts in the most suitable layout.
- Drag and Drop: Effortlessly rearrange chart elements for optimal organization and visual appeal.
- Zoom and Search: Seamlessly navigate through large charts with zoom and search functionalities.
- Export Options: Export your org charts to various formats, such as PNG, PDF, SVG, JSON, XML, and CSV.
- Built-in PDF Preview: Preview and customize the exported document format with ease.
- Grouping: Efficiently save space by grouping several nodes into a single box, reducing clutter.
- Template Customization: With BALKAN OrgChartJS, changing templates is easy. You can choose from several pre-defined templates or create your custom templates. Just override properties to tailor the chart to your requirements.
- Built-in Edit Form: Customize the built-in edit form for effortless and tailored editing to suit your needs. You can control configuring buttons, input elements, colors, and more.
- Easy Integration and Usage: This powerful tool is compatible with any server that supports HTML. Whether you are working online or locally, you can easily leverage the functionality of BALKAN Org Chart JS. It offers a seamless experience, regardless of your preferred working environment.
Pricing Options
Want to give BALKAN OrgChartJS a try? You can start with a free 30-day trial to explore its capabilities. You can start with the Professional plan, available at $399 for a single website. Enjoy one year of maintenance and technical support for a hassle-free experience with every license.
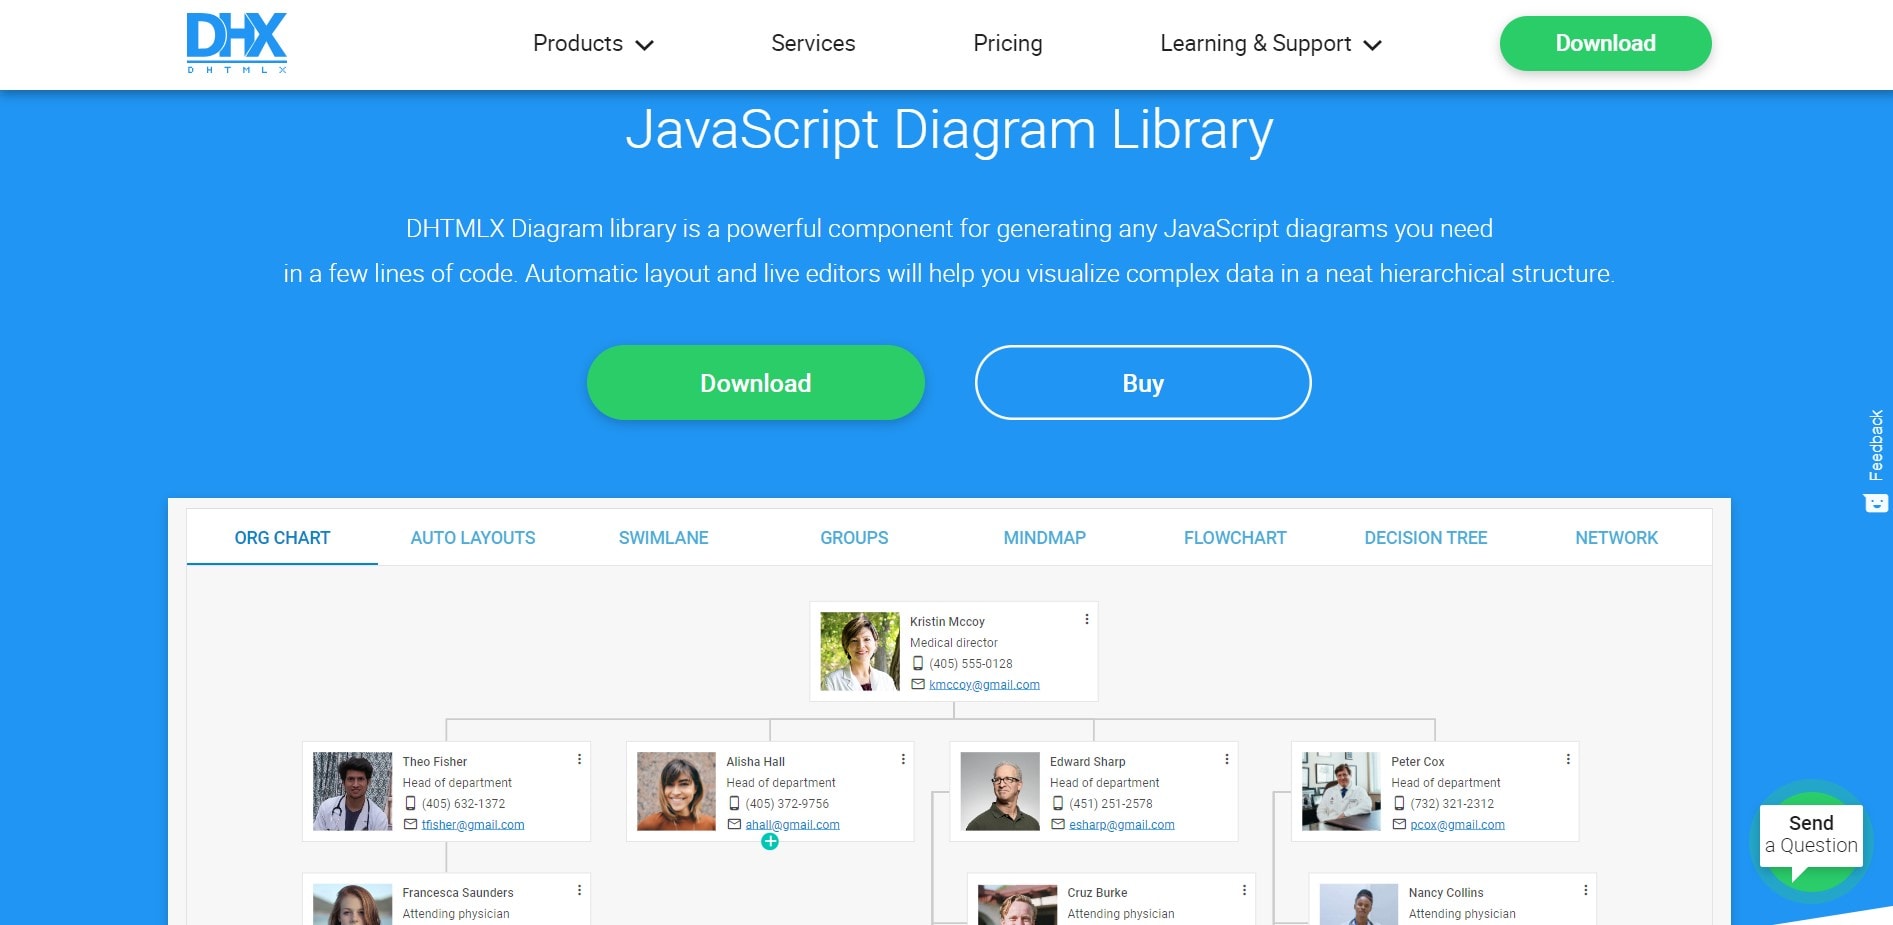
DHTMLX Diagram Library To Generate Flexible Organization Chart JS
Let's explore the DHTMLX Diagram Library - a game-changing tool for JavaScript developers. JavaScript developers can easily create stunning diagrams, including organizational charts.
Explore the capabilities of the DHTMLX Diagram Library for creating your JavaScript org chart.
- High Performance and Lightweight: DHTMLX Diagram Library ensures smooth performance. It is lightweight and provides fast rendering and optimal performance. Trust its compatibility with popular web browsers like Google Chrome, Safari, and Firefox.
- Easy Integration and Data Format: Integrate the DHTMLX Diagram Library seamlessly into your web application. It supports JSON data format and effortlessly integrates with different server-side technologies.
- Flexible Visualization: The diagram library provides ready-to-use and customizable elements to visualize data. JavaScript developers can easily combine textual nodes and nodes with images. This flexibility allows for a dynamic representation of information. You can also enhance the organization chart JS by adding images to team member cards.
- Live Editors for Easy Customization: Customize element appearance without the need for extensive coding skills. Elevate your customization experience with purpose-built editors for org chart JS and more.
- Auto-Layout Algorithm: Save time with DHTMLX Diagram Library's auto-layout feature. Drag and drop shapes onto the canvas; with one click, the algorithm arranges them in a hierarchy. Stay organized, even with many nodes.
Licensing Options
Experience the DHTMLX Diagram Library with a free trial and standard support. Get the Individual license for $599/year or the Commercial license for $1299/year, depending on your support requirements.
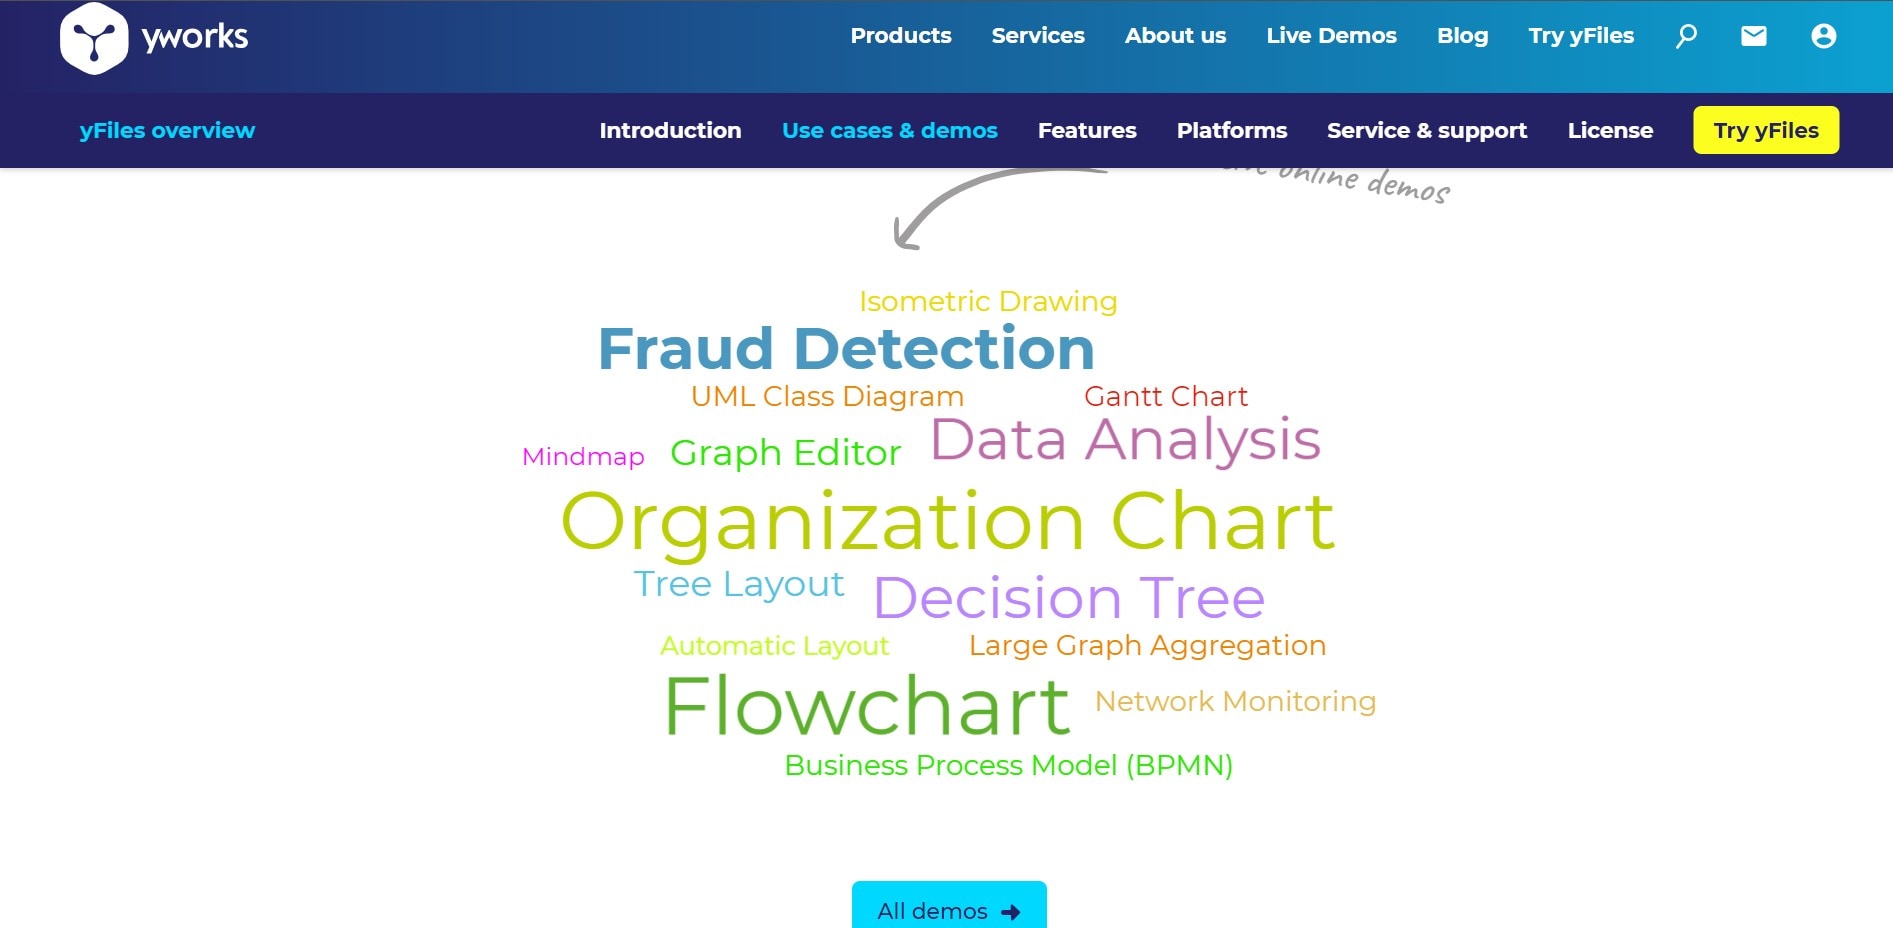
yFiles for Robust Org Chart JS Creation
yFiles is a powerful programming library for graph visualization, editing, and analysis. It saves developers time and effort by providing ready-to-use components. With yFiles, creating org chart JS is easy and doesn't require starting from scratch.
- Multi-Platform Support: yFiles supports several platforms, ensuring flexibility and compatibility with different development environments. You can use yFiles with HTML/JavaScript, Java (Swing), JavaFX, .NET (WinForms), and WPF.
- Extensive Automatic Layout Algorithms: yFiles has several layout options for your org chart JS. You can choose from hierarchic, tree-like, or even special ones. Plus, yFiles can help you with the interactive layout too. It can place labels automatically and even with edge routing. With yFiles, you have all the tools you need to create an org chart JS that show your data in the best way.
- Data Binding: yFiles allows you to link pictures with information about individuals in an org chart JS. This includes names, job titles, and other relevant details obtained from your data. This feature enhances flexibility and ensures the visualizations stay relevant to your needs.
Licensing Options
yFiles provides various licensing options to meet different needs.
Explore yFiles for free, but a license is required for project usage. Starting at $13,000 for yFiles for Java (Swing), including maintenance and no royalty fees.
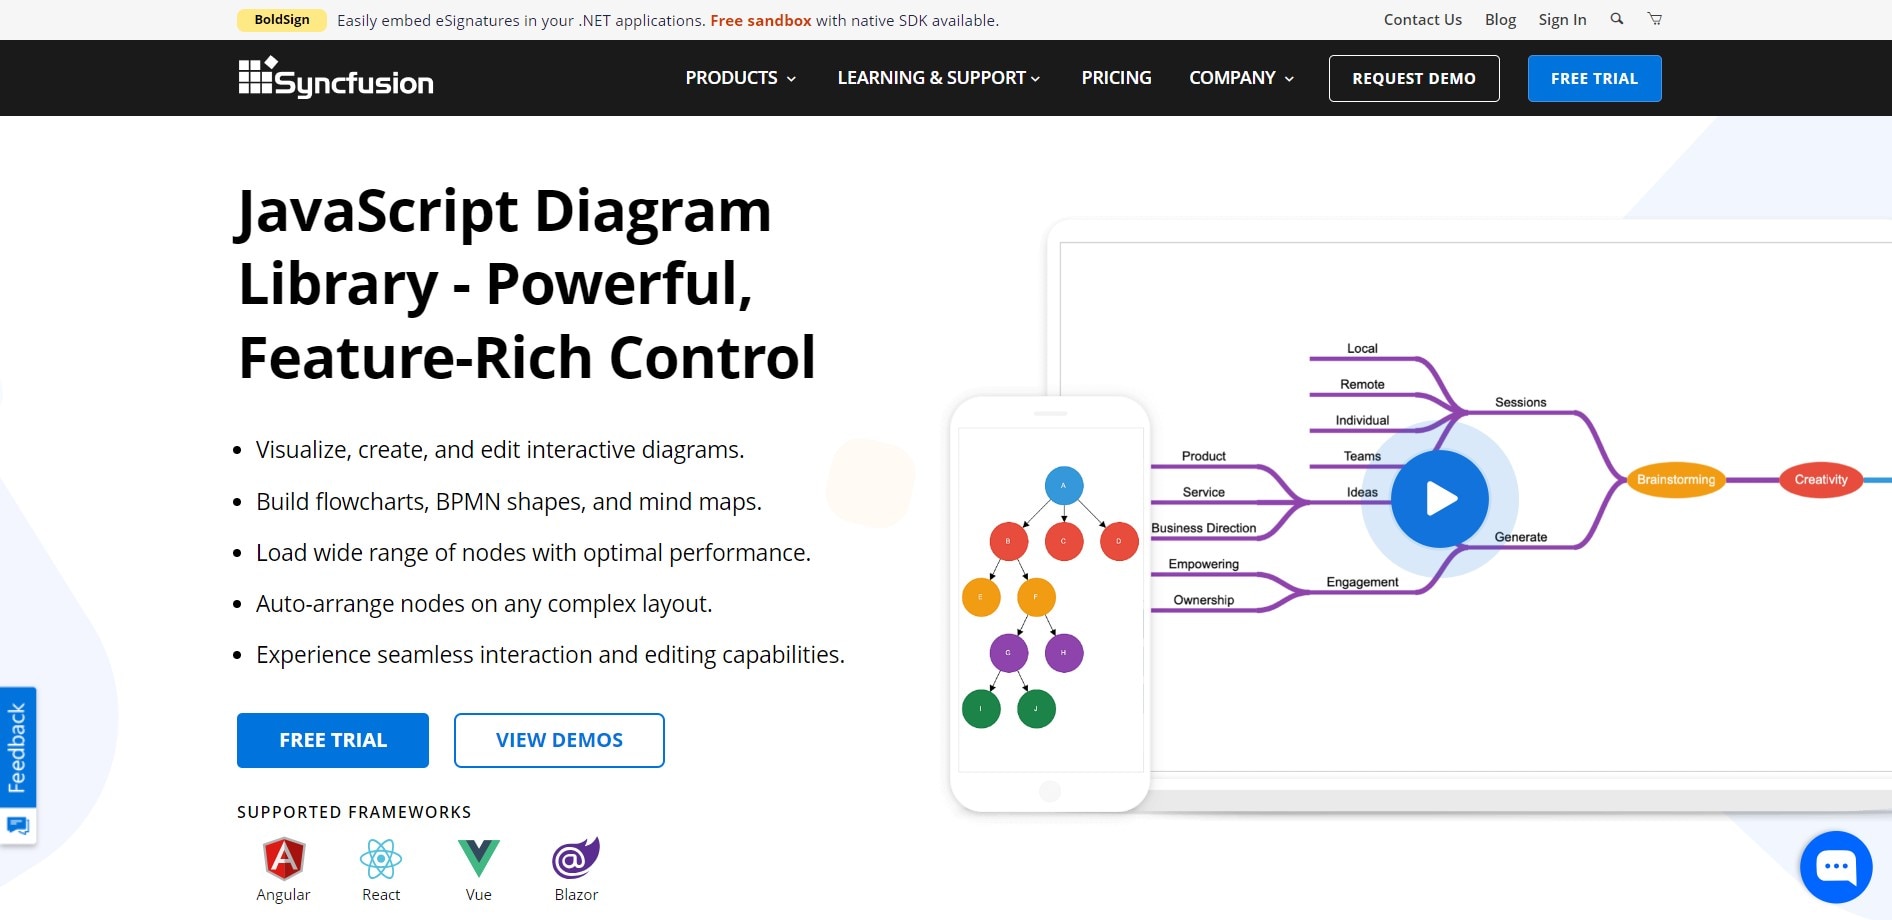
Syncfusion Diagram Library for Feature-Rich JavaScript Org Chart
Syncfusion JavaScript Diagram Library enables interactive diagram creation and visualization. A JavaScript organizational chart is one of the diagrams you can make with it.
- Automatic Layout: You don't have to arrange the nodes in your JavaScript organizational chart manually. The library takes care of it for you using a pre-defined layout algorithm.
- Templates: Designing stunning organizational chart templates is intuitive with Syncfusion. Choose from various pre-designed org chart JS templates or create your own from scratch.
- Assistants: Sometimes, employees have relationships within your org chart JS that need to be emphasized. With Syncfusion, you can define assistants in the organizational chart. These assistants are child items with a unique relationship to the parent node. They are displayed separately, making it easy to identify their role.
- Orientation Options: Flexibility is key when it comes to organizing your organizational chart. You can arrange your org chart JS from top to bottom, left to right, right to left, or bottom to top.
- Leaf-level Alignment: Fine-tune the alignment of leaf-level nodes in your organizational chart. Align them to the left, right, or center horizontally, or position them vertically at the top, bottom, or middle. This level of control ensures your chart looks the way you want.
Pricing Plans
Start your 30-day free trial or explore the affordable licensing options. The transferable annual license with unlimited deployment is available for small teams at just $395 monthly.
Wondershare Edrawmind: Professional Organizational Chart Maker
EdrawMind is beginner-friendly and accessible to all no need for coding skills. It is an alternative tool for JavaScript organizational charts. Perfect for students, businesses, and professionals.


- Customization Options: With EdrawMind, customize layouts, themes, and fonts for org charts. Add pictures of team members or icons. Arrange and edit charts with drag-and-drop. Download in PNG, PDF, PPT, and HTML for sharing.
- Cross-Platform Compatibility: EdrawMind not only offers online functionality but also provides desktop and mobile applications. You can create and edit organizational charts anytime, anywhere.
- Ready-made templates or Blank Canvas: If you prefer to start from scratch, you can begin with a blank canvas and build your chart step-by-step. The choice is yours, depending on your preference and requirements.
Steps To Create an Organizational Chart JS
With minimal effort, follow these steps to create an organizational chart using the free maker EdrawMind.
Step 1:
Visit the official website of Wondershare EdrawMind and download the app ↓. Install it on your computer and launch the app.
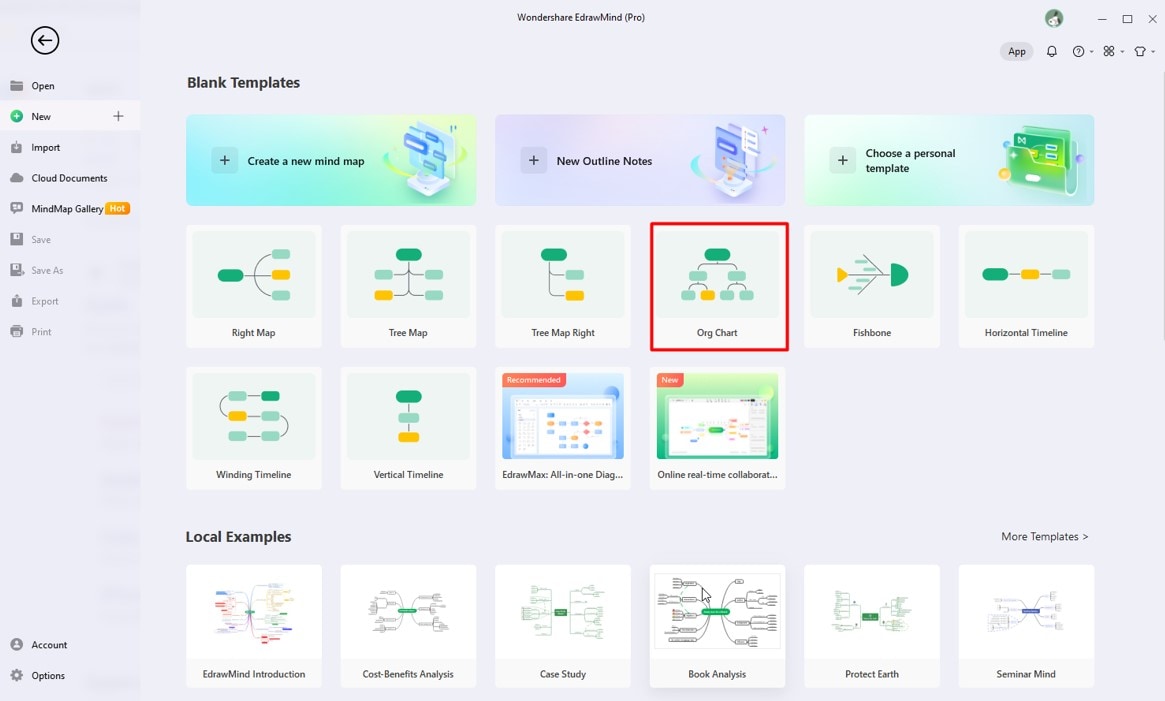
Step 2:
Select the Org Chart template from the available options in the Blank Templates section.
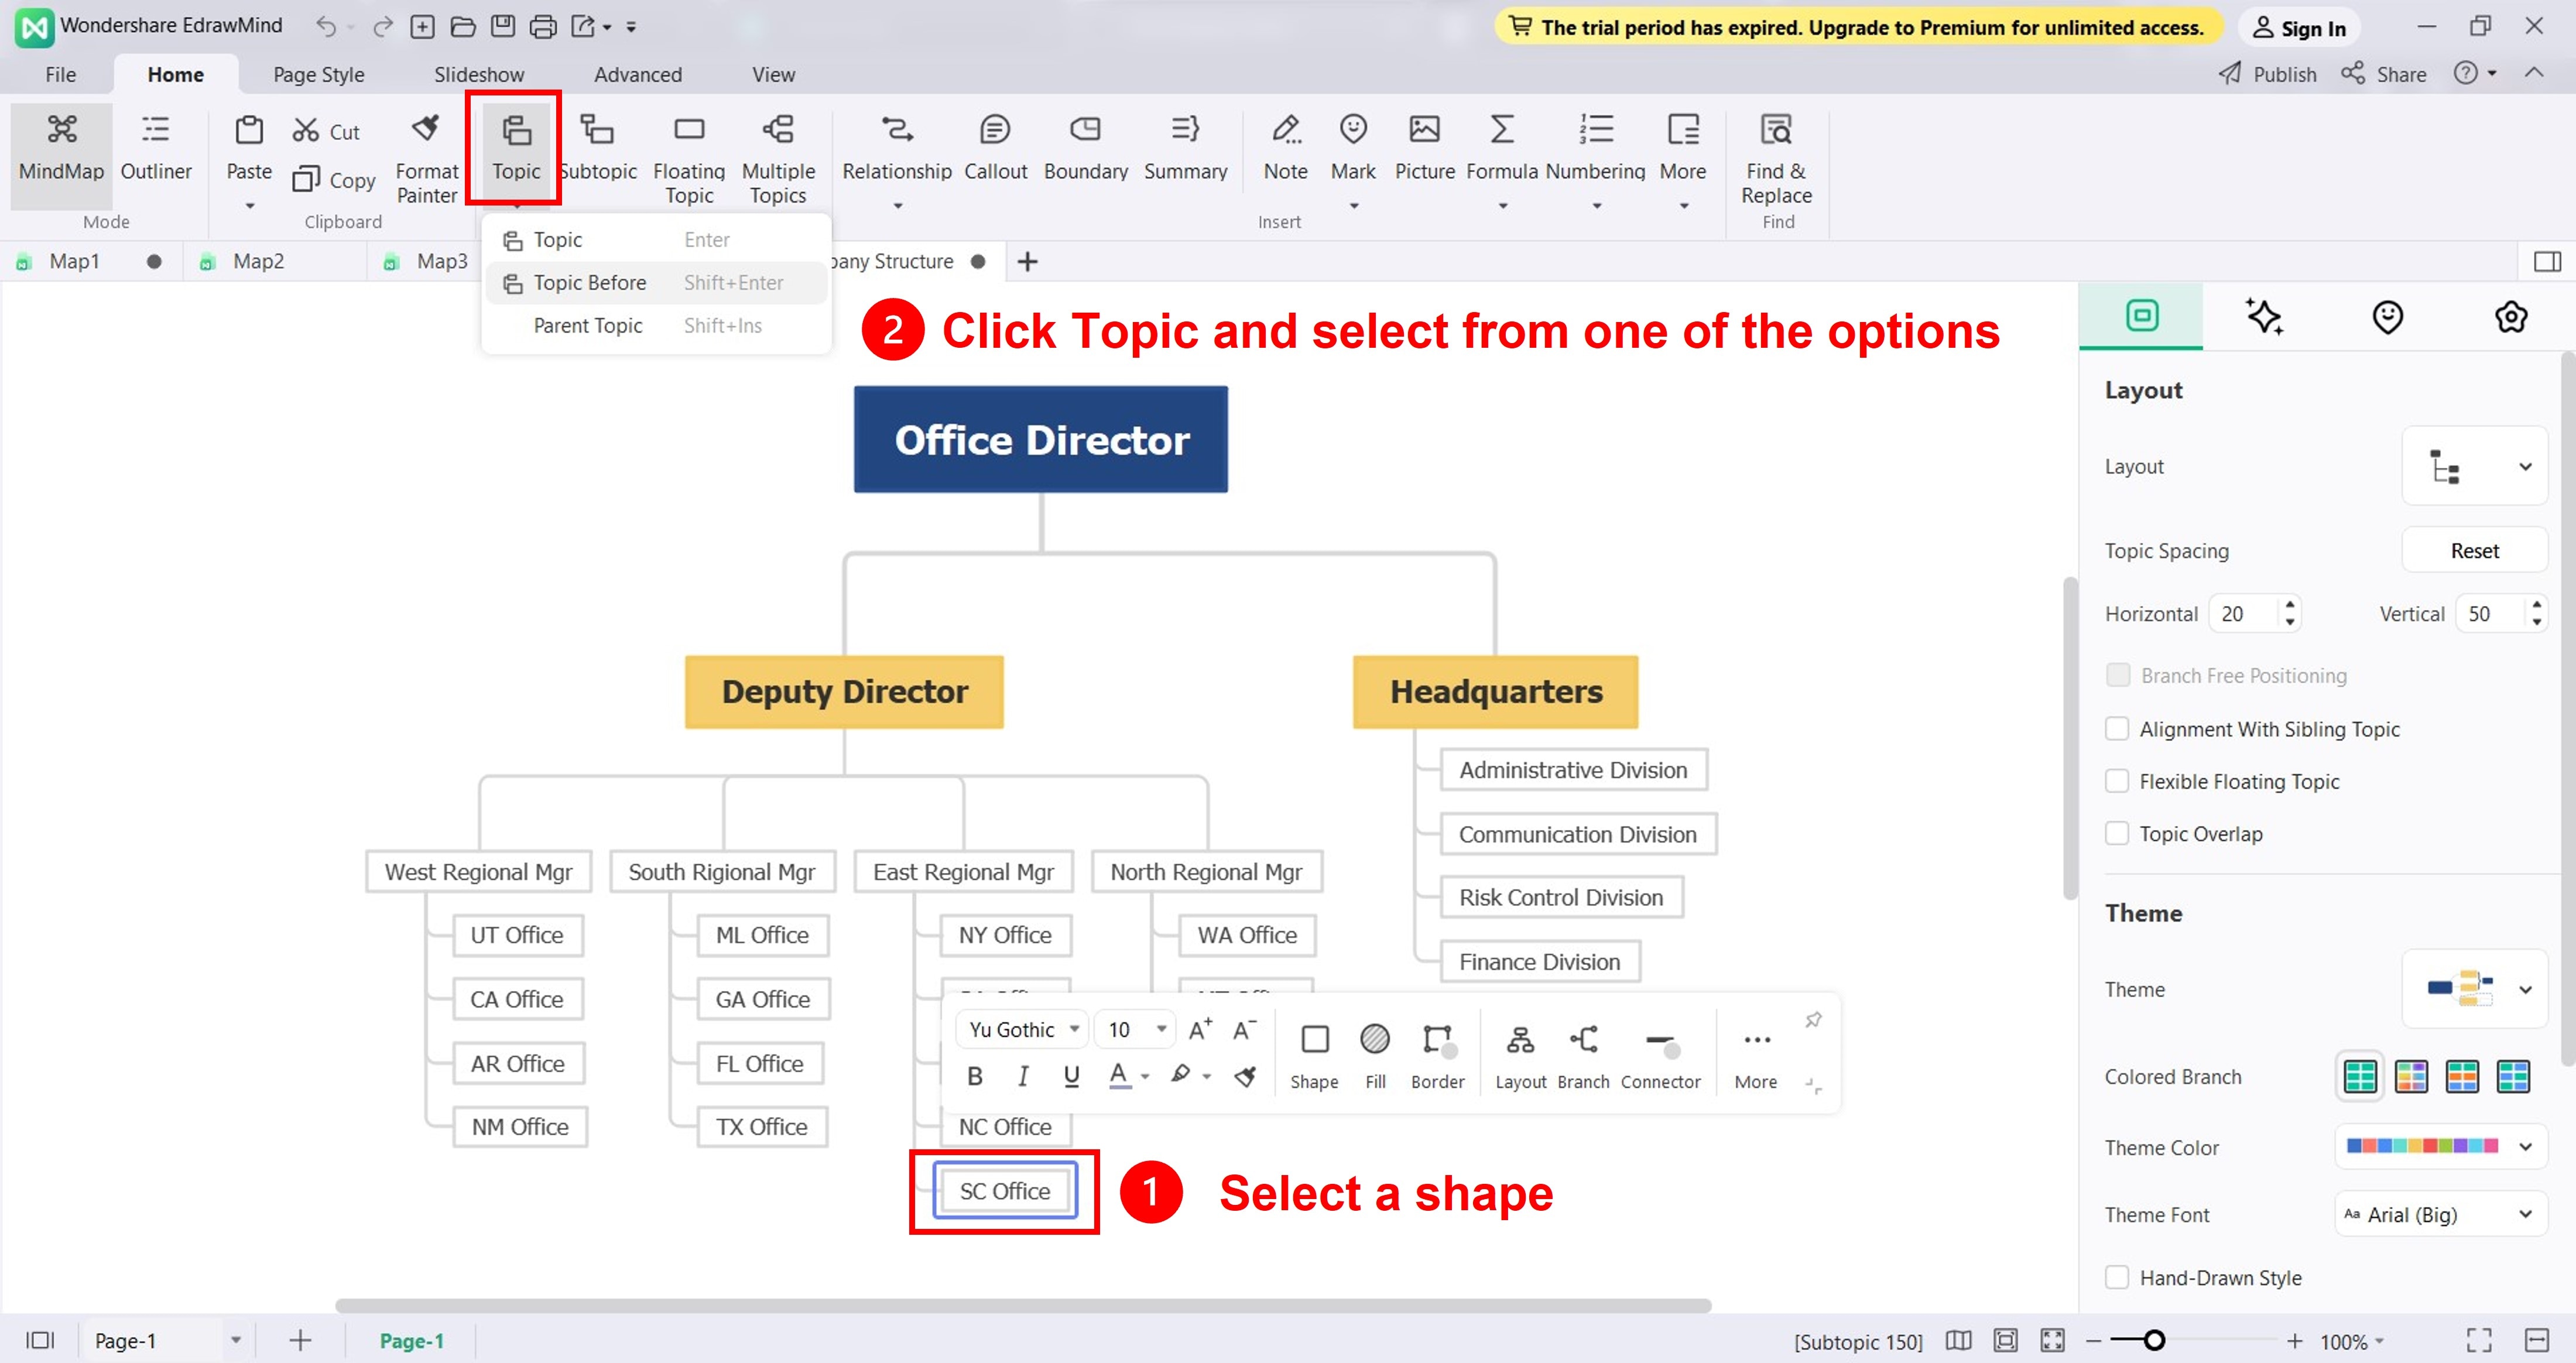
Step 3: Add Shapes and Text
Add a shape to represent the different roles and positions in your organization. Choose a shape on the editing canvas, then click the Topic drop-down menu from the Home tab bar. Next, choose one of the following options:
- Place a shape to the right of the selected one at the same level.
- Topic Before. Insert a shape to the right of the selected one at the same level.
- Parent Topic. Place a shape above the selected one, positioning it at a lower level.
Step 4:
Personalize your organizational chart by adding images, logos, or other visual elements. Choose a shape on the canvas, navigate to the Home tab, and click on Picture to upload an image.
Step 5:
You can edit the organization chart further using the right navigation pane. Adjust spacing, alignment, themes, colors, and more to your liking.
Step 6:
Once satisfied with your organizational chart, download it to your preferred file format and share it with others. To do so, click the Export icon from the quick access toolbar from the top navigation pane.

Conclusion
Using generators or plugins such as org chart JS provides several benefits. With advanced features like automatic layout, these tools simplify the entire process. They may all seem the same but select the generator/plugin that best suits your needs. For effortless org chart creation, Wondershare EdrawMind is a compelling choice. Easily create organization charts with EdrawMind's intuitive interface and extensive customization options.
