


Problem-solving goes through multiple stages, finding the right causes being the most important, etc. However, most people easily confuse the causes and symptoms of a problem. And this defeats the entire purpose of finding the right solution.
But what is the right way of distinguishing the correct causes and preventing bottlenecks? Well, a fishbone diagram is an excellent approach to recognizing the root causes of an occurrence. It has been used in businesses, research, educational institutes, and similar professions.
Named after its creator, the Ishikawa fishbone diagram is a problem-solving, root-cause analysis tool. These diagrams offer a visual illustration of the problem's potential causes by identifying and breaking down their sources.
Can a fishbone diagram make my professional life convenient? Yes, it is an excellent brainstorming substitute for teams. It helps simplify the information in a project's design and developmental stages, recognizing the correct issues and preventing bottlenecks.
That said, creating such a diagram requires extra focus. So, it is crucial to understand their purpose and composition. Here is a guide on how to make fishbone diagrams. It also gives an online alternative that may improve your productivity and team collaboration. So, dive right in!
In this article
What is Fishbone Diagram

The fishbone diagram was introduced by Kaoru Ishikawa, a Japanese quality management processor, in 1920. He mimicked a fish skeleton to plot the problem's potential causes in the design phase so they can be prevented during implementation.
Creating an effective fishbone diagram requires a combination of brainstorming and mind mapping. This helps the team to follow a proper structure and don't get distracted. But is it the same as creating a mind map?
No, a basic fishbone diagram follows the right-to-left trajectory, starting from the fish head (problem) to the bones of the skeleton (potential causes), further extending to the ribs (contributing factors). For instance, late parcel delivery (problem) is caused by the workforce (issue) and lack of training.
1. Uses of Fishbone Diagram
Here are some possible uses of fishbone diagrams.
- Identifying the root causes of problems
- Brainstorming the diverse causes, apart from the obvious ones
- Locating and preventing bottlenecks
- Improving the system's efficiency
- Visualizing the design
2. When to Implement Fishbone Diagram
The following are the two best scenarios for using a fishbone diagram.
Design/ Development Stage
When your team is experiencing a dead end, and there is no progress, designing a fishbone diagram may help. It allows you to look deeper into a problem and recognize the issue's contributing factors.
Troubleshooting the Problem
A fishbone diagram is also a great assistance when you are identifying the possible sources of a problem. It helps you identify obvious and deep-rooted causes so they can be avoided later on.
How to Make a Fishbone Diagram
Making a fishbone diagram is more than just getting teams and writing down the causes. It includes organizing brainstorming sessions, laying out processing maps, and analyzing potential causes. Moreover, it demands team collaboration, tolerance, and concentration.

Here is a step-by-step guide on how to make fishbone diagrams and identify problem causes.
Step 1: Define the Problem Statement
First, make a problem statement. Clearly state how and when the problem occurred and how it is affecting the system. Once you have written it down, discuss it with your team and make sure everyone is on one page.
Here is how you can write an effective problem statement.
- Ask questions like, What is the problem? How does it occur? How it is affecting your project efficiency?
- Use a whiteboard and ask each team member to write down the activity goals. It can help you narrow down the desired output.
- The problem should be concise and to the point. For instance, “Late Delivery of Newspapers on Sunday.”
Step 2: Categorize the Causes
Once you have a problem, the next step is identifying the problem area categories. These categories can be external variables, people, material, technology, geography, placement, and more, depending on your specific preferences.
- An excellent way to do this is through brainstorming or brainwriting. Write down as many categories as you can, and narrow them by voting.
- Once you have around six to ten problem categories, draw small vertical lines on a straight horizontal fish spine and label them accordingly.
Step 3: Identify the Contributing Factors
The next step is serious brainstorming and idea-sharing. Here, you need to think about the contributing factors for each problem category to better analyze the problem. You may find a single factor affecting multiple categories; feel free to add them accordingly.
Here are some tips to perform this step effectively.
- Lay out a processing map to note down the factors.
- Allocate the same time for each category, and ask the moderator to note down the contributing factors.
- Get feedback from all team members.
- Make sure all possible sub-causes/ factors are identified.
Step 4: Select a Mind Mapping Tool
Undoubtedly, making fishbone diagrams is quick and effective with the right tools. And the mind-mapping tool may be the right choice. It allows you to lay out extensive processing maps with structured categories on the basis of ideas shared through brainstorming.
It is even better if your selected tool has pre-built templates. This can help you find the right match and get idea inspiration.
Step 5: Get Feedback
Fishbone diagrams are more effective when all members actively participate in the creation process. So, end your fishbone diagram process by getting feedback from the team. If you are using a digital workspace, allow them to leave comments on the diagram. Revise it accordingly and start working on its implementation.
How to Make a Fishbone Diagram in Easier Way
Want a digital space for brainstorming and mind mapping? EdrawMind might be the right choice. It has pre-built fishbone and processing map designs to make the creation process quick and straightforward.
Wondering how to make fishbone diagrams with EdrawMind. Follow these simple steps.
Step 1Prepare
Before you dive into the creation process, plan your fishbone diagram with the team. Identify problems, trace potential causes, and their contributing factors. Make a rough fishbone outline on a whiteboard.
Once done, it is time to get started on EdrawMind.
- Download EdrawMind or open the online version
- Register your email and set the password if it is your first time.
- Log into your account.
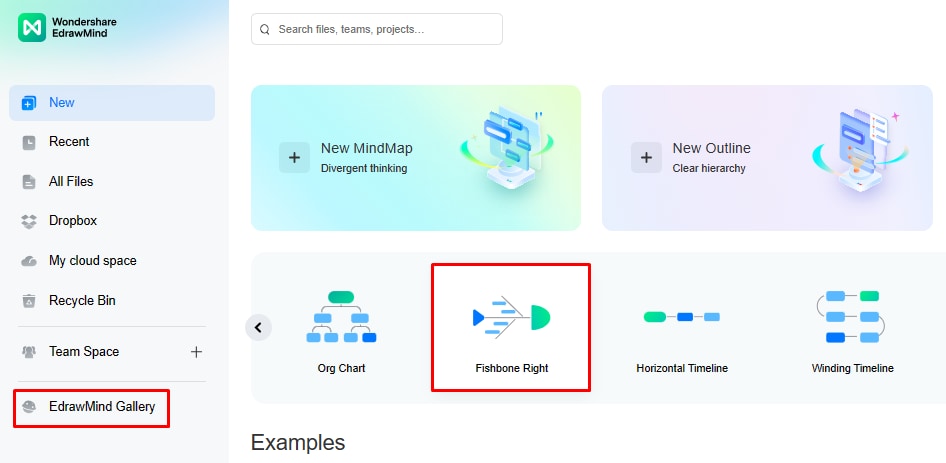
Step 2Select a Template
Once you are logged in, open the template gallery from the dashboard and select Fishbone Diagram from the diagram type. Scroll down to find the right match and click Duplicate. It will import the diagram's component into the editing panel. Or, click New > Fishbone to create a fishbone diagram from scratch.
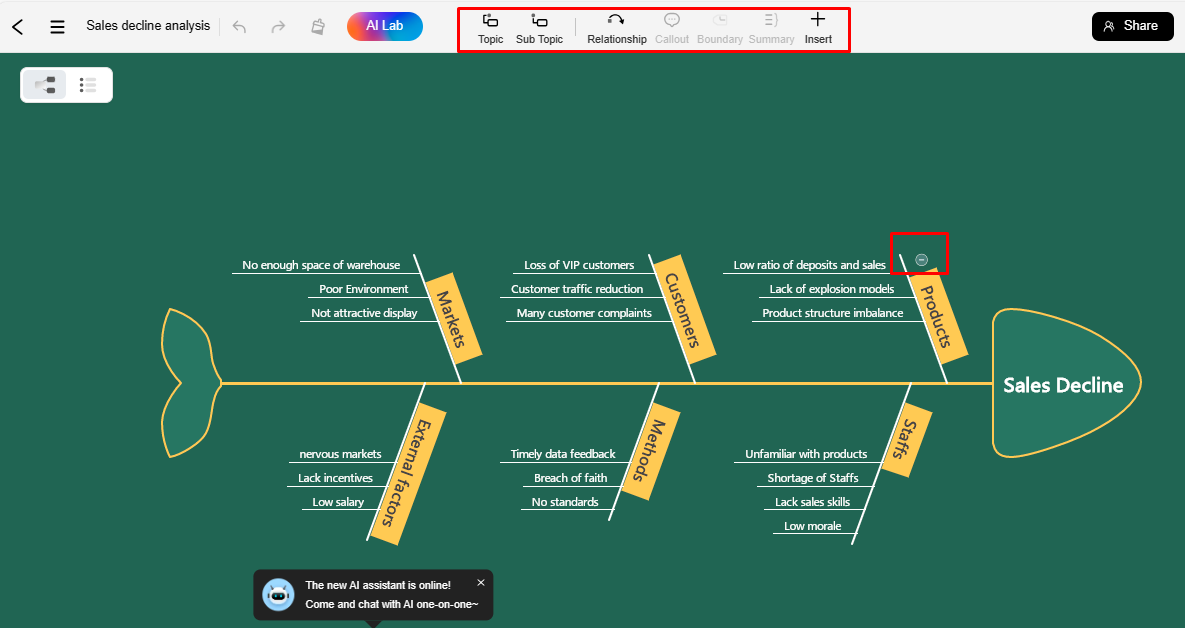
Step 3Customize the Diagram
Add or remove causes using the Insert Topic button from the top toolbar. You can further expand the sub-causes by hovering your mouse on each topic and clicking (+). Once the diagram is complete, double-check the categories and ensure the data is correctly filled across the fields.
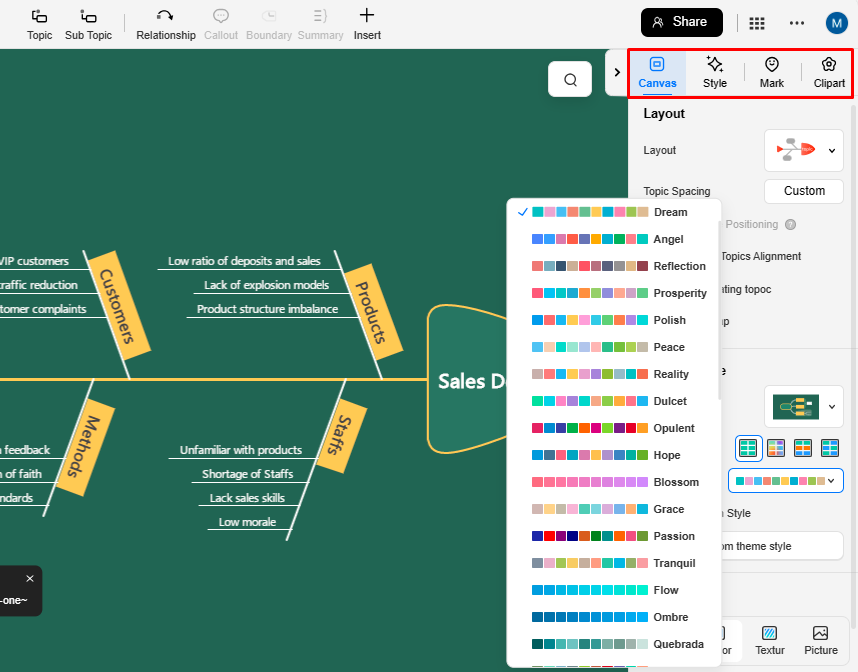
Once your fishbone diagram is complete, change its style, theme, color scheme, and font from the right-side information setting panel. Now, your fishbone diagram is ready.
Step 4Export and Share
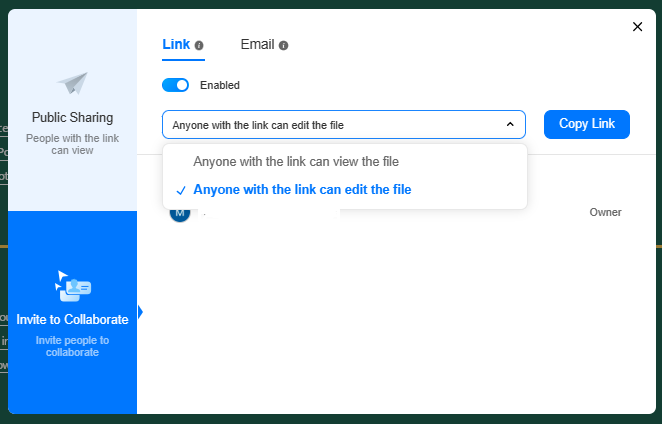
Finally, download this diagram in any preferred format, including PNG, PDF, JPG, and more. You can even share it with team members for feedback. Just set the permission and share its link from the top-right corner.
Free Fishbone Diagram Maker

An effective fishbone diagram is all about thinking, sharing, and analyzing ideas. And the best way to approach this technique is through a productive brainstorming session. However, it is quite hectic to organize such a meeting.
Therefore, a virtual space that allows you to brainstorm, mind map, and manage teams like EdrawMind might be the right choice. Following are some reasons why it is a great tool to kick-start your fishbone diagram journey.
- It allows you to create detailed mind maps with a single click.
- EdrawMind has free pre-built brainstorming and fishbone designs. You can edit these templates and use them for creative inspiration.
- Teams can upload, save, and access their diagrams on the EdrawMind Online working space. This space is compatible with all systems, including Linux, Max, iOS, and Windows.
- Members can view, edit, and comment on your work.
Conclusion
Fishbone diagrams have made problem-solving effective and easy for big teams. It allows you to recognize problem areas and prevent them during implementation. However, creating a lengthy fishbone diagram demands skill, effort, and time.
Digital mind-mapping tools have made it easy, straightforward, and productive to make fishbone diagrams. These tools simplify the way you share ideas, lay out causes, and analyze problems.
And if you are still unable to find such a tool, EdrawMind might prove helpful. It has free editable processing maps and fishbone designs. So, check it out and see if it works for your team.
