


Institutions and businesses employ the so-called “organizational structure.” These structures are where you can see assigned roles, teams, and the organization's overall hierarchy. You can see who reports to whom and where a specific job goes. Diagrams called organizational charts are used to visualize this information.
If you want to start creating your business’s organizational chart, this article is a great place to start. It will go through the different stuff you need to learn to make the most effective chart that you can share with everyone else. Read through to learn more.
In this article
- What Is an Organizational Chart
- Why Is the Organizational Chart So Important
- Types of Organizational Charts
- Components of an Organizational Chart
- How To Make an Organizational Chart
- Common Mistakes To Avoid When Making an Org Chart
- Tools for Creating Org Charts
- Free Examples of Organizational Charts
- FAQs about Organizational Charts
Part 1: What Is an Organizational Chart?
To start our discussion, you need to know what an organizational chart is.
At its core, these charts are visual tools that show the structure of a company, department, or team. They can show the roles, responsibilities, and, most importantly, the relationships between people in an organization. The chart typically uses boxes and lines to represent job titles and reporting lines.
Organizational charts are helpful for managers, HR teams, and new employees. Managers use them to plan teams and manage workflows. HR departments rely on them for onboarding and workforce planning. Employees refer to them to understand who does what, and who reports to whom.

What Is an Organizational Structure?
You might have heard about the organizational structure as well. The term can be used interchangeably with the term “organizational chart,” but there is a significant difference. An organizational structure is a company's system that arranges its people and roles. This could be a hierarchy, a flat structure, or a matrix.
The chart is just a visual representation of that structure. It helps people quickly grasp how the organization is set up, but doesn't dictate how decisions are made or how work gets done. In short, the structure is the design; the chart is the drawing.
Part 2: Why Is the Organizational Chart So Important?
Contrary to your knowledge, an organizational chart isn’t just a visual representation. It can serve other purposes, even if a business doesn’t realize them. They help improve different areas of running the business.
- Clarifies roles and responsibilities. The first function of an organizational chart is to give the people within the organization a clear-cut view of their roles and responsibilities. Employees can easily see to whom they should report or to whom they can report certain things.
- Improves communication and workflow. Since it’s easy to see the roles and responsibilities, people will easily communicate with the proper people. This is one of the unspoken benefits of an org chart.
- Aids in onboarding and training. On the other hand, some of the hard work of onboarding people within the business can be eased with the help of the charts. You can send these to the new hires and explain less than before.
- Supports strategic planning. If your company plans to expand or reassess its organizational structure, an org chart helps by giving a view of the current status quo. You can find inefficiencies easily.
In short, a good organizational chart is not just informative—it’s practical. It helps companies stay organized, aligned, and ready for change.
Part 3: Types of Organizational Charts
Organizational charts can take many forms, depending on how a company is structured. Each type reflects a different way of managing people and work.
Functional Structure
Many companies use a functional structure, as it’s probably the first image that comes to mind when you think of org charts. Employees are grouped based on their job functions, like marketing, HR, etc. It’s straightforward and efficient, but can limit people’s growth if followed strictly.
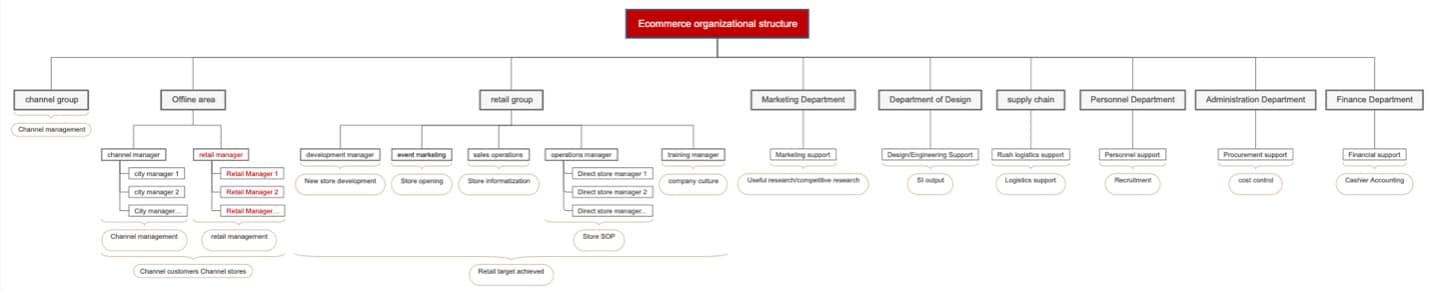
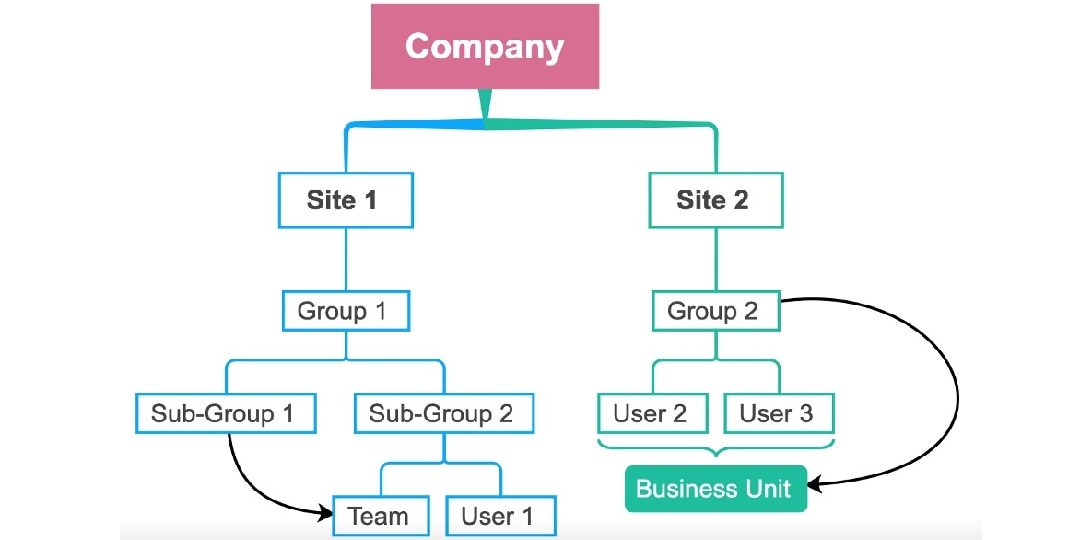
Divisional Structure
In this setup, the company is divided into product lines, regions, or markets. Each division operates like its own unit, with its teams. It’s useful for large companies that manage different brands or territories.
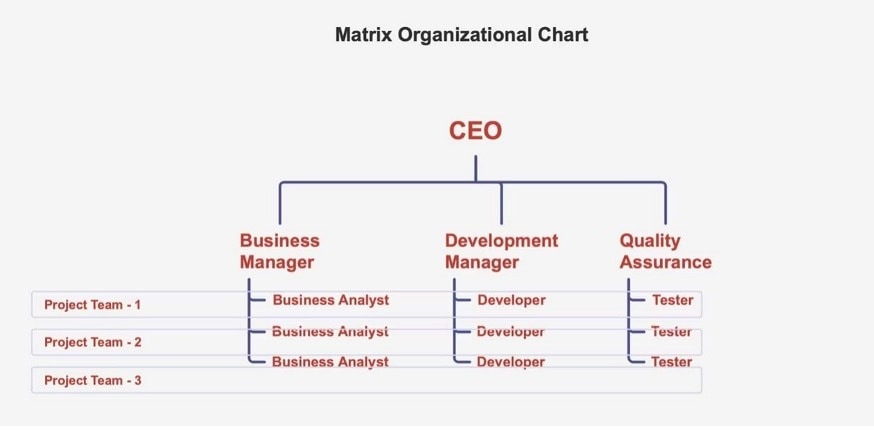
Matrix Structure
A matrix structure blends functional and divisional models. Employees report to two managers—one by function, one by project or product. It promotes collaboration but can be complex to manage.
Flat Structure
A rising form of organizational structure these days is the flat structure, with minimal hierarchies. Many startups employ this chart to show that the whole company and its employees work as a team. This is great for businesses with collaboration as part of their core values.
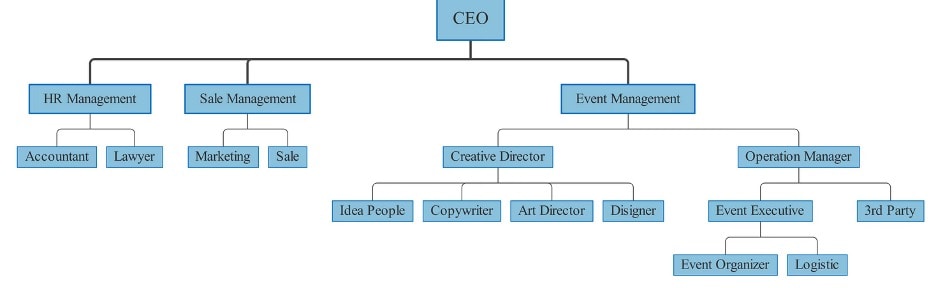
Hierarchical Structure
This is the most basic organizational structure type. All companies follow a hierarchical structure as long as there are bosses and employees.
The previous organizational chart types (except the Flat Structure) also follow this structure. This gives the top-down view of the company, starting from the Board of Directors down to the regular employee.
Part 4: Components of an Organizational Chart
Next, here are the usual components or parts of an org chart. These are essential to any organizational chart, no matter the type.
- Roles. The roles within an org chart are arguably the most essential part of the structure. Without these, the chart will be a collection of shapes, lines, and arrows.
- Relationships. Lines connect the roles, showing how people report to one another. A solid line usually means a direct report, while a dotted line shows an indirect or secondary reporting relationship, common in matrix structures.
- Departments. Except for smaller businesses, having departments is also a great way to delineate responsibilities. This makes it easy for people to know who and where to connect with in case of specific issues.
- Optional: Contact Information. You can also include contact information within the organizational chart. This makes it so that the chart can serve an extra purpose: being a directory.
Together, these components create a clear and helpful overview of how a company is organized structurally and operationally.
Part 5: How To Make an Organizational Chart
Creating your very own organizational chart can be overwhelming. However, you can follow some steps to outline clearly what needs to be done.
Step 1: Learning About Your Organization
Of course, the first step in making an organizational chart is knowing the people inside the organization. You should take your time to learn about the different positions in your company or team. Try talking with executives or officers to get a clearer view of the teams. You need to know the following information to make a company structure chart:
- The leadership of the company.
- The numbers, names, heads, and functions of departments and sub-departments (if any)
- The levels of management teams and employees.
Step 2: Follow a Format
The next step is to choose which organizational chart type (as discussed earlier) you’ll have to follow.
For example, a hierarchical chart is best for traditional setups. Then, a matrix layout works for project-based teams. Choose the format that matches how your company operates.
Step 3: Use an Organizational Chart Tool
Once the two steps above are done, it’s time to create the org chart with the right tool. There will be a discussion on these tools later on. As a tip, though, you can try out tools that offer AI org chart generators like EdrawMind. It’s a popular mind-mapping and diagramming tool with many AI tools and 30,000+ templates.
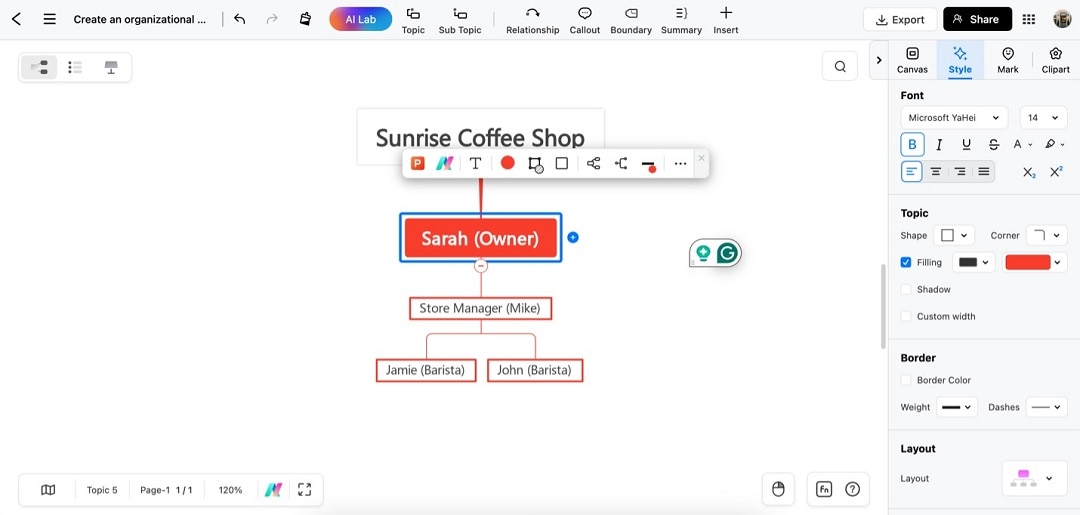
Visit the EdrawMind organizational chart maker website. Type in what you need within the text box. For example, for a coffee shop, you can use similar prompts to the following:
- “Create an organizational chart for Sunrise Coffee Shop with the owner (Sarah) at the top, then the store manager (Mike) reporting to Sarah, and the barista (Jamie) reporting to Mike."
- "Design a simple hierarchy for Bean Dream Coffee with three positions: Owner/Head Barista (Alex), Assistant Manager/Bookkeeper (Taylor), and Barista/Customer Service (Jordan).”

Then, wait a while, and the AI will generate your content. It’s neatly made. You can now begin to customize it through the Style panel. You can add new nodes (or employees) through the Topic/Sub Topic buttons.
The great thing about EdrawMind is that it stores your creations in the cloud. You can update it as soon as there are any changes to your organizational structure.
Step 4: Share and Update Regularly
Share the chart with your team. Please post it on internal platforms or include it in onboarding materials. Keep it updated as roles change or teams grow. An outdated chart quickly loses value.
With the right tools and up-to-date info, an org chart becomes a helpful reference for everyone in the organization.
Part 6: Common Mistakes To Avoid When Making an Org Chart
An organizational chart is only effective if it represents what happens in your company. Thus, it’s essential to ground yourself in the viewpoint of a normal person to make an effective org chart. Here are some common mistakes to watch out for:
- Not reflecting the actual structure. One of the biggest mistakes is building a chart based on what the structure “should” be instead of how it works. Make sure your chart matches the day-to-day reporting lines and responsibilities.
- Overcomplicating the design. An org chart should be easy to read. Avoid cramming in too much detail or using complex layouts that confuse people. Stick to the essentials: names, roles, departments, and reporting lines.
- Not updating the chart. Teams change, people get promoted, and new roles are added. If your chart isn’t updated regularly, it becomes outdated and misleading. Make it a habit to revise the chart whenever changes happen.
- Ignoring informal relationships. Org charts show formal reporting lines but don’t always capture real-world dynamics. Keep in mind that influence and collaboration often cross department lines. While these may not always appear on the chart, knowing them can help avoid blind spots.
Part 7: Tools for Creating Org Charts
Several tools make it easy to create and manage organizational charts. Here are three widely used options:
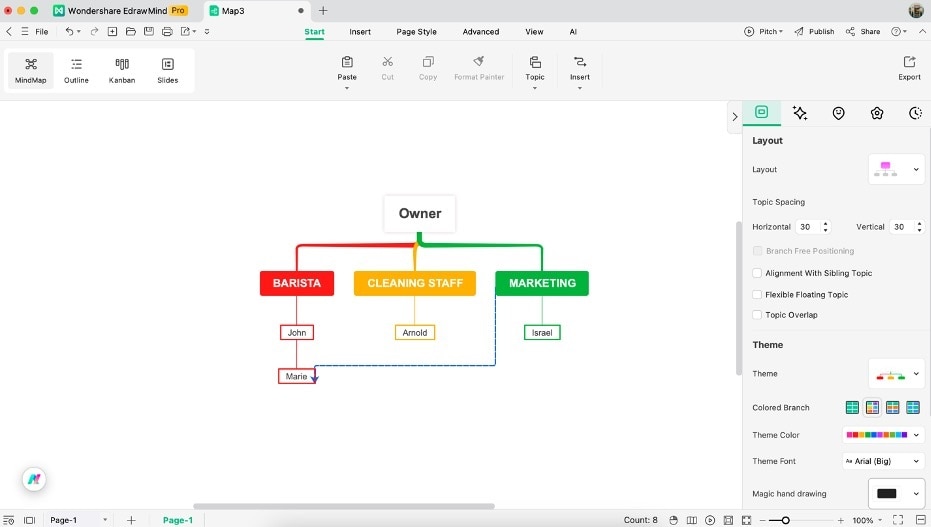
Wondershare EdrawMind
One tool that you can use is Wondershare EdrawMind. You’ve seen it at work earlier in the how-to section of this article. This popular drawing tool offers several diagram types, including organizational charts and organograms. It also provides AI-powered tools like AI drawing, AI chat, AI org chart, and AI mind map.


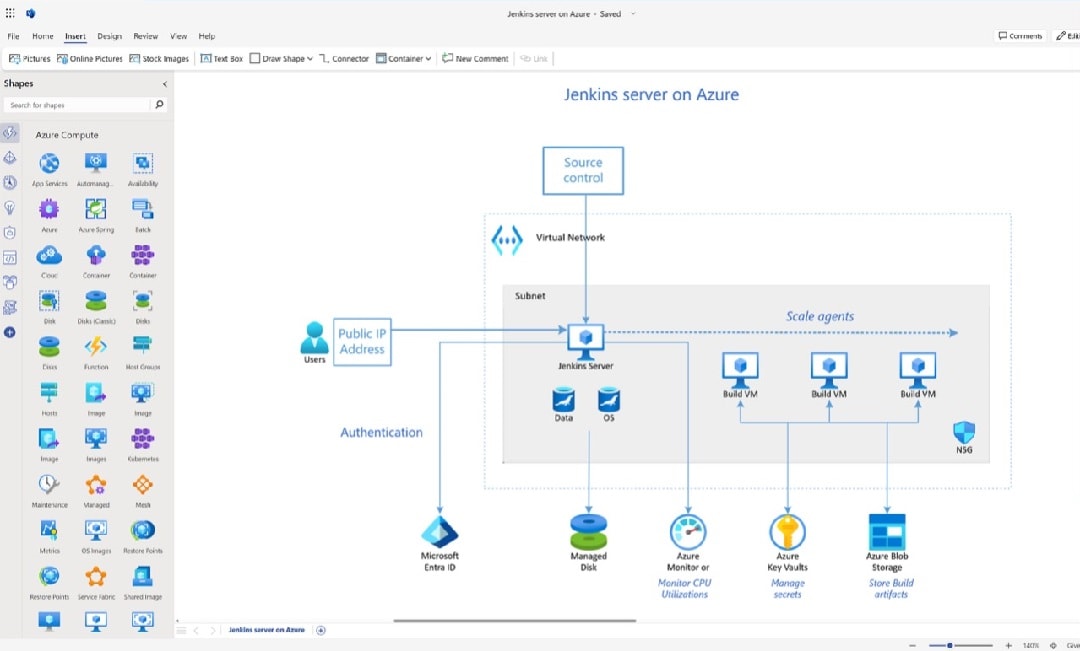
LucidChart
Another popular option for org charting is LucidChart. While primarily web-based, this tool offers powerful drawing features and cloud support. Its main selling point is that it provides real-time collaboration. You can work with your teammates to make the perfect organizational chart.
Microsoft Visio
Visio is the tool for you if you need something more basic and professional. It’s widely known for its drawing functions, which work without hassle. The only possible drawback is that you can only reliably access it with a subscription.
In the end, choosing your organizational chart tool boils down to preference. You can also try out other free options like Canva and Google Slides, equally popular diagramming tools. Make sure to try out every available tool before committing to one.
Part 8: Free Examples of Organizational Charts
As part of the final segments of this discussion on organizational charts, here are some examples from which you can draw inspiration.
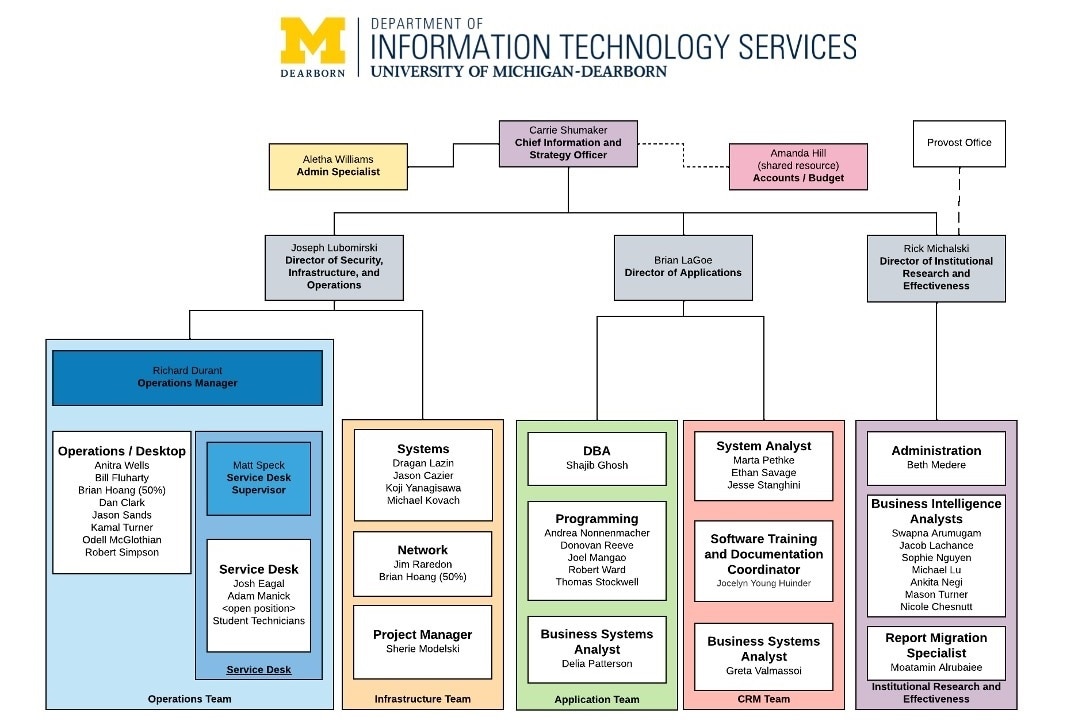
For IT Companies
This is an example from the University of Michigan-Dearborn’s Department of Information Technology Services. It’s essential to differentiate teams based on the services offered for IT-based organizational charts. This is because many people can get confused with the different jargon involved in IT, and delineating them here is a good step to avoid such confusion.
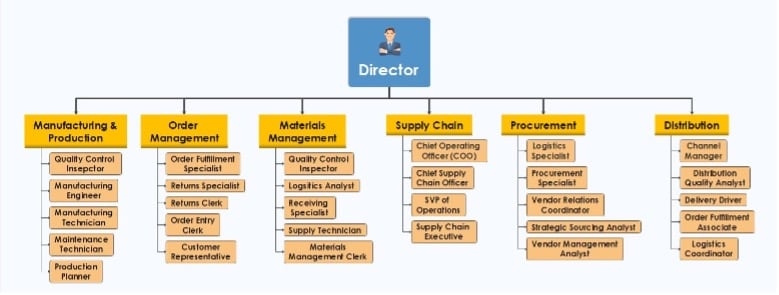
For a Manufacturing Company
It’s also essential for manufacturing companies to create different departments for each part of the product-making process. For example, in this organizational chart, each stage of the process has a team designated to it, such as Manufacturing, Order Management, and Supply Chain.
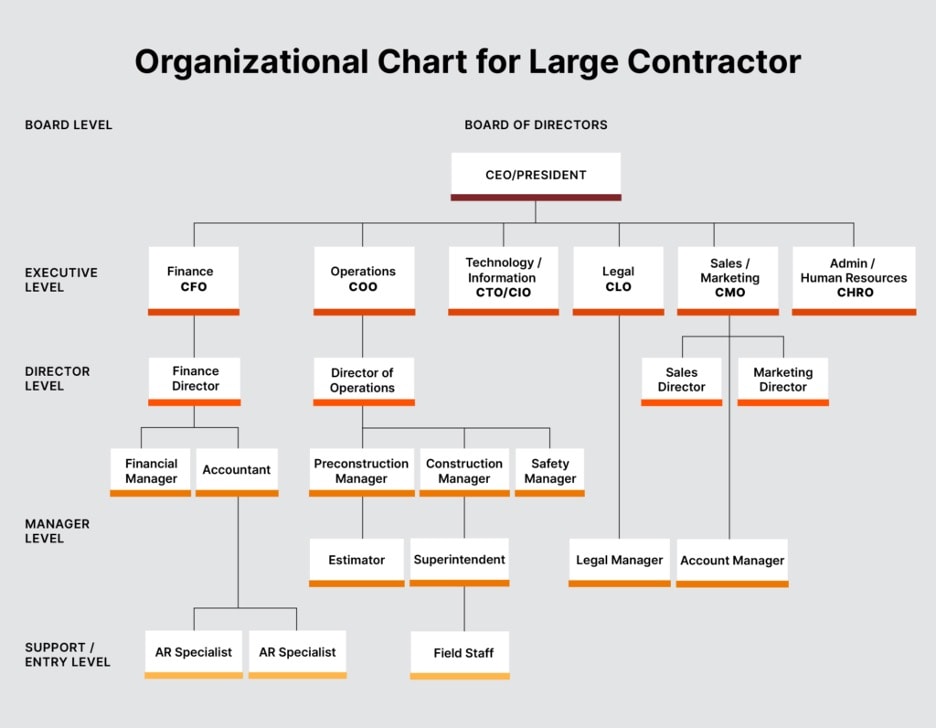
For a Construction Company
On the other hand, construction companies often employ the usual corporate setup/structure. Hence, the only thing that’s important here is to see reporting responsibilities and the actual teams related to construction. This includes teams like Safety, Pre-Construction, and Construction.
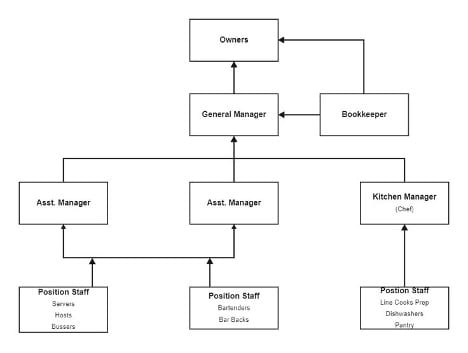
For a Restaurant
Restaurant organizational charts are pretty straightforward, especially for smaller shops. It only gets more complicated in larger chains. However, if you’re starting a restaurant or local eatery, showing the manager and the respective employees (and teams) will suffice.
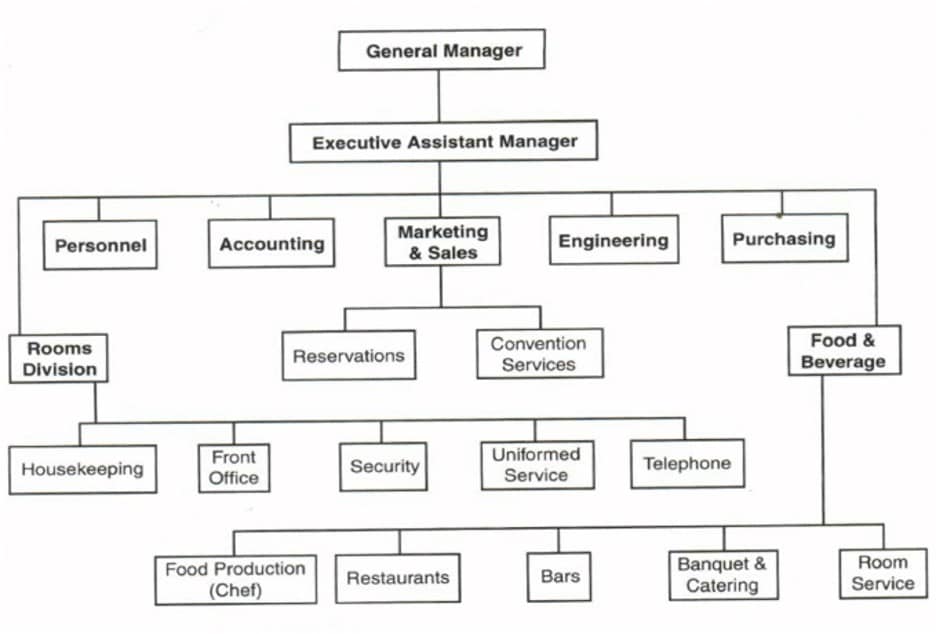
For a Hotel
For hotels, the organizational structure can be a bit more complicated. This is because hotels are public services that often involve repurchasing wares for sanitary purposes, not to mention the need to include marketing, accounting, and engineering for upkeep. Thus, keeping a clear distinction between these responsibilities is essential.
Part 9: FAQs
Here are some frequently asked questions regarding organizational charts:
1. What's the difference between an org chart and a family tree?
Org charts show professional reporting relationships within organizations, while family trees display biological or legal relationships between family members across generations.
2. What is an organogram?
An organogram is another name for an organizational chart that visually represents a company's structure, departments, and reporting relationships.
3. What is a simple organizational structure?
A simple organizational structure has few management layers between leadership and staff. It features direct oversight, quick decision-making, and clear communication, but it works best in smaller organizations.
