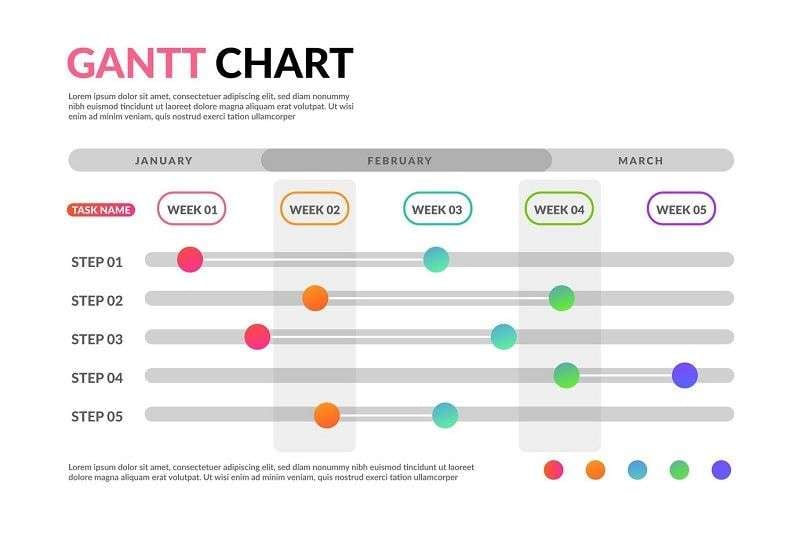
Gantt charts are essential tools in project planning and management. They allow you to visualize project timelines and allocate resources. A simple Gantt chart also ensures that tasks are completed on time.
The article introduces 3 methods that simplify creating basic Gantt charts with a few steps. It will showcase several free Gantt chart template ideas to get you started. Whether you’re managing a small project or a complex workflow, Gantt charts can make a big difference. Read on to learn more.
In this article
How To Create a Simple Gantt Chart
Creating a simple Gantt chart can be done through various methods. Each is suited to different needs and preferences. Here are three detailed approaches to help you get started:
Method 1: Create a Simple Gantt Chart in Excel
Excel is a versatile tool that offers many functionalities for creating Gantt charts. It’s a popular tool among project managers working on small or large projects.
Excel provides a range of features to suit your specific needs. It’s one of the best options available for creating Gantt charts. Here’s a step-by-step guide:
Step 1
Start by opening a new spreadsheet in Excel.
Step 2
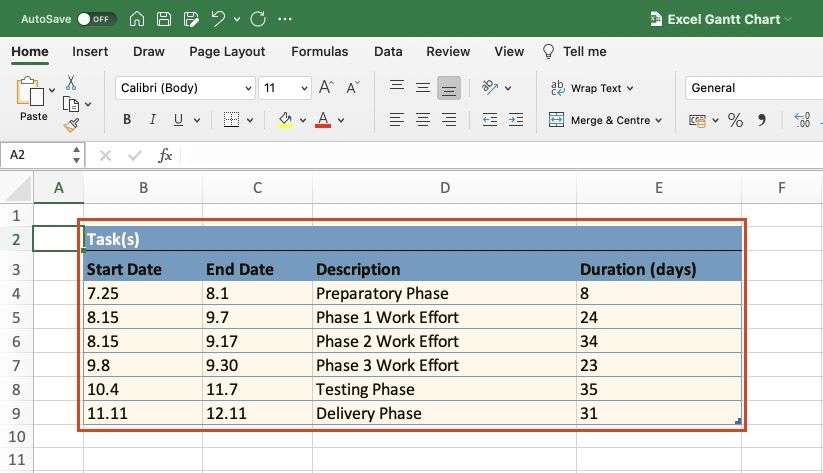
Create columns for Task Name, Start Date, End Date, and Duration. Enter the relevant data for each task in your project.
Step 3
Use the formula =End Date - Start Date to calculate the duration of each task. Make sure to format the cells to display the results in days.
Step 4
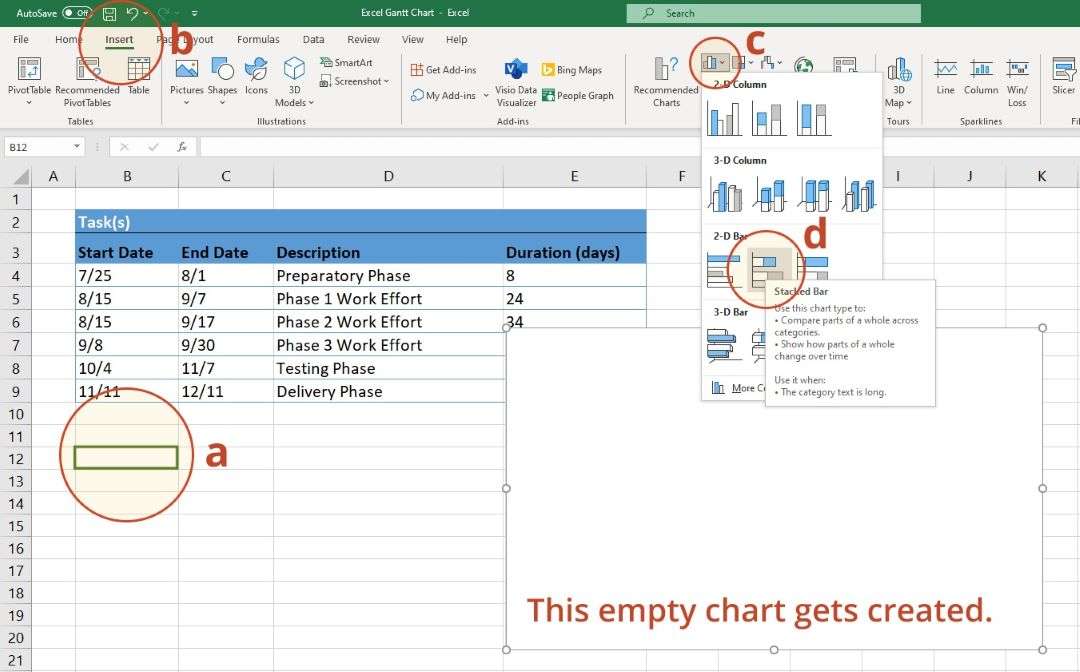
Highlight the Start Date and Duration columns. Go to the Insert tab, select the Bar Chart option, and choose the Stacked Bar Chart.
Step 5
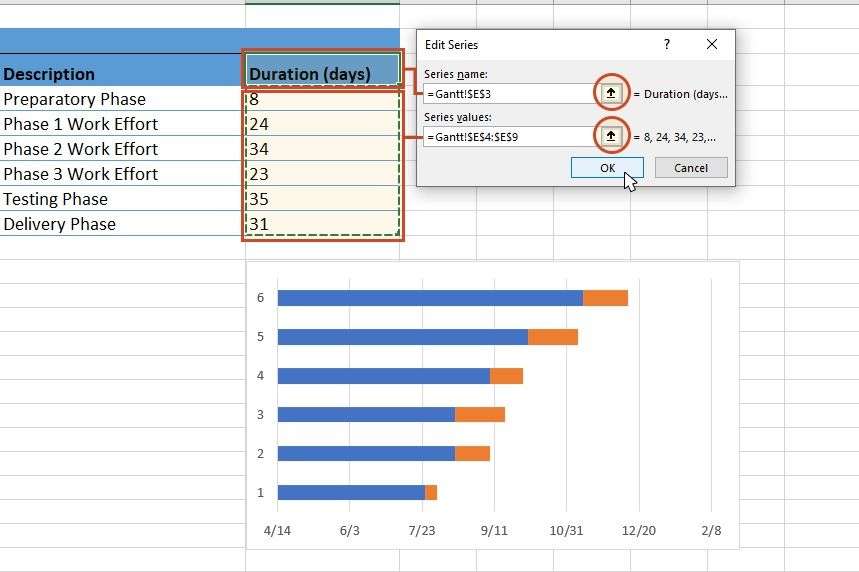
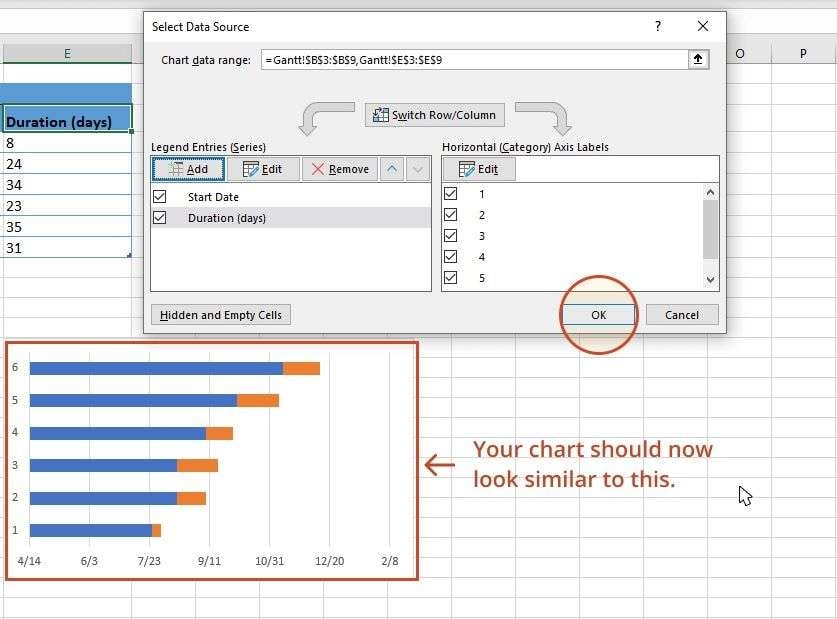
Adjust the chart to resemble a Gantt chart by formatting the bars. Set the start date bars to be transparent. This can be done by selecting the bars and choosing Format Data Series.
Step 6
Add titles, and labels, and adjust the colors to enhance readability. You can also set up conditional formatting to highlight critical tasks.
Method 2: Create a Simple Gantt Chart in Google Sheets
Google Sheets is a free, cloud-based alternative to Excel ideal for collaborative projects. It uses a similar operation to Excel. Google Sheets lets many users work on the same document simultaneously. The interface looks and feels similar to Excel, adding to the ease of use. The familiarity of the interface makes it a convenient and intuitive option for many.
Here’s how to create a Gantt chart in Google Sheets:
Step 1
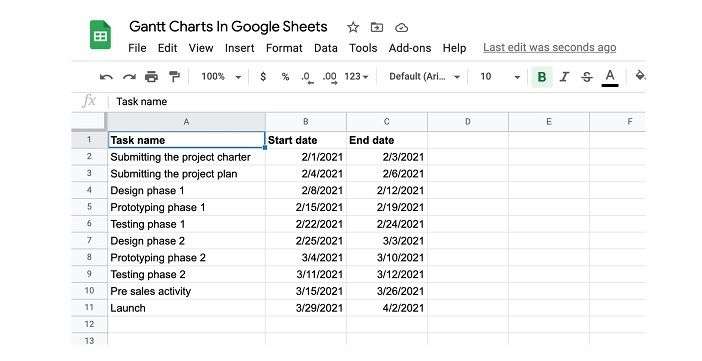
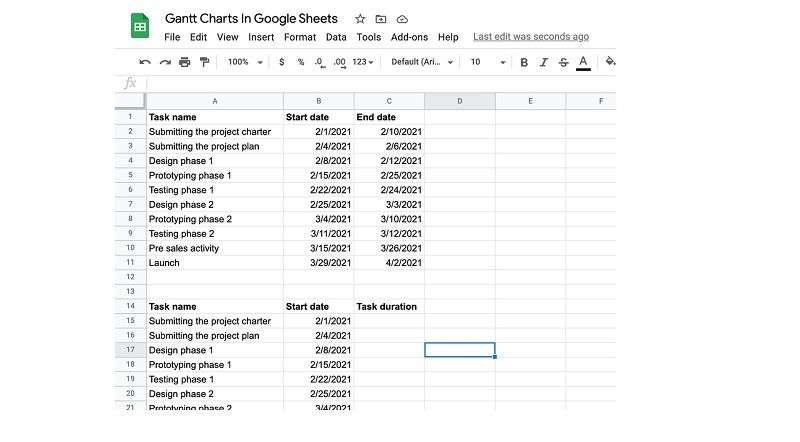
Start a new spreadsheet in Google Sheets. Create columns for “Task Name”, “Start Date”, and “End Date”. Enter the task data.
Step 2
Copy and paste the same table a few rows below. Rename the “End data” column as “Task duration”. Delete the data in that column.
Step 3
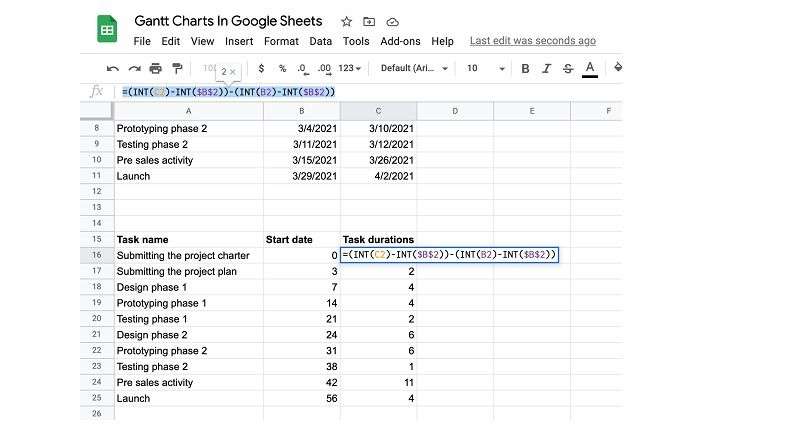
Use this formula: “=INT(B2)-INT($B$2)” into each cell. Next, use this formula for the Task duration column: “=(INT(C2)-INT($B$2))-(INT(B2)-INT($B$2))”.
Step 4
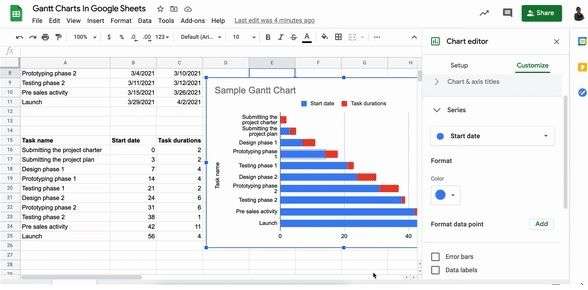
Choose all the cells in the second table. Go to Insert > Chart. Sheets will automatically create a stacked bar graph. Format the chart depending on your preferences.
Method 3: Create a Simple Gantt Chart Using a Dedicated Tool
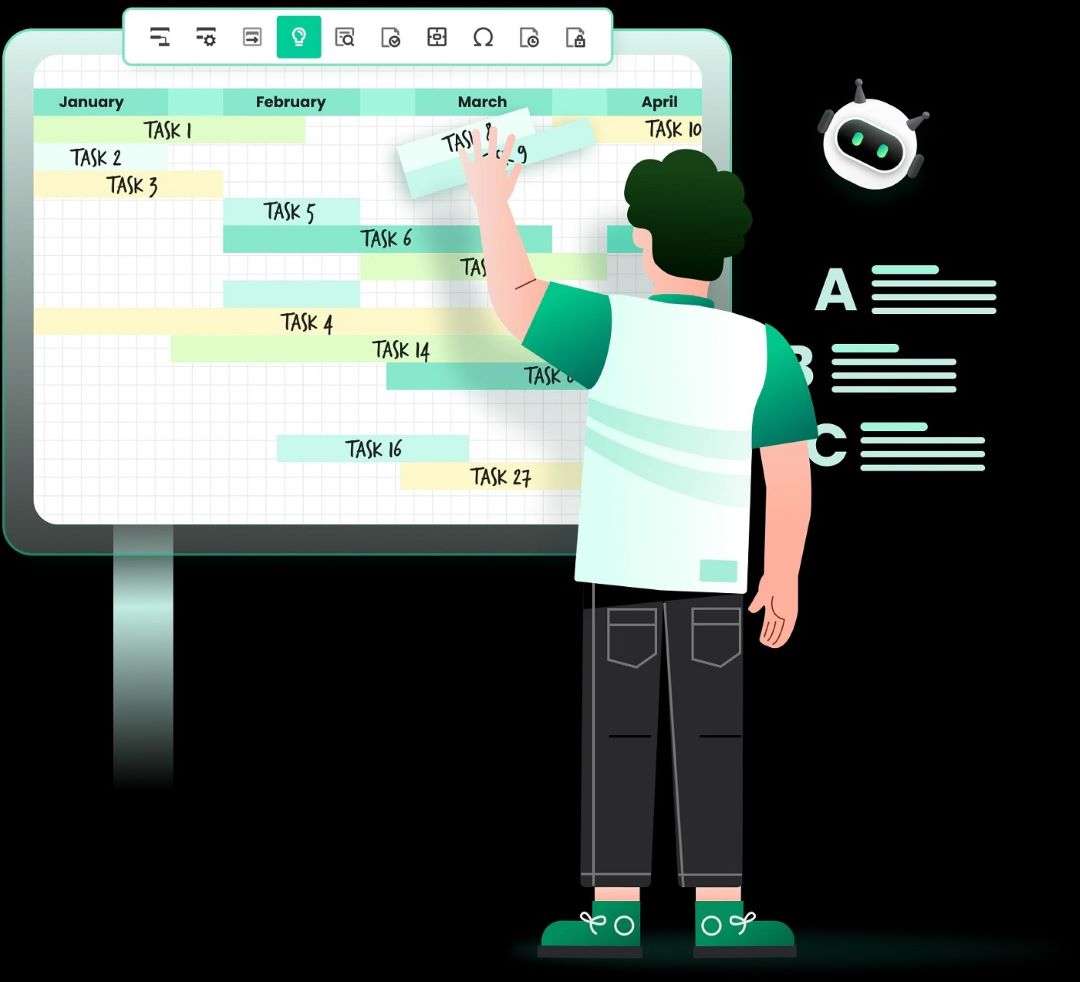
Wondershare EdrawMind is a specialized tool designed to make the creation of Gantt charts quick and easy. It offers a more dedicated and feature-rich experience unlike Excel and Google Sheets. It’s also a comprehensive diagramming tool that offers advanced Gantt chart features.
Step 1
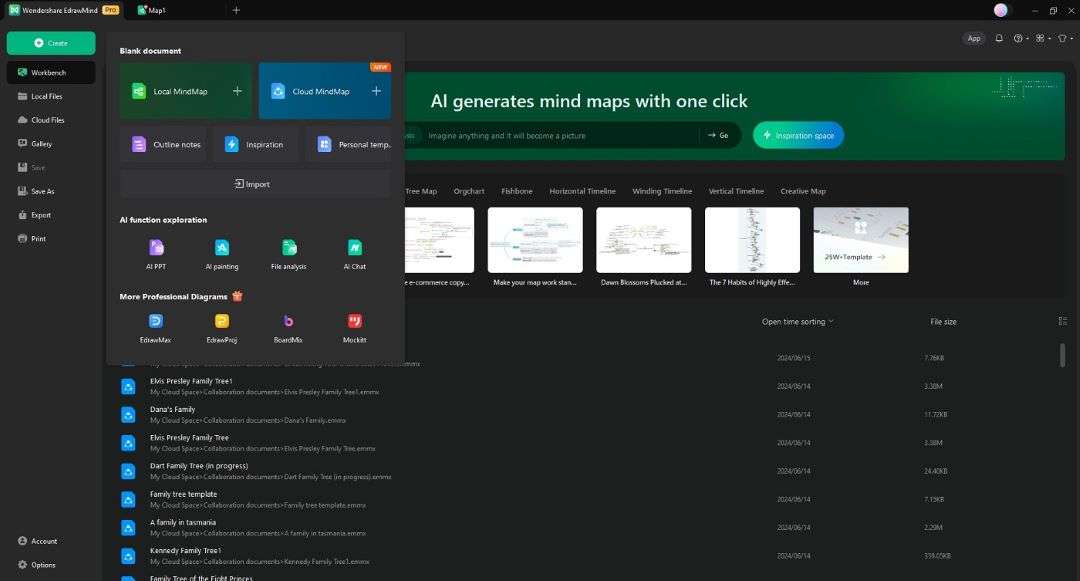
Download and install EdrawMind on your computer. Launch the software and log in or register a Wondershare account. Next, click Create > Local MindMap to start a project.
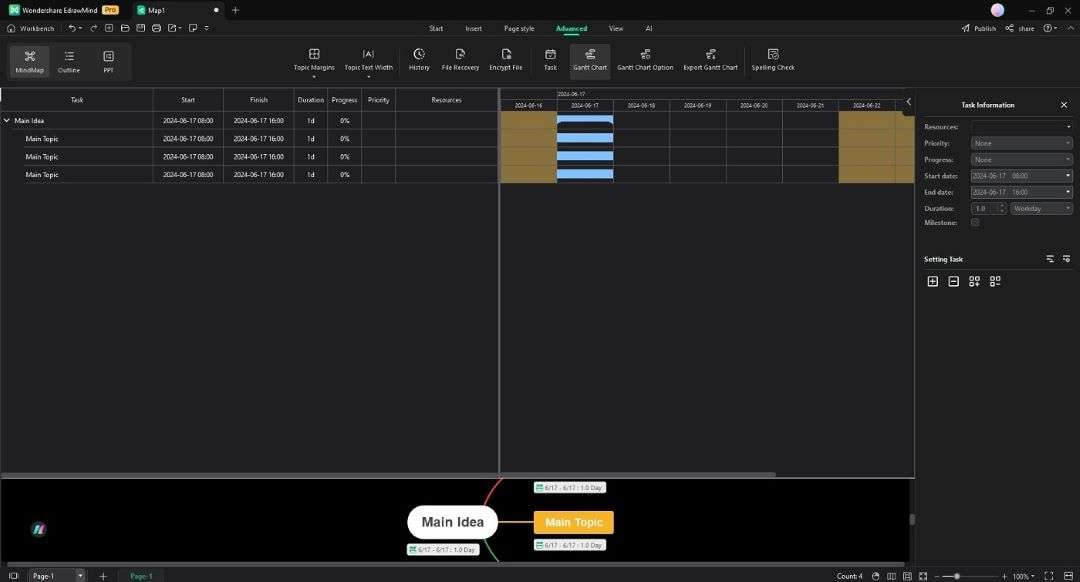
Step 2 Create and enter details within a Simple Gantt Chart
Go to the Advanced tab on your top toolbar to begin. Click the Gantt chart option and choose a topic. Click the add task info icon in the Setting Task menu on the right. Click delete task info to delete tasks.
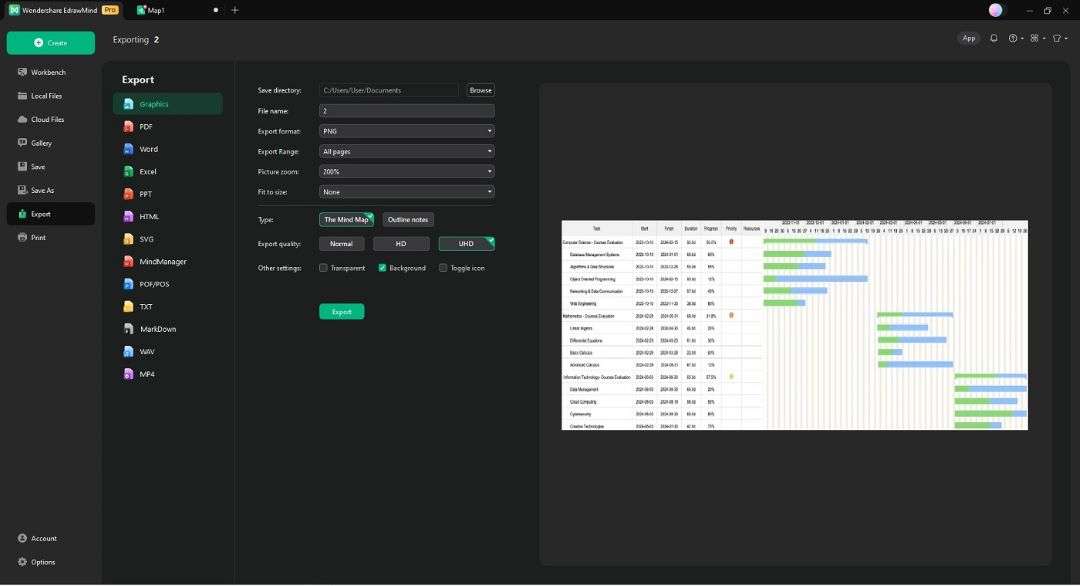
Step 3
Add the data format, major and minor units, and the start and finish time. Set the name for your Gantt chart. Click Save and export the Gantt chart in a compatible format.
Here’s how EdrawMind creates simple Gantt charts with ease:
- Edraw AI: EdrawMind has an AI-powered Gantt chart maker that simplifies the creation process.
- Drag-and-drop functionality: You can easily add and rearrange tasks using the drag-and-drop feature.
- Flexible template library: Gain access to a wide range of Gantt chart templates in the MindMap Gallery.
- Customizable styling options: Personalize your Gantt charts with different fonts, colors, shapes, and more. Refine your Gantt chart to suit your preferences and branding needs.
- Real-time collaboration: Collaborate with team members in real-time. Share updates and work together on projects with ease.
- Cross-platform compatibility: EdrawMind is available on desktop, online, and mobile platforms. The software ensures you work on your projects from anywhere.
What Are the Key Elements of a Simple Gantt Chart?
A Gantt chart is composed of several core components that help streamline project management:
Tasks
These are the individual activities that need to be completed within the project. Each task should have a clear, concise name and description. Tasks let’s everyone know what needs to be done.
Timelines
Timelines show the start and end dates for each task. In a Gantt chart, these timelines are visualized as horizontal bars. The length of a bar in a Gantt chart corresponds to the duration of the task. It helps project managers and team members see when tasks start and end.
Milestones
Milestones are points in the project that mark the completion of major phases or achievements. They act as checkpoints that help track progress and ensure that the project stays on schedule.
Dependencies
Dependencies indicate the relationships between tasks. It tells you which tasks must be completed before others can begin.
Resources
Resource allocation involves assigning team members, equipment, or budget, to each task. This ensures that you can take advantage of available resources when needed.

Benefits of Using a Simple Gantt Chart
- Project planning: Gantt charts assist in organizing tasks and setting realistic deadlines. They ensure all aspects of the project are accounted for.
- Timeline visualization: Gantt charts make it easier to understand the timing and sequence of tasks.
- Resource allocation: Effective resource management assigns and tracks resources for each task.
- Progress tracking: Gantt charts allow for ongoing monitoring of task completion and project progress.
- Enhanced communication: Gantt charts improve communication among team members and stakeholders. It provides a clear and shared visual reference for the project’s status.
Conclusion
Using simple Gantt chart templates can enhance your project planning and management. They provide a clear and structured way to organize tasks, timelines, and resources. Beginners or professionals can track progress more easily with a simple Gantt chart template for the timely completion of projects.
Explore the methods for creating Gantt charts, from Excel and Google Sheets to tools like EdrawMind. Nonetheless, EdrawMind offers a powerful solution for all your project management needs. Start planning your projects with an easy Gantt chart maker today.


