


Drafting a plan is the first thing that comes to mind when the group lead assigns a project. The entire team suddenly enters the brainstorming mode. They think about how to sequence tasks, define durations, and allocate resources.

But a smart thing would be turning to Gantt charts. These charts are excellent for scheduling projects, managing deadlines, and tracking the progress of each activity. Plus, their visual layout is much more effective in getting a project's bird's eye view.
Want to know more about what's a Gantt chart and how to use it in project scheduling? Keep on reading.
In this article
What is a Gantt Chart
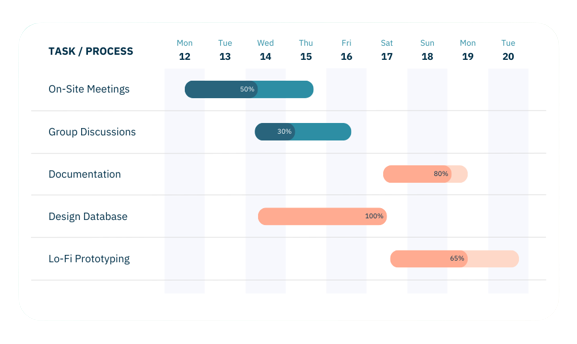
Gantt chart is a project management diagram popular for planning and scheduling projects. Typically, it shows a graphical representation of activities against time, providing expected deadline estimates. With a Gantt chart, professionals can monitor progress, allocate resources, and schedule tasks accordingly.
Generally, Gantt charts are plotted on two axes, Y and X. The X-axis represents the timeline against the Y-axis represents the tasks. The chart itself has horizontal bars depicting tasks’ lengths and progress. Let us get a peek at what a Gantt chart offers.
- A list of the tasks
- The start and end date of each task
- Length and timeline of these tasks
- Resources used to facilitate the tasks
- Overlapping of tasks
- Progress of work
Uses of Gantt Chart
Gantt charts functional structure and intelligent tracking feature make them a useful diagram across most industries. Here are some common uses of Gantt charts:
- Construction: Communicating with field teams and subcontractors
- IT Businesses:Drafting solutions for system applications, scheduling research projects
- HR/ Consulting Agencies: Keeping clients updated about progress and streamlining communication.
- Manufacturing: Production planning and scheduling, delivering products.
The History of Gantt Charts
In the early 1890s, a Polish engineer named Karol Adamiecki developed a harmonogram. It was the first Gantt chart precursor with a display of tasks against time. However, the chart did not get global recognition due to the Polish language used.
In the meantime, Henry Gantt, an American management consultant and mechanical engineer, proposed his first Gantt chart draft. He used a bar chart with a deliverable-against-time concept to facilitate their production project. Along with his colleague, Fredrick Taylor, he introduced a method of planning manufacturing activities and resources.
However, Gantt charts were prepared manually with numerous drafts. The manager had to update the activities by hand each time, making it hectic and lengthy. The advent of computers made it manageable to calculate and plot activities against time in the 1980s.
Today, Gantt charts are digitalized. Software like Excel and EdrawMind make it possible to edit and modify charts in minutes It helps professionals change milestones, follow up on deadlines, and change critical paths conveniently.
Gantt Chart Development Timeline
- 1896- Karol Adamiecki created his first-ever harmonogram in the Polish language
- 1910 to 1915- Henry Gantt published a bar chart to plan a project schedule.
- 1912 - Harmann Schurch created a construction Gantt chart inspired by Henry.
- The 1980s - Gantt chart became famous with the advent of computers.
The Pros and Cons of the Gantt Chart
1. Pros
- Project Overview: Gantt charts offer a project’s bird’s eye view. Thus, anyone can quickly look at complete project details at a glance.
- Managing Deadlines: The Gantt chart has a complete record of the progress of each activity. It helps teams stick to the deadlines and reach preset milestones.
- Managing Resources: These charts help you visualize activities. So, it is easier for professionals to divide complicated tasks into subtasks and allocate resources better.
- Visualizing Activities: It offers you an illustration of the overlapping activities. This way, it is easier to take multiple tasks simultaneously.
- Team Productivity: Gantt charts are an excellent tool for teams to collaborate. It makes information easily accessible to everyone, even remote workers. So, when everyone is on one page, making decisions and facilitating workflow is a walk in the park.
2. Cons
- Time Consumption: Creating Gantt charts requires never-ending work. Teams are always updating the tasks and milestones during the project. Hence, it demands an individual to constantly update the diagram, which can be tiring. Therefore, a better alternative is software that offers automatic updates.
- No Account for Work Done: The horizontal bars on Gantt charts show the time required for each task. But it has no account for how much work it needs.
- Limited Task Dependencies: The Gantt chart uses dependencies to suggest that you must complete one task to start another. Yet, it lacks details in providing insight regarding each activity. It can upset the duration estimate.
How to Create a Gantt Chart
Here is how you can kickstart your journey of making project Gantt charts.
Step 1Make a Task List
Gather your team and discuss the project. Use the Work Breakdown Structure technique to make a list of the tasks. It helps you separate complicated and easy tasks.
Step 2Insert Dates
Allocate an estimated completion time to each task. Consider the level of difficulty, steps, and resources you will need for each task. Make a table with three columns for the task title, start date, and end date. Do consider that it may happen that two tasks are progressing simultaneously.
Step 3Add Milestones
It is time to add milestones to mark the completion of the tasks. Having these milestones for deliverables helps the team boost their morale.
Step 4Plot Dependencies
Identify dependencies. Dependences are simply two or more tasks occurring at the same time. So, unless both are finished, you cannot proceed further. Skipping this step would interrupt the workflow.
Step 5Select a Software
Once you are done planning everything, it is time to plot them using charts on the canvas. What’s better is that you look for advanced diagram software that helps you add details. Two popular options would be Excel and EdrawMind. But given the easy interface and pre-built examples, EdrawMind might be better for making such charts quickly.
Step 6Start Working
Finally, assign the tasks to your time and start working. Once you start completing tasks, update them regularly in the chart.
Gantt Chart Example
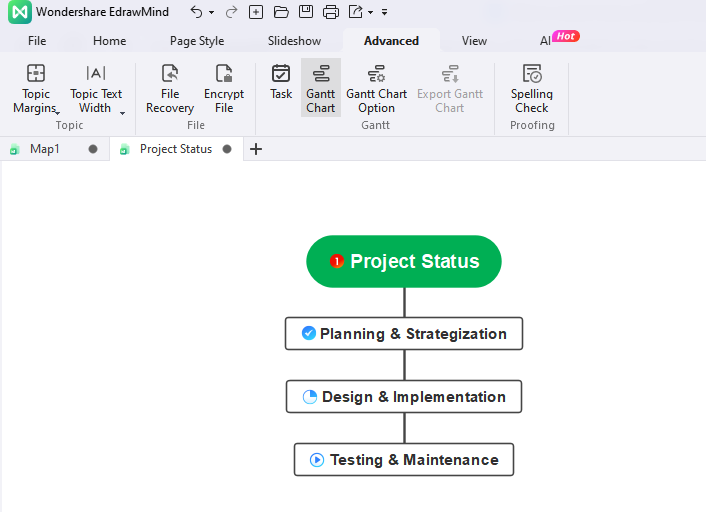
Manually editing and updating Gantt charts means spending an eternity from your busy schedule. However, you can save this time with advanced diagramming tools like EdrawMind. It has a Gantt chart functionality that displays lengthy projects using horizontal taskbars.
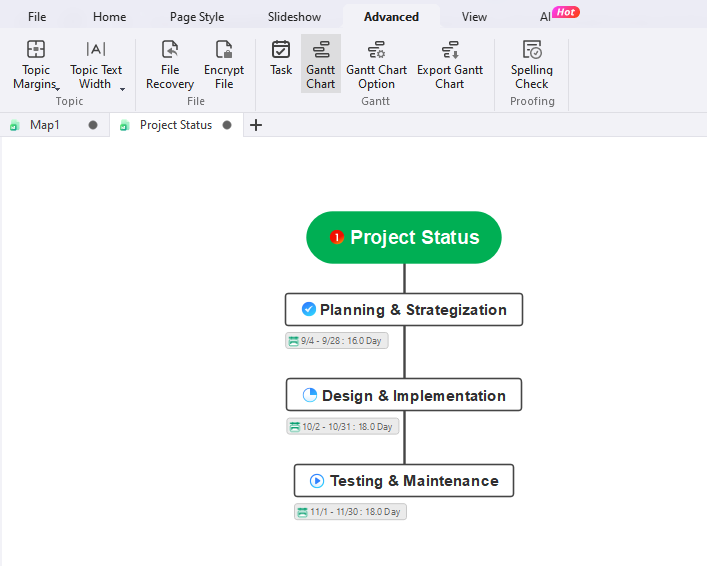
Just enter the data, and you are done. Plus, you can change your mind maps and outlines into fully-fledged Gantt charts directly after getting notes from a successful brainstorming session. Once the chart is complete, EdrawMind allows modifications. Users can add or remove tasks, identify dependencies, or change their durations without any mess.
 below.
  below.
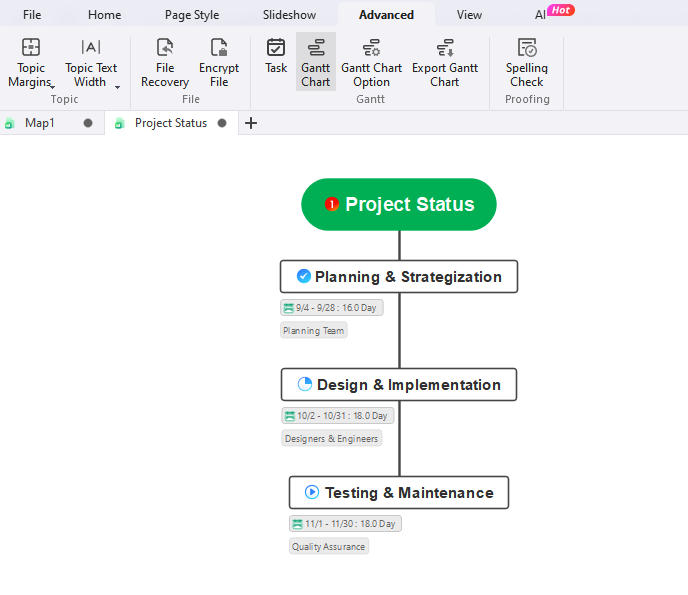
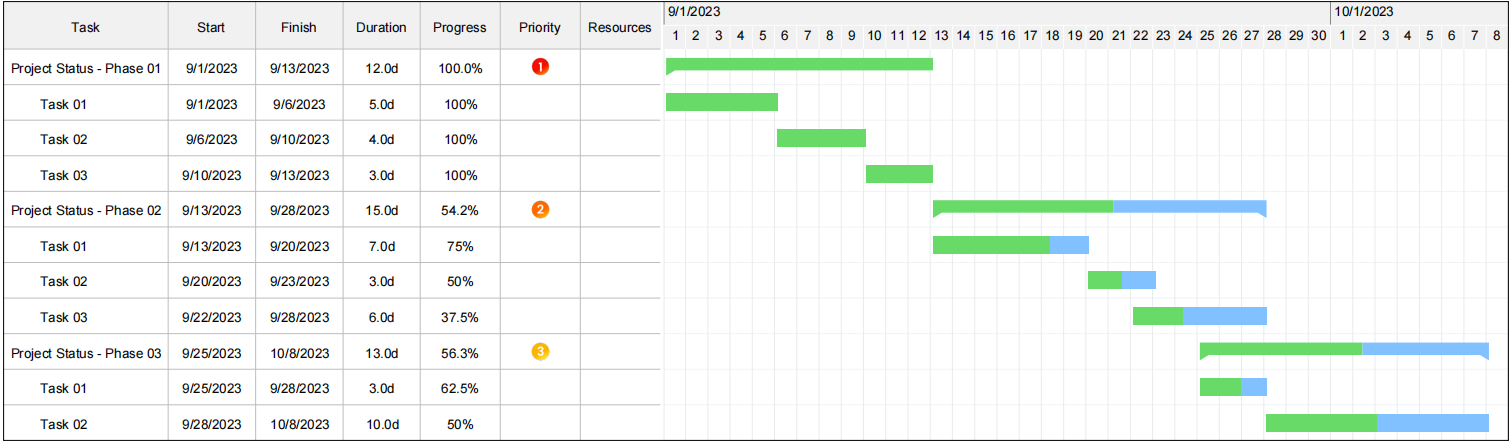
 This project management completion template is an excellent substitute for teams to collaborate. It is easy on the eyes and highlights tasks, helping schedule large projects. Using the task tabs, you can also plan, design, and implement deliverables within defined deadlines.
It further allows the modification of progress stats, durations, and resources. So, when you are done with a milestone, upgrading it is a matter of seconds. Moreover, this template takes it a step ahead and introduces a separate column for priorities. Thus, you can also rank tasks according to urgency.
Conclusion
Project managers, team leads, and marketing analysts are always working with tight deadlines. So, keeping track of individual projects is extremely nerve-wracking. In this case, the only solution is a well-put Gantt chart.
Knowing what's a Gantt chart helps big teams collaborate on projects. They help you visualize and track the project performance using small milestones.
But drawing and manually updating Gantt charts might take up all your time. So, choose working smart and turn to advanced diagramming tools like EdrawMind. Its pre-built Gantt chart templates are a great help for making and updating such charts constantly. Give it a try and you may find its intuitive interface a blessing.
