In this article
What is the Process Decision Program Chart
A Process Decision Program Chart or PDPC is a visual representation of a tool that is used to systematically find errors within a project while it is being created or developed by a team. Once any potential bottlenecks or issues are found, the team adds preventative measures to avoid them or even creates a contingency plan that can be later put into effect if the said error occurs.
A process decision program chart plays a very important role in project management because:
- Risk Assessment: With PDPC in place, the project management team can identify potential risks and uncertainties within a project. Such visual tools allow the team to map out different decision points and potential outcomes. This way, the project management team can have a proactive approach towards the project that enables better risk assessment and the development of any mitigation strategies.
- Visual Representation: Consider PDPC as an elaborated flowchart where we are also including all the potential risks. This visual illustration of decision points aids in communication within the project team.
- Resource Planning: When it comes to decision making in project management, resource planning is very crucial. The PDPC helps in evaluating the resource requirements at each decision point, which enables effective resource planning and allocation.
In this detailed process decision program chart guide, we will discuss this tool in detail. At the same time, we will also provide you with a step-by-step guide to making a PDPC with EdrawMind.
Key Components of PDPC
In order to make a process decision program chart, one should have a thorough knowledge of its key components. The key components of PDPC provide a structured representation of tasks and decisions that follow a hierarchical order.
The key components of PDPC are divided into two sections:
1. Nodes and Branches
Nodes and branches in PDPC serve as the building blocks as we go ahead and create a hierarchical structure. Nodes, in general, represent tasks and decision points, whereas the branches are used to illustrate the relationship and flow between the mentioned elements.
Representation of Tasks & Decisions
- As mentioned, each node in the PDPC signifies a specific choice or decision that needs to be made.
- The PDPC visually organizes the sequences of these tasks and decisions that help the team to get a clearer roadmap as they develop the project.
Hierarchical Structure
- Traditionally, PDPC follows a hierarchical structure where different nodes and branches are organized logically.
- Such distinctive hierarchical systems help understand the relationship between tasks and their respective decisions.
2. Risk Analysis
Risk Analysis in PDPC involves a proactive approach that includes the identification of potential problems at several different decision points.
Identifying Potential Problems
- The primary function behind creating a PDPC is to identify a potential problem before it happens. Remember, in a PDPC, each decision point is an opportunity to uncover any future risk associated with that node.
- By explicitly mapping out such problems, different project teams can address them and even try to reduce the possibility of it happening shortly.
Evaluating the Impact of Uncertainties
- What sets PDPC apart from a traditional decision chart is the fact that it helps in evaluating the impact of any uncertainties associated with the project. What it helps uncover is the fact that different decisions may lead to varied outcomes.
- Since there are going to be uncertainties, project management teams can prioritize and allocate resources accordingly.
How to Create A Process Decision Program Chart
Check out the following steps if you are planning to make a process decision program chart with EdrawMind:
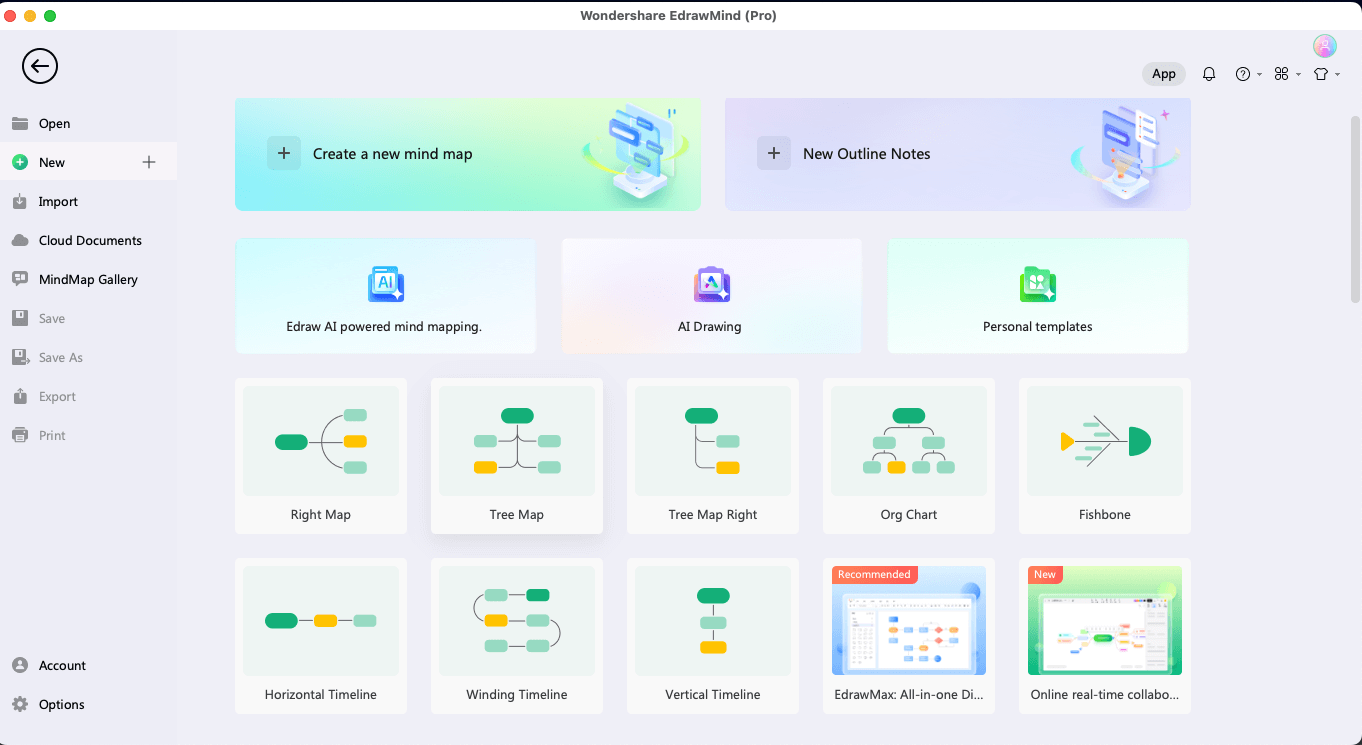
Step 1:Choose a Tool
Start your process decision program chart design by launching a process decision program chart software in your system. In this step-by-step guide, we use EdrawMind, a free-to-use tool offering many templates and customization options.
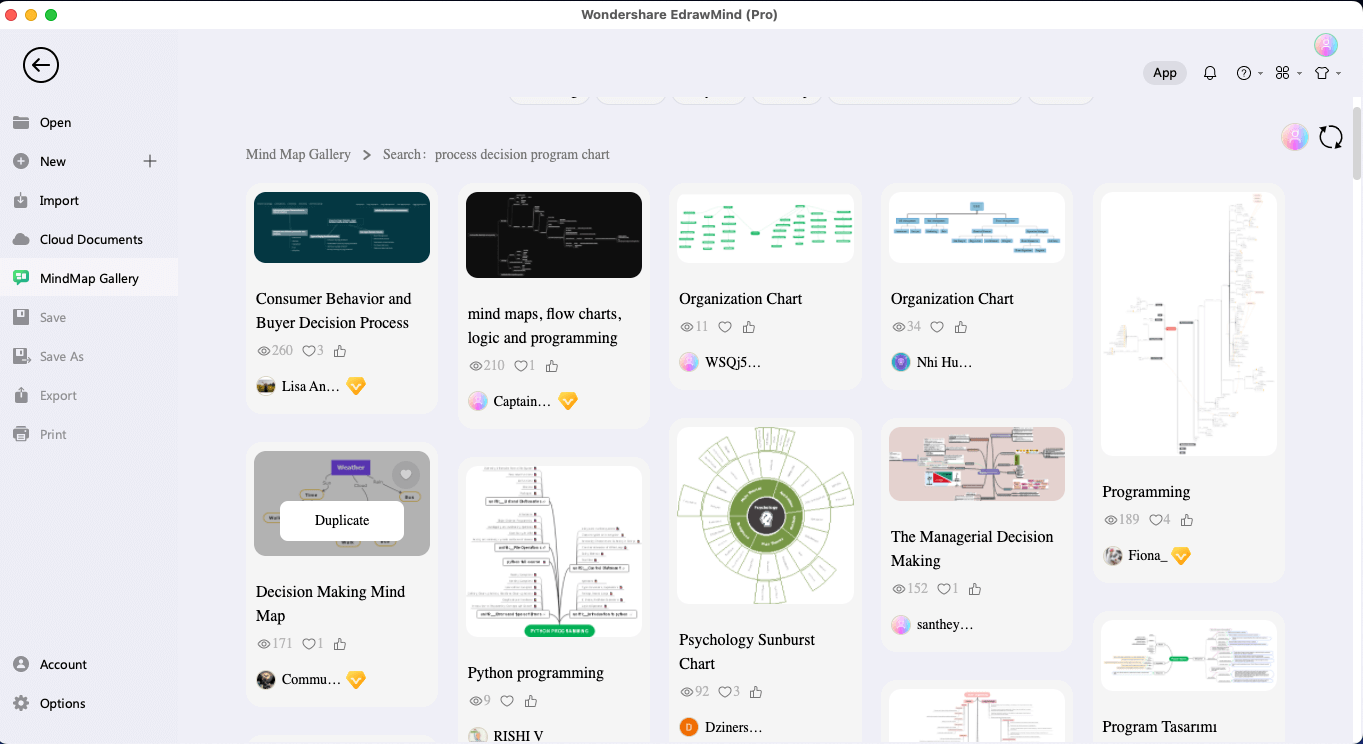
Step 2:Templates or Scratch
If you know all the branches you need to add, you can always start from scratch. But if you need help or inspiration from previously designed PDPC, we recommend checking out some free templates to get you started.
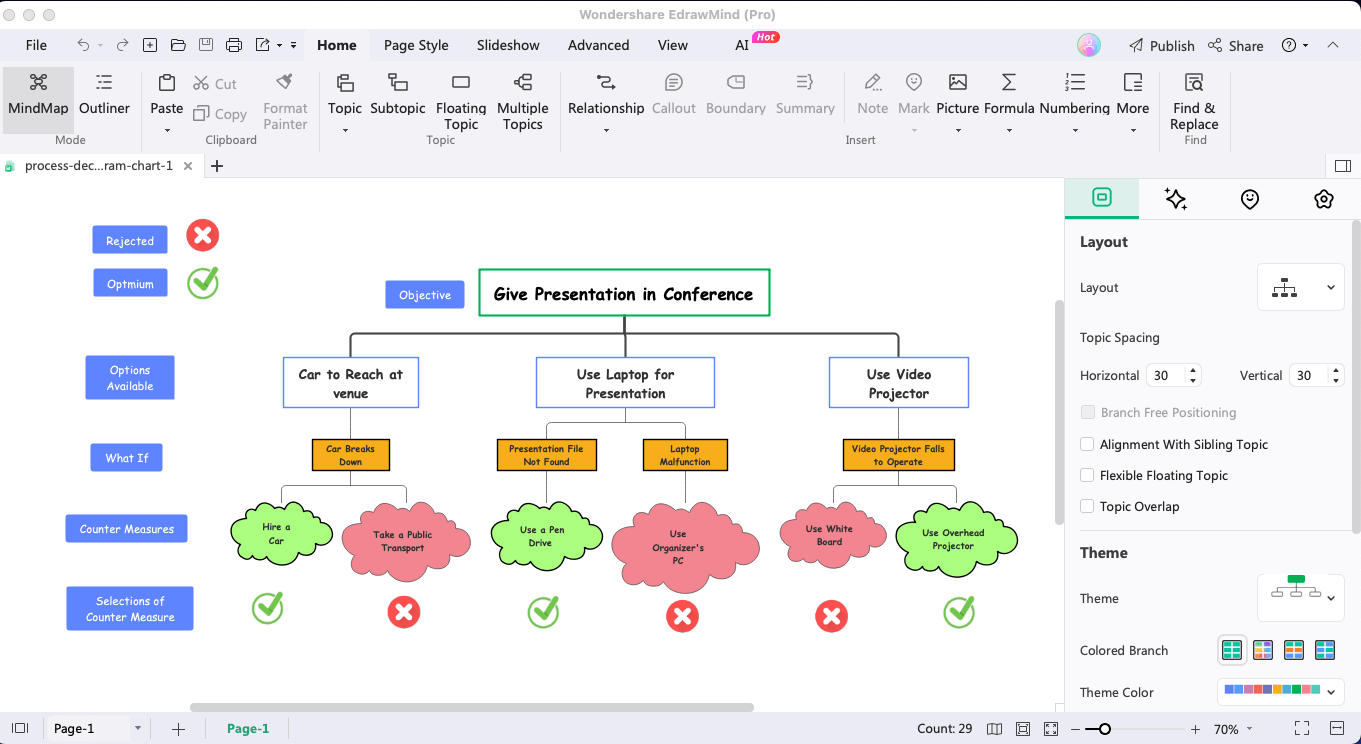
Step 3:Add Nodes & Branches
Use the tool’s intuitive interface to add nodes and branches to your PDPC. Remember that the nodes represent the tasks, and branches depict the relationship between these decision points.
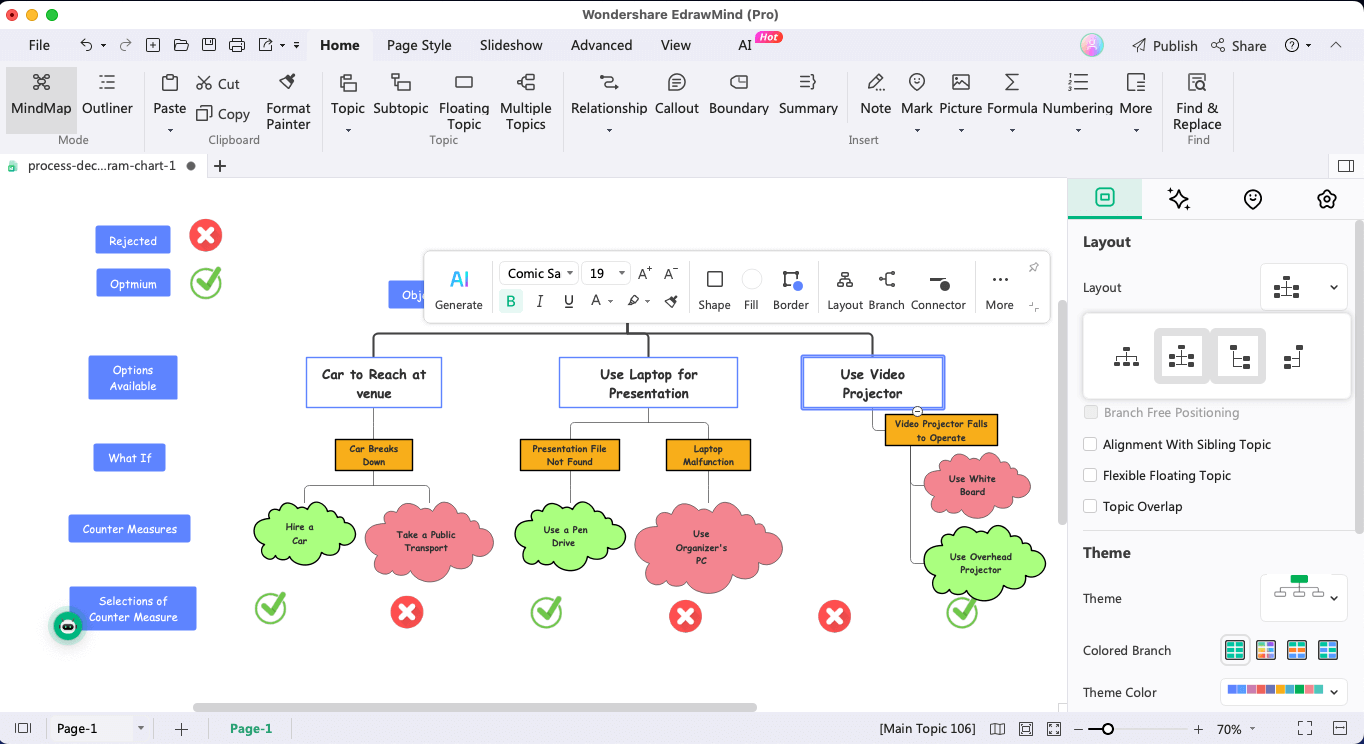
Step 4:Customize the Hierarchical Structure
A typical PDPC is hierarchical and may feel cluttered if not correctly customized. Try using EdrawMind’s built-in customization options to modify the layouts or themes of your PDPC.
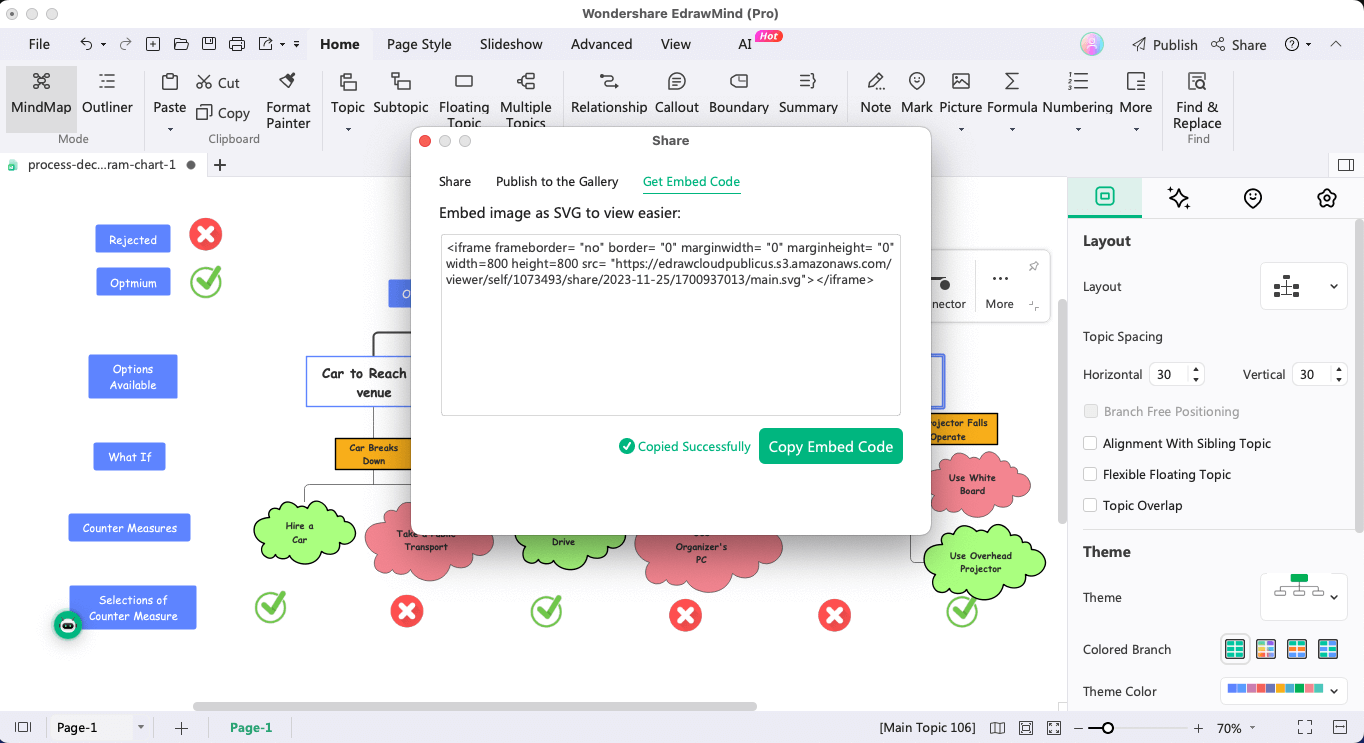
Step 5:Export & Share
nce your PDPC is completed, you should export it in your desired format. You can even share the chart online with your peers for further revision or revaluation.
Benefits of Using Process Decision Program Chart?
There are several key benefits of using a process decision program chart in project management or other business-related or personal endeavors, like:
- Improved Decision Making: A well-structured PDPC diagram lays out decision points that foster a comprehensive understanding of different outcomes. This leads to more clarity for teams and helps them make well-informed decisions.
- Risk Management: A tailored PDPC can help assess potential risks that would help the teams develop risk mitigation strategies.
- Visual Representation: A project management team can visually understand several outcomes of their actions, which lets them avoid working on different parameters.
- Resource Allocation: With PDPC, project managers can evaluate the resources and assign them when and where they are actually needed.
- Project Control: With a clear roadmap of different decision points, PDPC provides a way to control the overall project where teams can monitor progress, analyze bottlenecks, and implement prompt actions.
Process Decision Program Chart Template
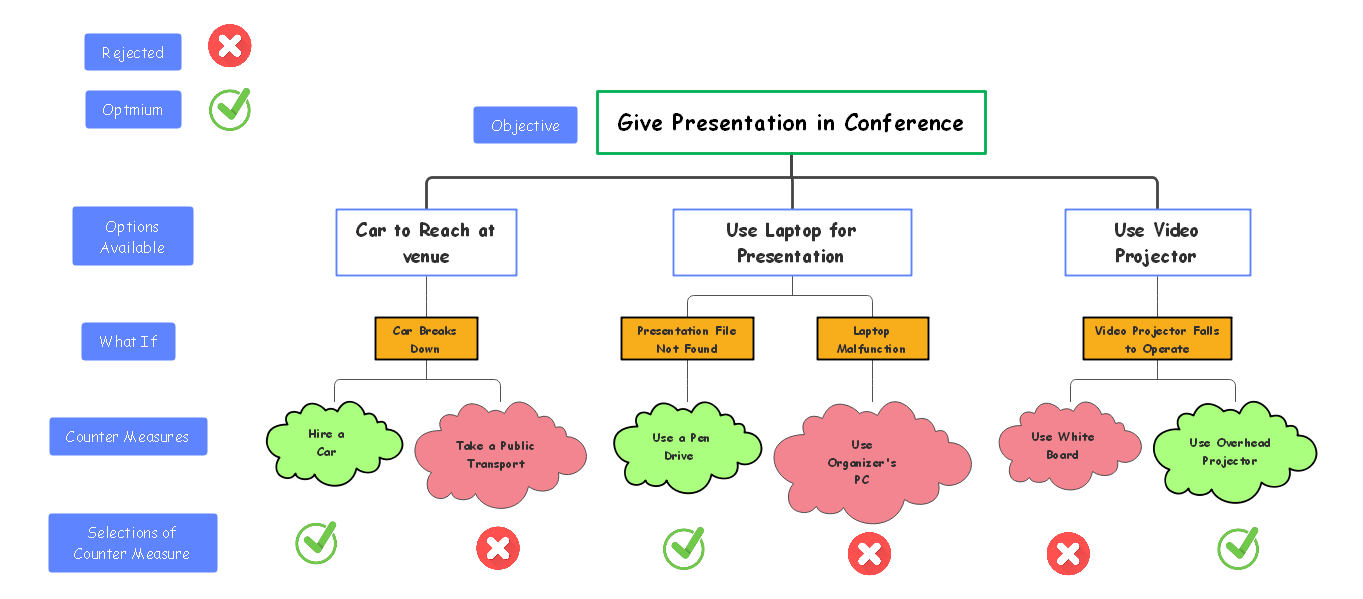
As shown in the following process decision program chart template, the current objective is to deliver a successful presentation at a conference. As you can see, the chart outlines multiple scenarios that are related to this objective, like transportation to the venue, utilizing the laptop for the presentation, and relying on a video projector. Each of these segments has potential outcomes, like the possibility of the car breaking down, the presentation file not being found on the laptop, and the video projector failing to operate. The chart not only identifies the issues but also guides towards optimal solutions.
Such extensive process decision program chart templates are created in EdrawMind and can easily be downloaded from the MindMap Gallery.
Tips for Effectively Using PDPC
Some of the most common tips for effectively using PDPC are:
- Involves Relevant Stakeholders: When creating the PDPC, try to involve all of the team members, including project managers, stakeholders, and decision-makers. This way, you can have individuals with diverse expertise to enrich decision-making.
- Facilitating Communication: Try to foster an environment that encourages open communication. Try to articulate the project’s goals and decision points that ensure all team members comprehend the implications.
- Regular Review: Implement a system that allows regular updates as the project progresses. This will ensure that the PDPC will reflect the ever-evolving project landscape.
Conclusion
The Process Decision Program Chart, or PDPC, is an important tool for project management and other business-related activities. It offers a systematic approach to decision-making and easy risk mitigation. The flexibility of PDPC allows the team to incorporate multiple scenarios and identify optimal solutions with the given resources. As you saw in this PDPC guide, creating one with EdrawMind is extremely simple. The tool has free PDPC templates that let you customize the content easily. Try employing PDPC made with EdrawMind as you navigate to different uncertainties in your project.
FAQ
-
When is the best time to create a PDPC?
The best time to create a PDPC is when the project is in the infant stage. This way, you can add all the possibilities and respective outcomes without missing any important information. -
How can PDPC be applied in Project Management?
PDPC provides a structured framework for decision-making and risk analysis that helps in resource optimization, enhanced communication, outcome mapping, and identifying decision points. -
Are There Any Limitations to Using PDPC?
There are a few limitations to using PDPC, like complexity, static nature of the charts, time-bound, and dependency on certain assumptions.



 below.
  below.