


In this article
What is a Fishbone Graphic Organizer?

A fishbone graphic organizer or Ishikawa diagram is a visual problem-solving technique used to identify and analyze the potential causes that might contribute to a specific problem. Japanese quality control expert Dr. Kaoru Ishikawa first coined this process management technique in the mid-1960s. Since then, several process management experts have developed the cause-and-effect diagram depending on domains and industries.
Importance of Fishbone Graphic Organizer
When solving problems by following a structured framework, most companies and experts prefer to go ahead with fishbone diagrams. Some of the benefits of using this technique for problem-solving are:
- Visual Illustration: By creating detailed Ishikawa diagrams, we can visually see the bottlenecks and issues that are causing the problem.
- Systematic Analysis: At the core, Ishikawa fishbone diagrams encourage systematic thinking that prompts the teams to consider different categories to identify potential causes.
- Continuous Improvement: Ishikawa diagrams do not offer a one-time solution to any problem; rather, they align with the principles of continuous improvement, where the teams can implement lasting solutions that prevent the recurrence of identified issues.
- Versatility: The fishbone graphic organizer is one organizing method that is useful across different industries, from healthcare to project management to manufacturing and software development. The rules of Ishikawa diagrams can easily adapt to the industry, making them a valuable tool in various contexts.
Main Purpose of Fishbone Graphic Organizer
The fishbone graphic organizer serves as an invaluable tool when problem-solving and ensuring that such errors do not occur shortly. The primary function of creating Ishikawa diagrams is to identify, brainstorm, and analyze the root causes of problems and even systematically understand the outcomes.
Some of the main purposes of creating Ishikawa fishbone diagrams are:
- Root Cause Analysis: By creating systematic fishbone diagrams, organizations can easily facilitate root cause analysis. By creating a proper segmentation of causes and sub-causes, teams within the organizations can explore different factors that are responsible for generating the problems.
- Identifying Relationship: When we create an Ishikawa diagram, we focus on finding and later highlighting the relationships between different causes and effects. The most common categories are Manpower, Materials, Measurements, Mother Nature/Environment, Methods, and Machinery. If teams can organize the causes into these categories, they will realize how these elements interact to create the observed outcomes.
How to Use Fishbone Graphic Organizer
When to use the fishbone graphic organizer?
The Fishbone Graphic Organizer, or Ishikawa Diagrams are particularly useful when:
- Problem-Solving: When the team sits down to brainstorm to identify the undesirable outcomes, the Ishikawa fishbone diagrams provide them with a structured method that helps them ease down the process.
- Process Analysis: By creating detailed fishbone diagrams, teams can analyze processes and workflows. This analysis results in identifying the bottlenecks and inefficiencies.
- Quality Improvement: Almost all industries are constantly trying to evolve. In industries like manufacturing and healthcare, the Fishbone graphic organizer is used to improve product quality by addressing the root causes -- ensuring that there are no errors or defects.
How to Use Fishbone Graphic Organizer?
Depending on the problems you address, a fishbone graphic organizer can be created and analyzed in multiple ways. However, the basic principle behind using the Ishikawa fishbone diagram remains the same:
- Understanding the problem: Sit down with your team members and clearly articulate the outcome that you wish to produce using the cause-and-effect diagram.
- Create the diagram: Use tools like EdrawMind to create the fishbone diagram with ease. Always start with addressing the problem, followed by drawing the main horizontal line and attaching the “spine“ in the middle.
- Work on Categories: Once you start brainstorming, determine the appropriate categories as mentioned above.
- Analyze and Prioritize: Brainstorm the relationship between different causes and how they contribute towards the problem. Once you have identified them, try to locate the root cause that may have the most significant impact on the given problem.
How to Make Fishbone Graphic Organizer Easier
To easily create a fishbone graphic organizer, check out the following steps:
Step 1: Open EdrawMind & Login
The first step is to download and install the latest version of EdrawMind from the official site. You can use your personal or professional email address to Register.


Step 2: Template Selection
Once inside the EdrawMind dashboard, click on 'MindMap Gallery' and look for Fishbone Diagrams. EdrawMind has thousands of user-generated built-in templates that you can instantly duplicate.

Step 3: Create from Scratch
If you want to create everything from scratch, click 'Fishbone', and EdrawMind's auto-formatted algorithm will take you to the canvas, where you can create the fishbone graphic organizer from scratch.
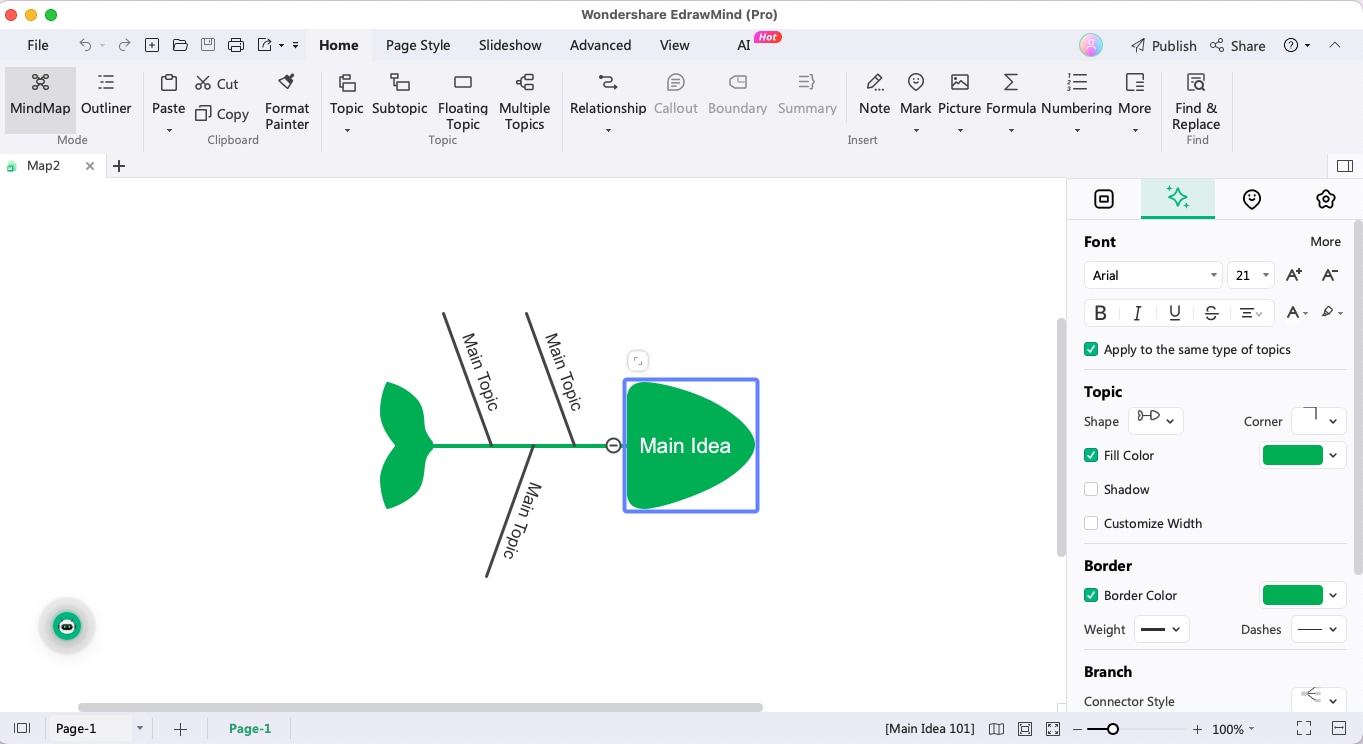
Step 4: Select the Symbols
Start the diagramming by adding the Effect in the fish's head. You can then use built-in symbols to create a more dynamic effect on your diagram.
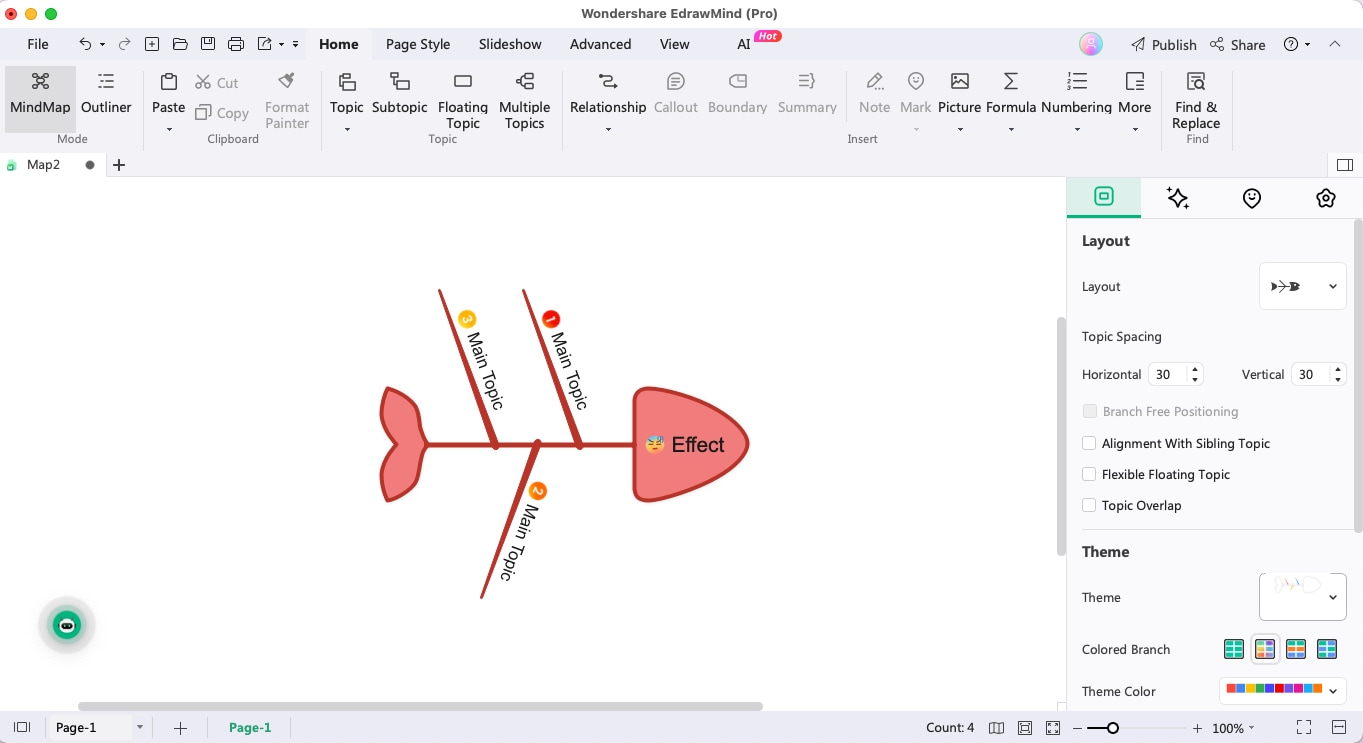
Step 5: Add Components
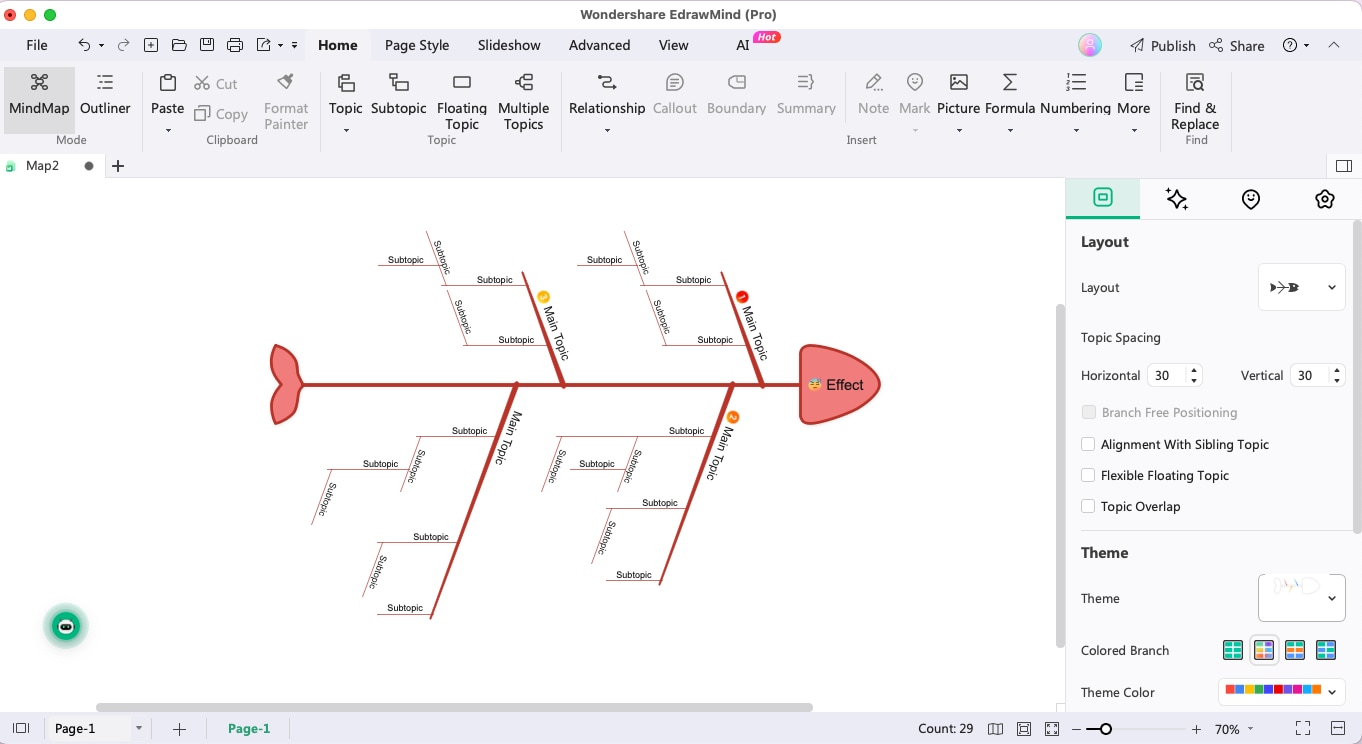
Start the diagramming by adding different key categories of causes, and if your team finds more sub-clauses, simply press 'tab' on your keyboard to add the subtopic.
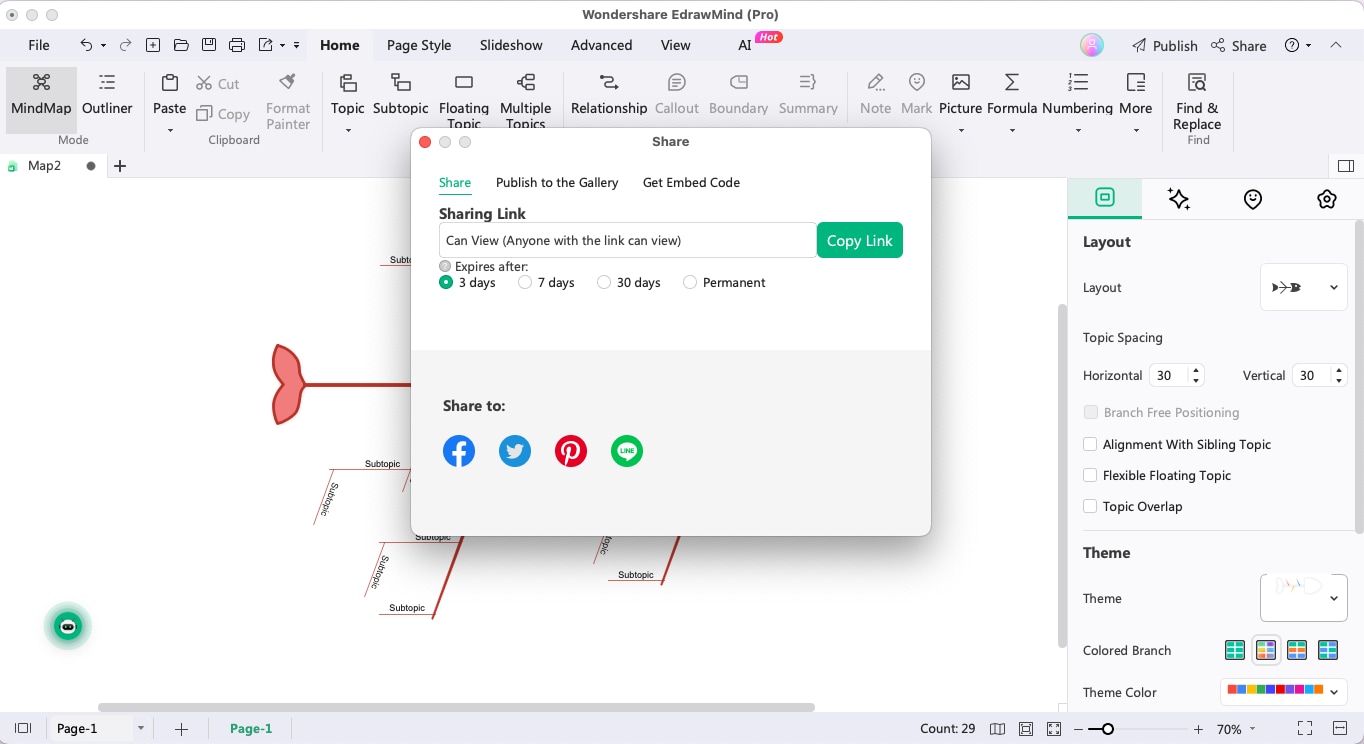
Step 6: Export & Share
Once you have identified the root cause of the problem, head to the 'Export' option and export the cause-and-effect diagram into different formats. You can even click on the 'Share' option from the canvas to share the diagram on different platforms.
Fishbone Graphic Organizer Example
To understand how to make a fishbone graphic organizer in detail, let us present you with an example. The following fishbone graphic organizer template created in EdrawMind is fully customizable.
As you can see from the following image, we have a graphic organizer diagram that looks like a fish. We have a head, a spine, and a tail. The spine here has spread across multiple branches, denoting the full skeleton of the fish. When you start working on an Ishikawa fishbone diagram, start by adding content to the fish's head -- this is the area where you are going to mention the 'Effect'.

 below.
  below.
 Now, you will use EdrawMind's customization option to add the content to the fish's skeleton. Select any of the blank topics (as mentioned in the above image) and start adding the content to them. Depending on the relationship between the 'Effect' and the 'Causes', you can start adding the sub-causes as well.

Free Fishbone Diagram Maker

As you can see from the mentioned fishbone graphic organizer example, Wondershare EdrawMind is one free fishbone diagram maker tool that helps create detailed diagrams and helps the teams brainstorm on different verticals easily.
Some of the features of this free fishbone diagram maker are:
- Layout: Once you have designed the fishbone diagram, you can easily change the layout using the built-in options.
- Edraw AI: This free fishbone diagram software now comes with built-in AI that helps in generating texts.
- Infinity Canvas: EdrawMind is built on vector, and it provides an infinite diagramming canvas, enabling you to make the Ishikawa diagram as large as you want.
- Built-in Templates: EdrawMind comes with a MindMap Gallery where our users have published their diagrams. You can easily take inspiration from these built-in templates.
- Boundary & Callout: While making the fishbone diagram, you can easily add boundaries to a particular section and also add a 'Callout' to add certain comments.
Conclusion
Fishbone graphic organizers serve as a dynamic tool for problem-solving. By visually mapping out potential causes and analyzing their interrelationships, Ishikawa diagrams or cause-and-effect diagrams offer a structured and data-driven approach that helps empower the organization to garner productivity and innovation. You can use EdrawMind and avail the benefit of free fishbone diagram templates to start your brainstorming sessions. EdrawMind also offers an instant presentation option, allowing you to create a slideshow of your Ishikawa fishbone diagrams.
FAQ
-
1.What are the limitations of using a Fishbone Diagram?
While Fishbone Diagrams are powerful tools, they do have limitations, like it oversimplifies the issues, solutions are subjective, and need a lot of time and resources. -
2. What are the main components of a Fishbone Diagram?
The main components of a Fishbone Diagram include problem or effect, categories, potential causes, sub-causes, cause-effect relationships, and root causes.
