


Concept mapping encourages the human brain to think critically, solve problems, and collaborate. These diagramming tools promote knowledge retention, organize information logically, and prevent factual errors. Concept maps are widely used in scientific research and educational concepts, and phase changes are no different.
Phase change concept maps visually depict the physical substance conversions from one stage to another under varying energies and pressures. Most educators and researchers leverage these concept maps to make presentations, take notes, and analyze their characteristics.
This article explores the benefits and examples of phase change maps. It also shows how to make a phase change diagram in minutes using EdrawMind.
In this article
What is Phase Change Concept Map
The term Phase depicts the matter form, i.e., solid, liquid, gas, and plasma. Thus, the transition of matter from one form to another is called phase change. This conversion occurs during energy gains and losses. Heat added to a substance changes solid into liquid and gas, and vice versa.
For instance, heat going into H2O changes it from ice to water and gas. In some cases, the solid gains enormous energy by skipping the liquid phase and directly transforming into a gas. Moreover, note that phase transition is always physical despite the substance having distinct chemical characteristics.
That said, the substance’s chemical and physical characteristics influence the system’s pressure, affecting the process. To illustrate, it is a misconception that water always melts from ice to liquid at 0 degrees Celcius. In reality, the pressure during heat transfer affects the transition. So, a pressure decrease shows a decrease in its melting point.
Types of Phase Change
There are eight thermal processes through which phase change occurs.
- Freezing: liquid to solid
- Vaporization: liquid to gas
- Melting: solid to liquid
- Condensation: gas to liquid
- Sublimation: liquid to gas
- Ionization: gas to plasma or ionized particles
- Deposition: gas to solid, skipping the liquid phase
- Recombination: plasma to gas
Benefits and Applications of Phase Change Concept Map
Phase change concept maps are a handy tool to facilitate education needs. Here is what makes them stand out among other visual diagrams.
Benefits
Aside from visual agency, phase change concept mapping has numerous benefits. Here is a list of some of them.
- Phase change maps have labeled relationships. These linking words represent the factors that affect heat transfer and physical changes during matter conversions.
- These maps have different colors to differentiate categories, making them easily understandable.
- Concept maps follow a top-down hierarchy. Thus, grasping the phase conversion facts is easier.
- Phase change maps are great presentation tools. They organize data in a simpler form for viewers to comprehend easily.
Applications
Phase change concept maps are used across industries for research and education purposes. Let us see who uses these diagrams in their daily life.
- Students use phase transition maps to understand and visualize the interconnected processes and heat transfer during these processes.
- Educators leverage these visual maps for presentations and lectures.
- Phase change maps are excellent note-taking tools. They can store facts and logical information.
- Researchers use complex phase conversion concept maps to evaluate and analyze the factors influencing these changes and identify new developments.
How to Create a Phase Change Concept Map?
Do you have a presentation tomorrow and need a fast way to make a concept map? Try using EdrawMind. It is an exclusive mind-mapping tool where building relationships, adding topics, and using ready-made templates is intuitive. Here is how you can build a phase change concept map in seconds.
- Before that, download the EdrawMind desktop > Log into your Wondershare account. Or log in using your social media ID.
Method 1: Using Phase Change Templates
The easiest way to make a phase change concept map is through templates. Here is how you can do it.
Step 1: Select a Template
Go to Mind Map Gallery from EdrawMind’s main menu and type Phase Change Concept Map in the search box. Find a suitable template and click Duplicate.

Step 2: Add Details
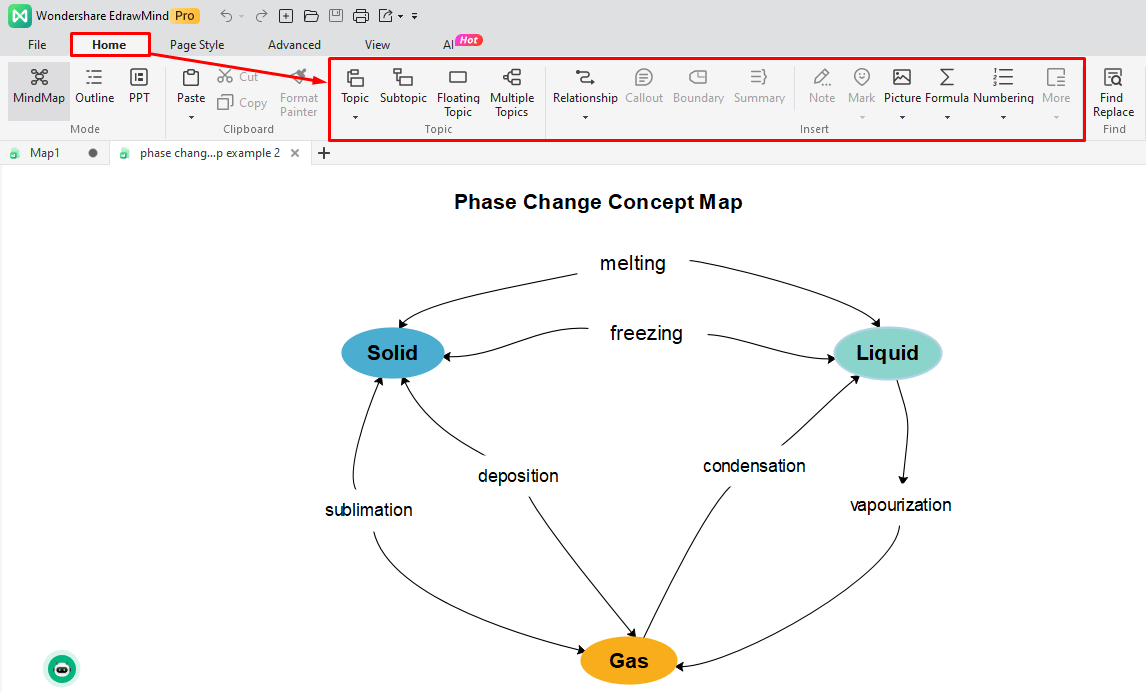
Go to the Home tab on the top to add and remove topics and subtopics. Make new relationships and layout of the map.
Step 3: Customize Formatting
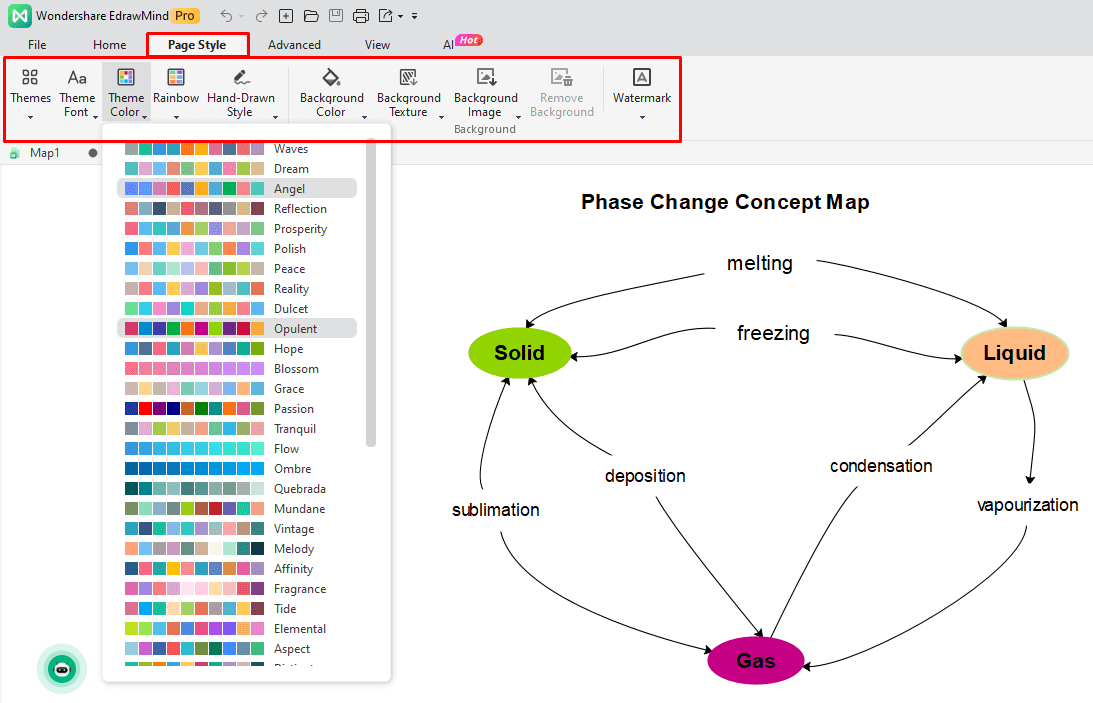
Once satisfied with the map, go to the Page Style bar and change the formatting. Modify the color scheme, theme, and size of the map.
Method 2: From Scratch
Here is how you can make a concept map from scratch.
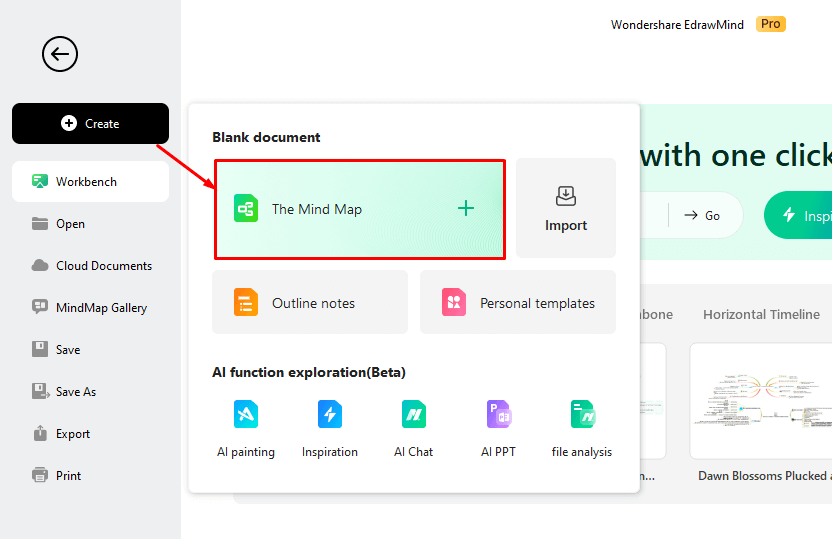
Step 1: Open Concept Map
First, think about the reference idea of your map, which is Phase Change. Once decided, click Create > Mind Map from the main menu.
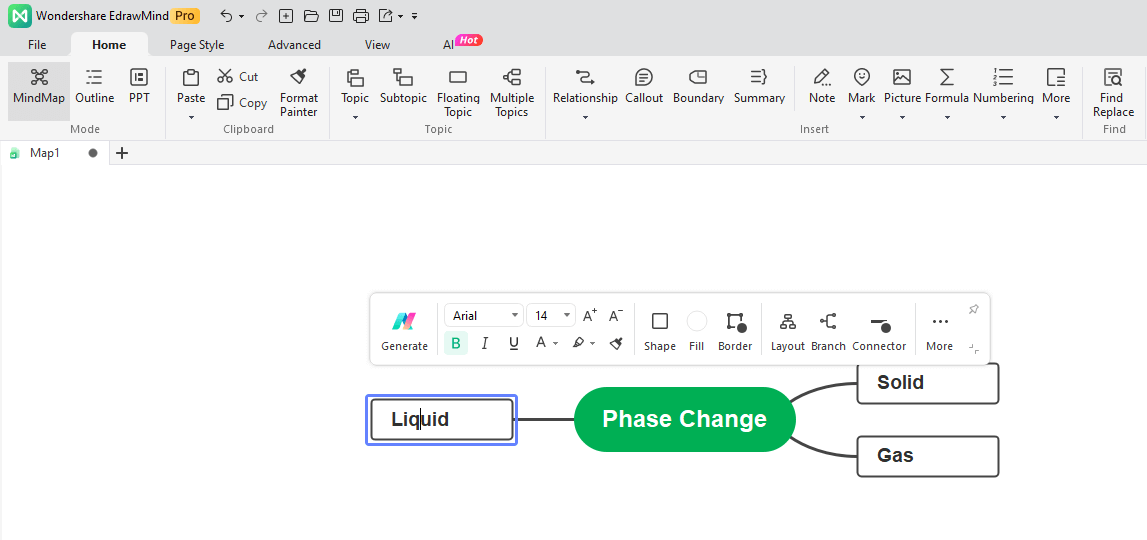
Step 2: Add Branches
On the editing panel, start building key ideas around the reference point. Let us make three branches: Solid, Liquid, and Gas. Go to the Home bar on the top and add Topics.
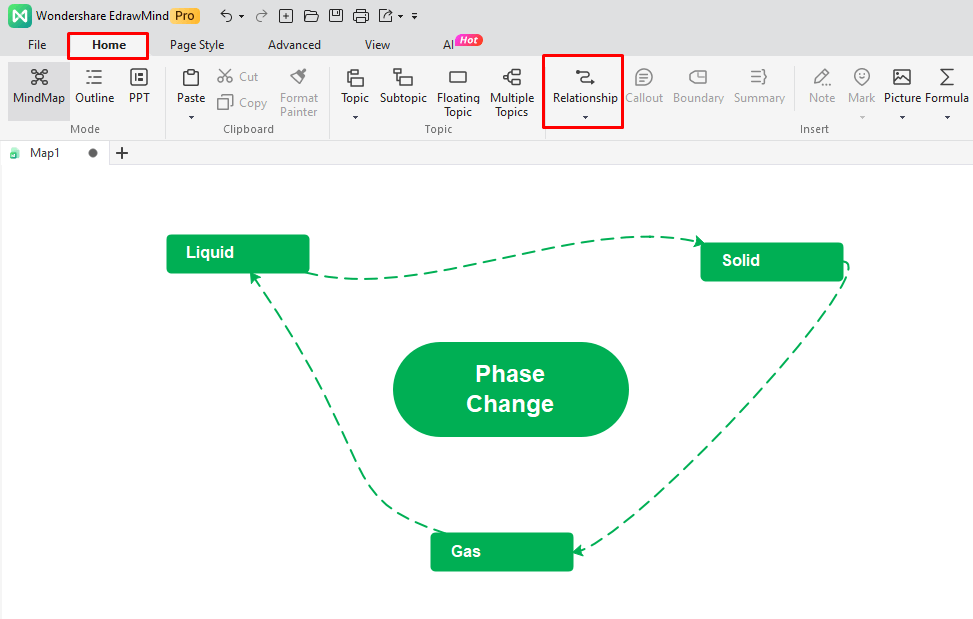
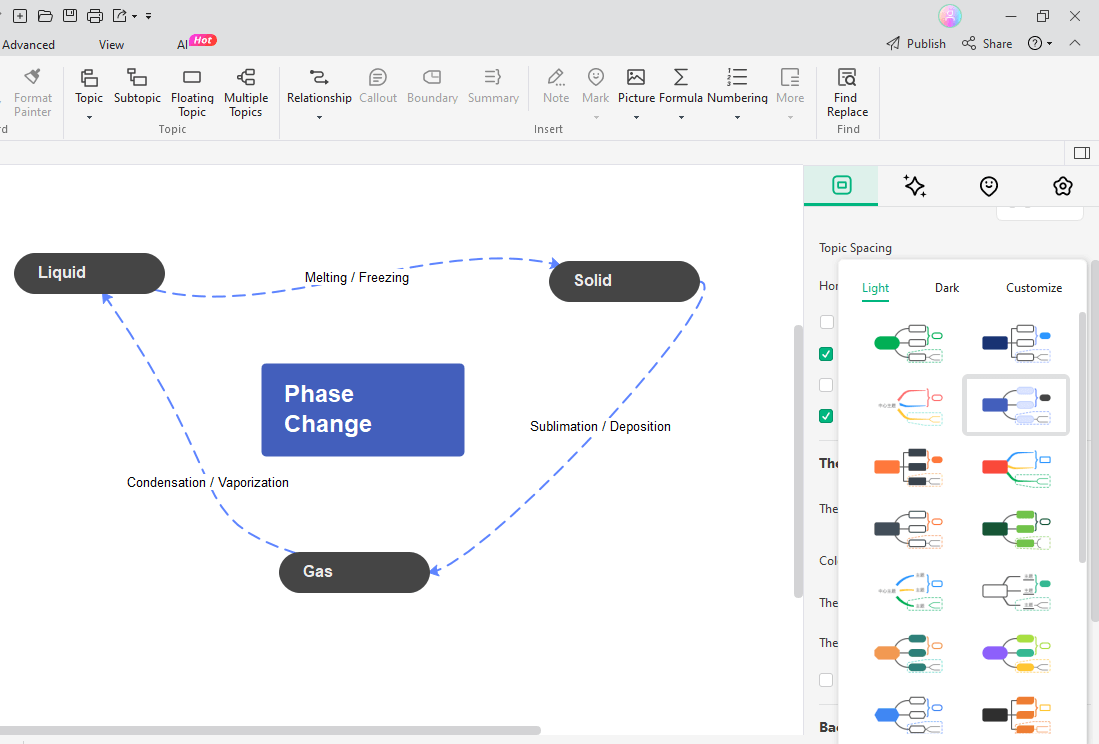
Step 3: Build Connections
It is time to add straight lines for relationships between the elements of the map. Go to the Home tab on the top and click Relationship. Drag and connect lines in whatever direction you want.
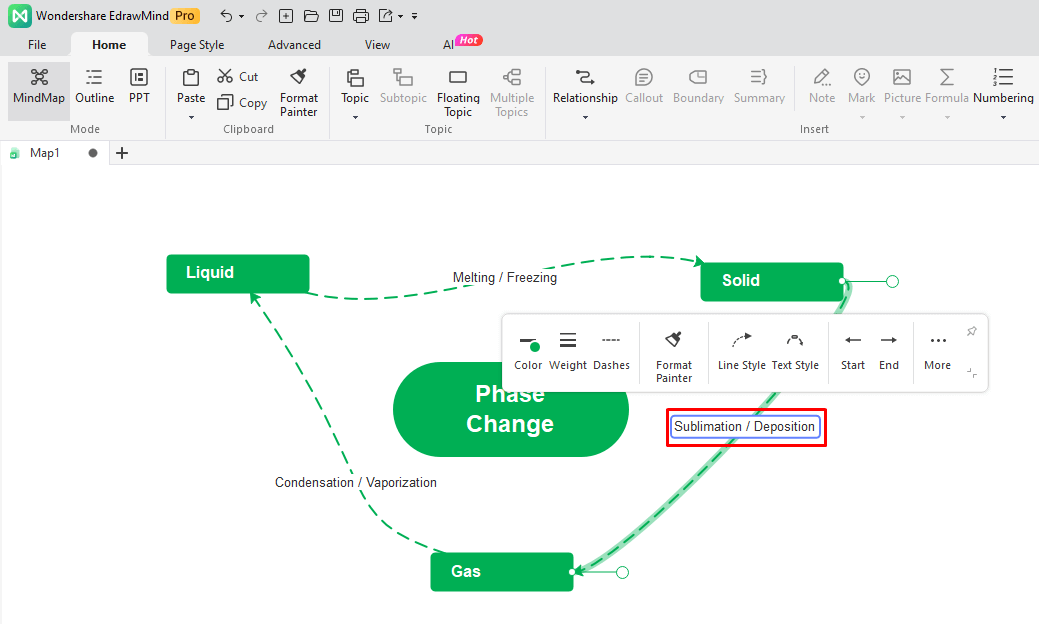
In between the lines, add transition words to describe the conversions. For instance, write Deposition between solid and gas or Melting between solid and liquid. You can do this by double-clicking the connector line and adding labels.
Step 4: Add Finishes
Congratulations, the phase change concept map is done. But it can do better with visual effects. Adjust your map's color scheme, layout, and theme from the right-side information panel. You can also do the same from the Page Style bar.
Phase Change Concept Map Templates
Phase changes are best explained through concept maps. Let us discuss some of the best from the EdrawMind Mind Map gallery.
1. Phase Change Example
 below.
  below.
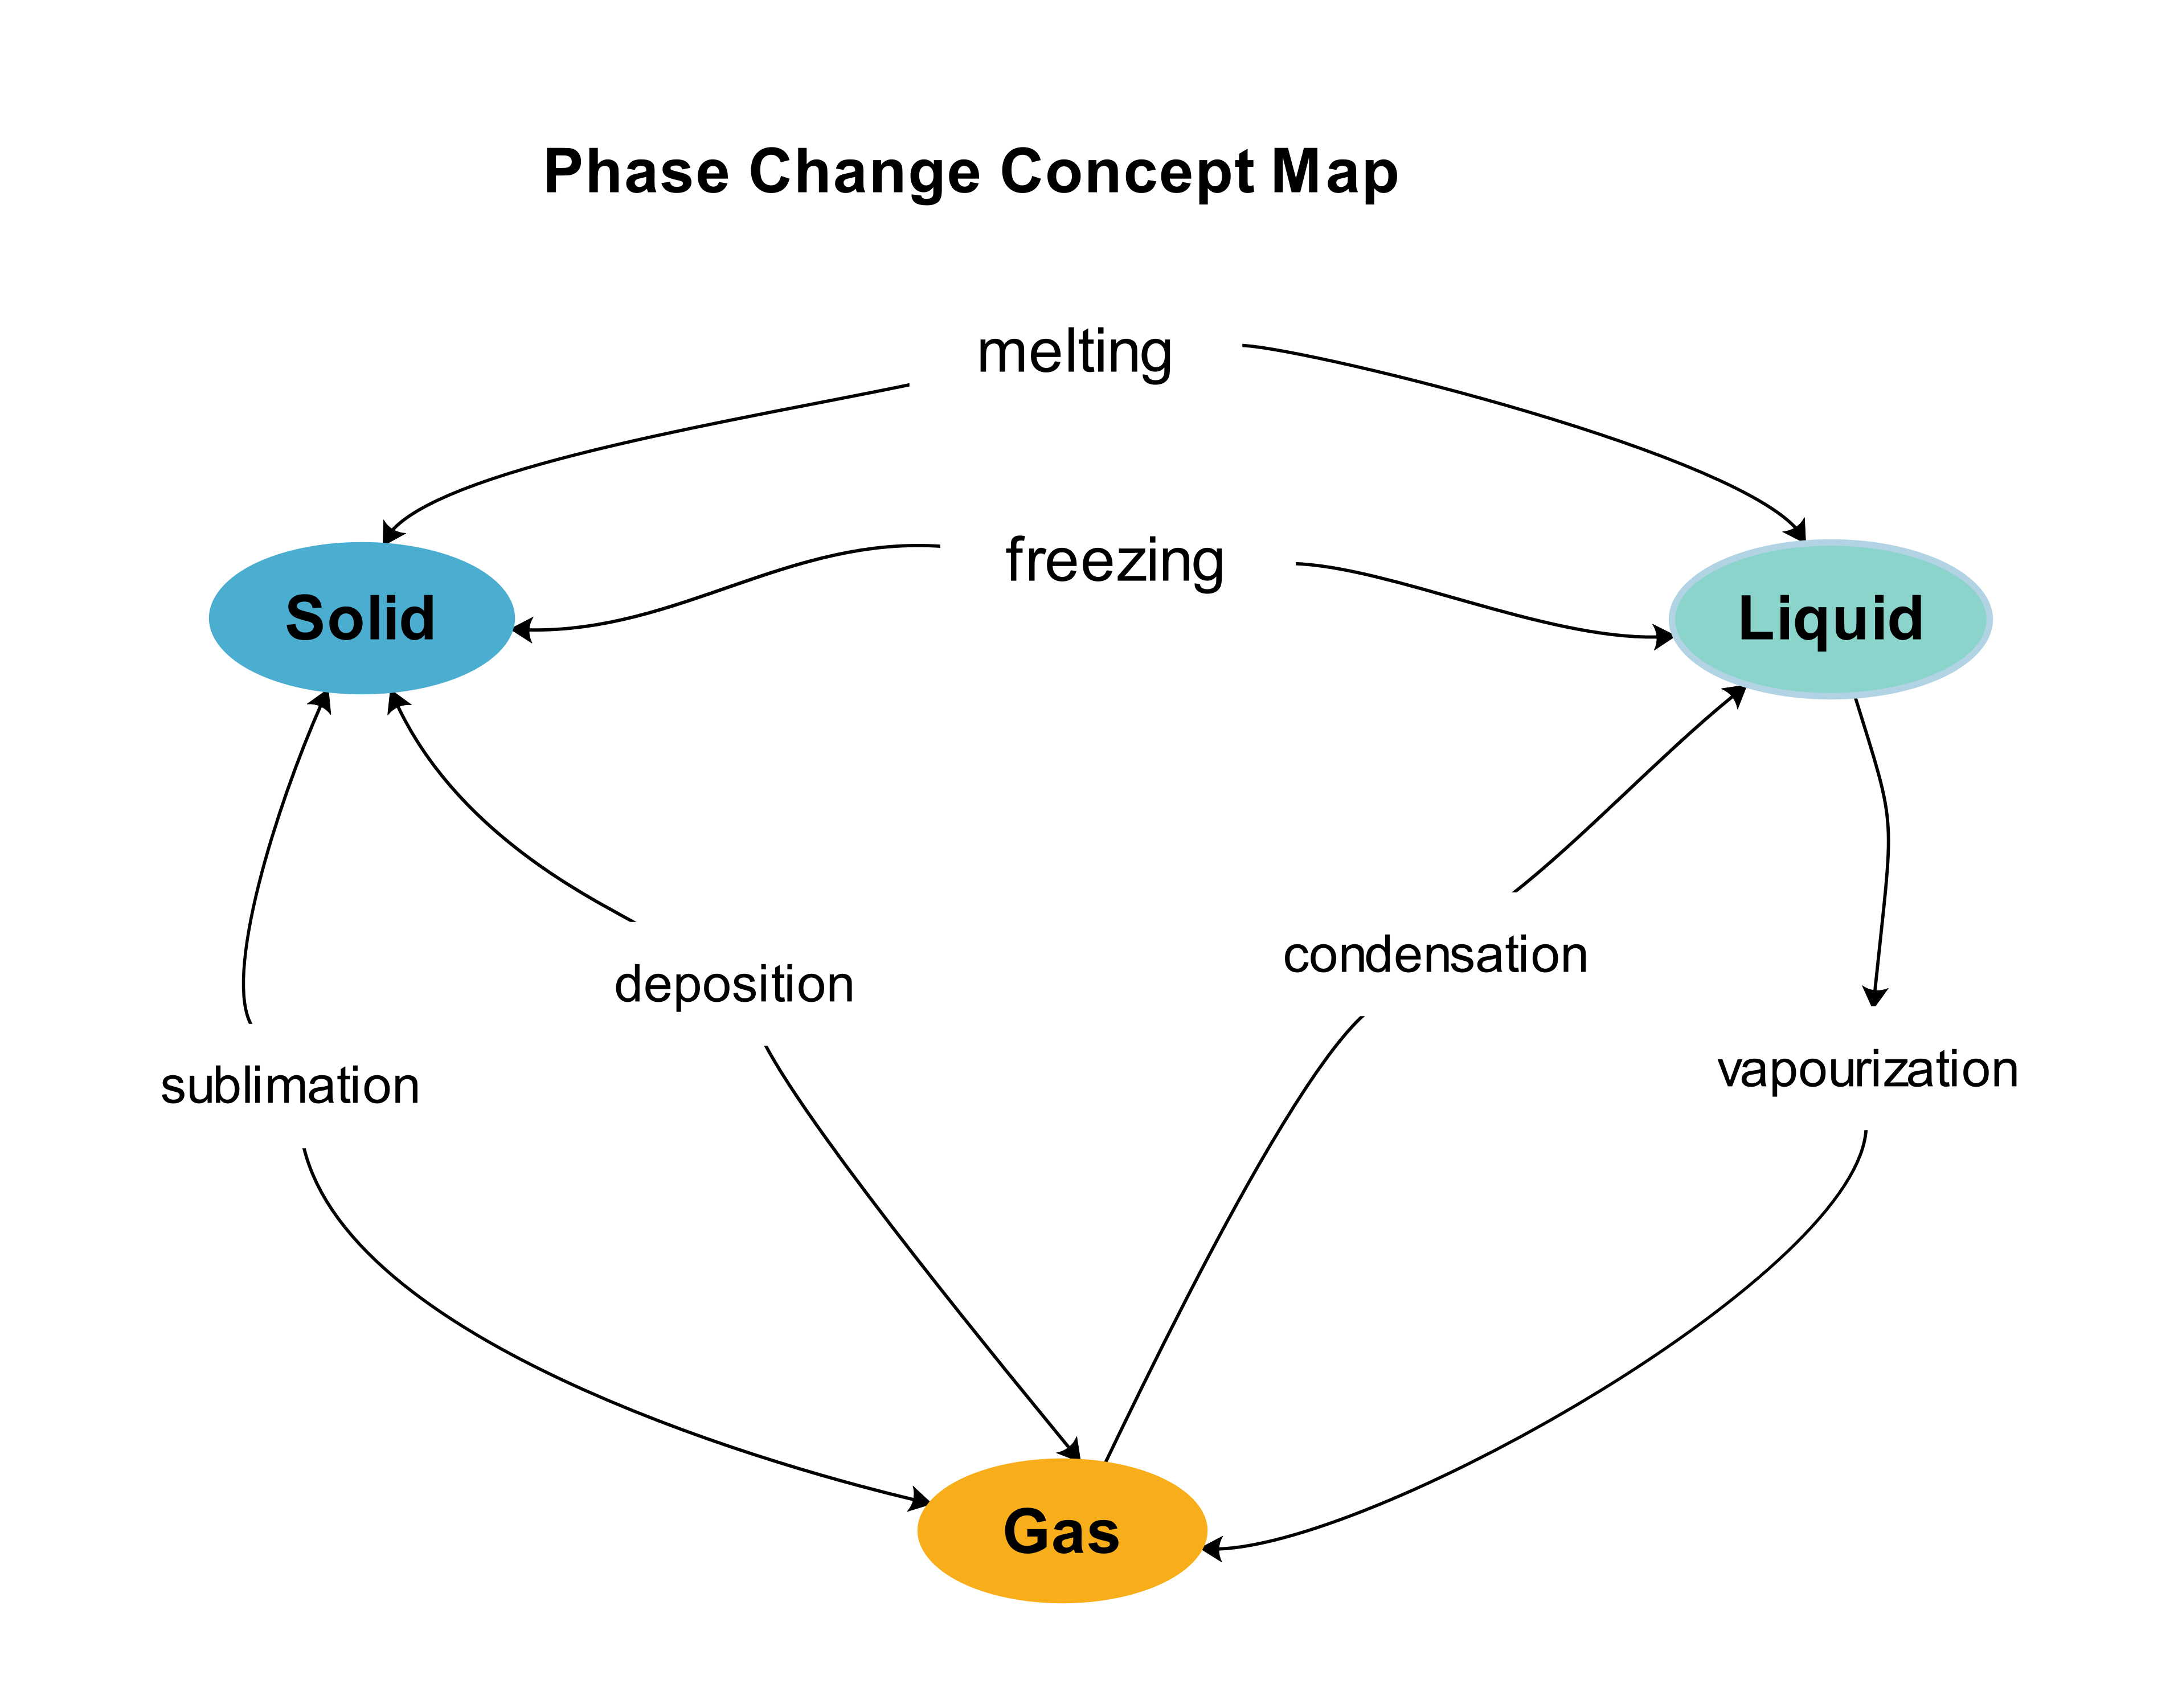
 This phase change concept map depicts the phase transition process and factors affecting these changes. It uses a simpler approach and keywords to identify the conversions. The creator has used arrows for relationships between the matter states and their associated changes.
At first sight, the diagram has ovals to represent three states: solid, liquid, and gas. In between, there are arrows labeled with transition words, like sublimation, deposition, vaporization, and condensation. Hence, it is easier for anyone to identify the nature of the process.
2. Phase Transition Map
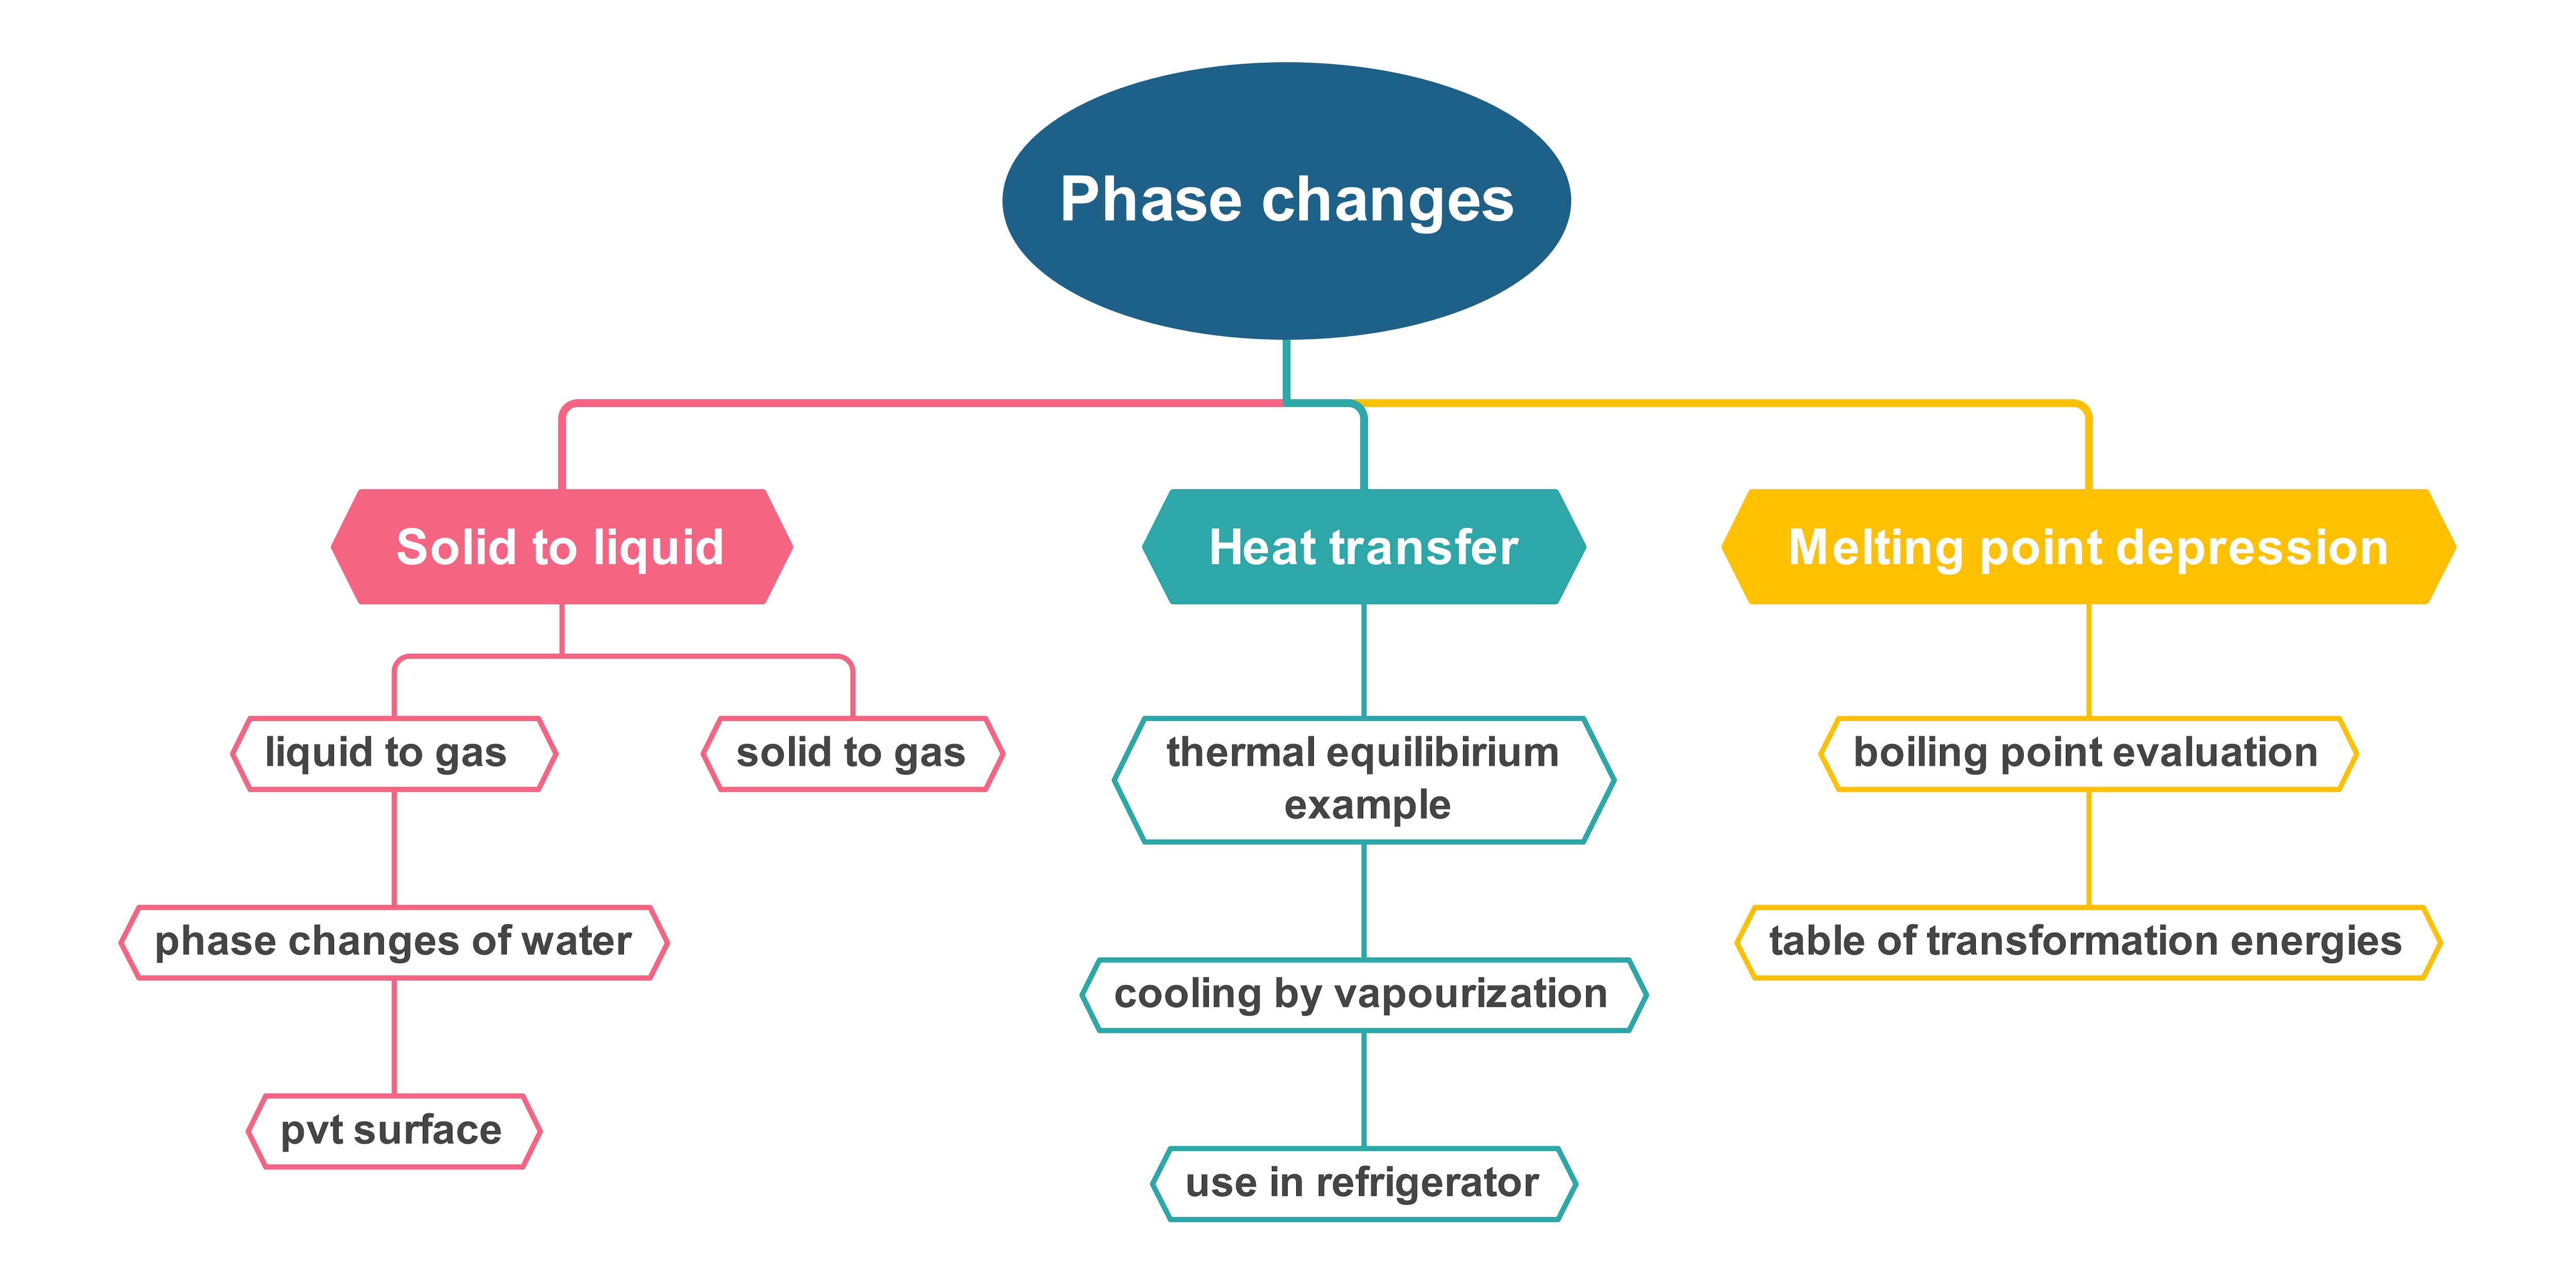
This phase change example illustrates a general understanding of phase transition processes. The concept map has three divisions: solid-to-liquid, heat transfer, and melting point depression. In addition, it uses sub-branches to elaborate the sub-processes and physical conversions during each process.
It leverages a straightforward mind map approach to depict the hierarchy of the process. The diagram starts with “Phase Change” on the top and extends toward the changes. The creator has used multiple colors to differentiate the processes. Also, the one-to-one relationships from top to bottom establish an easy flow for viewers.
3. State of Matter Concept Map
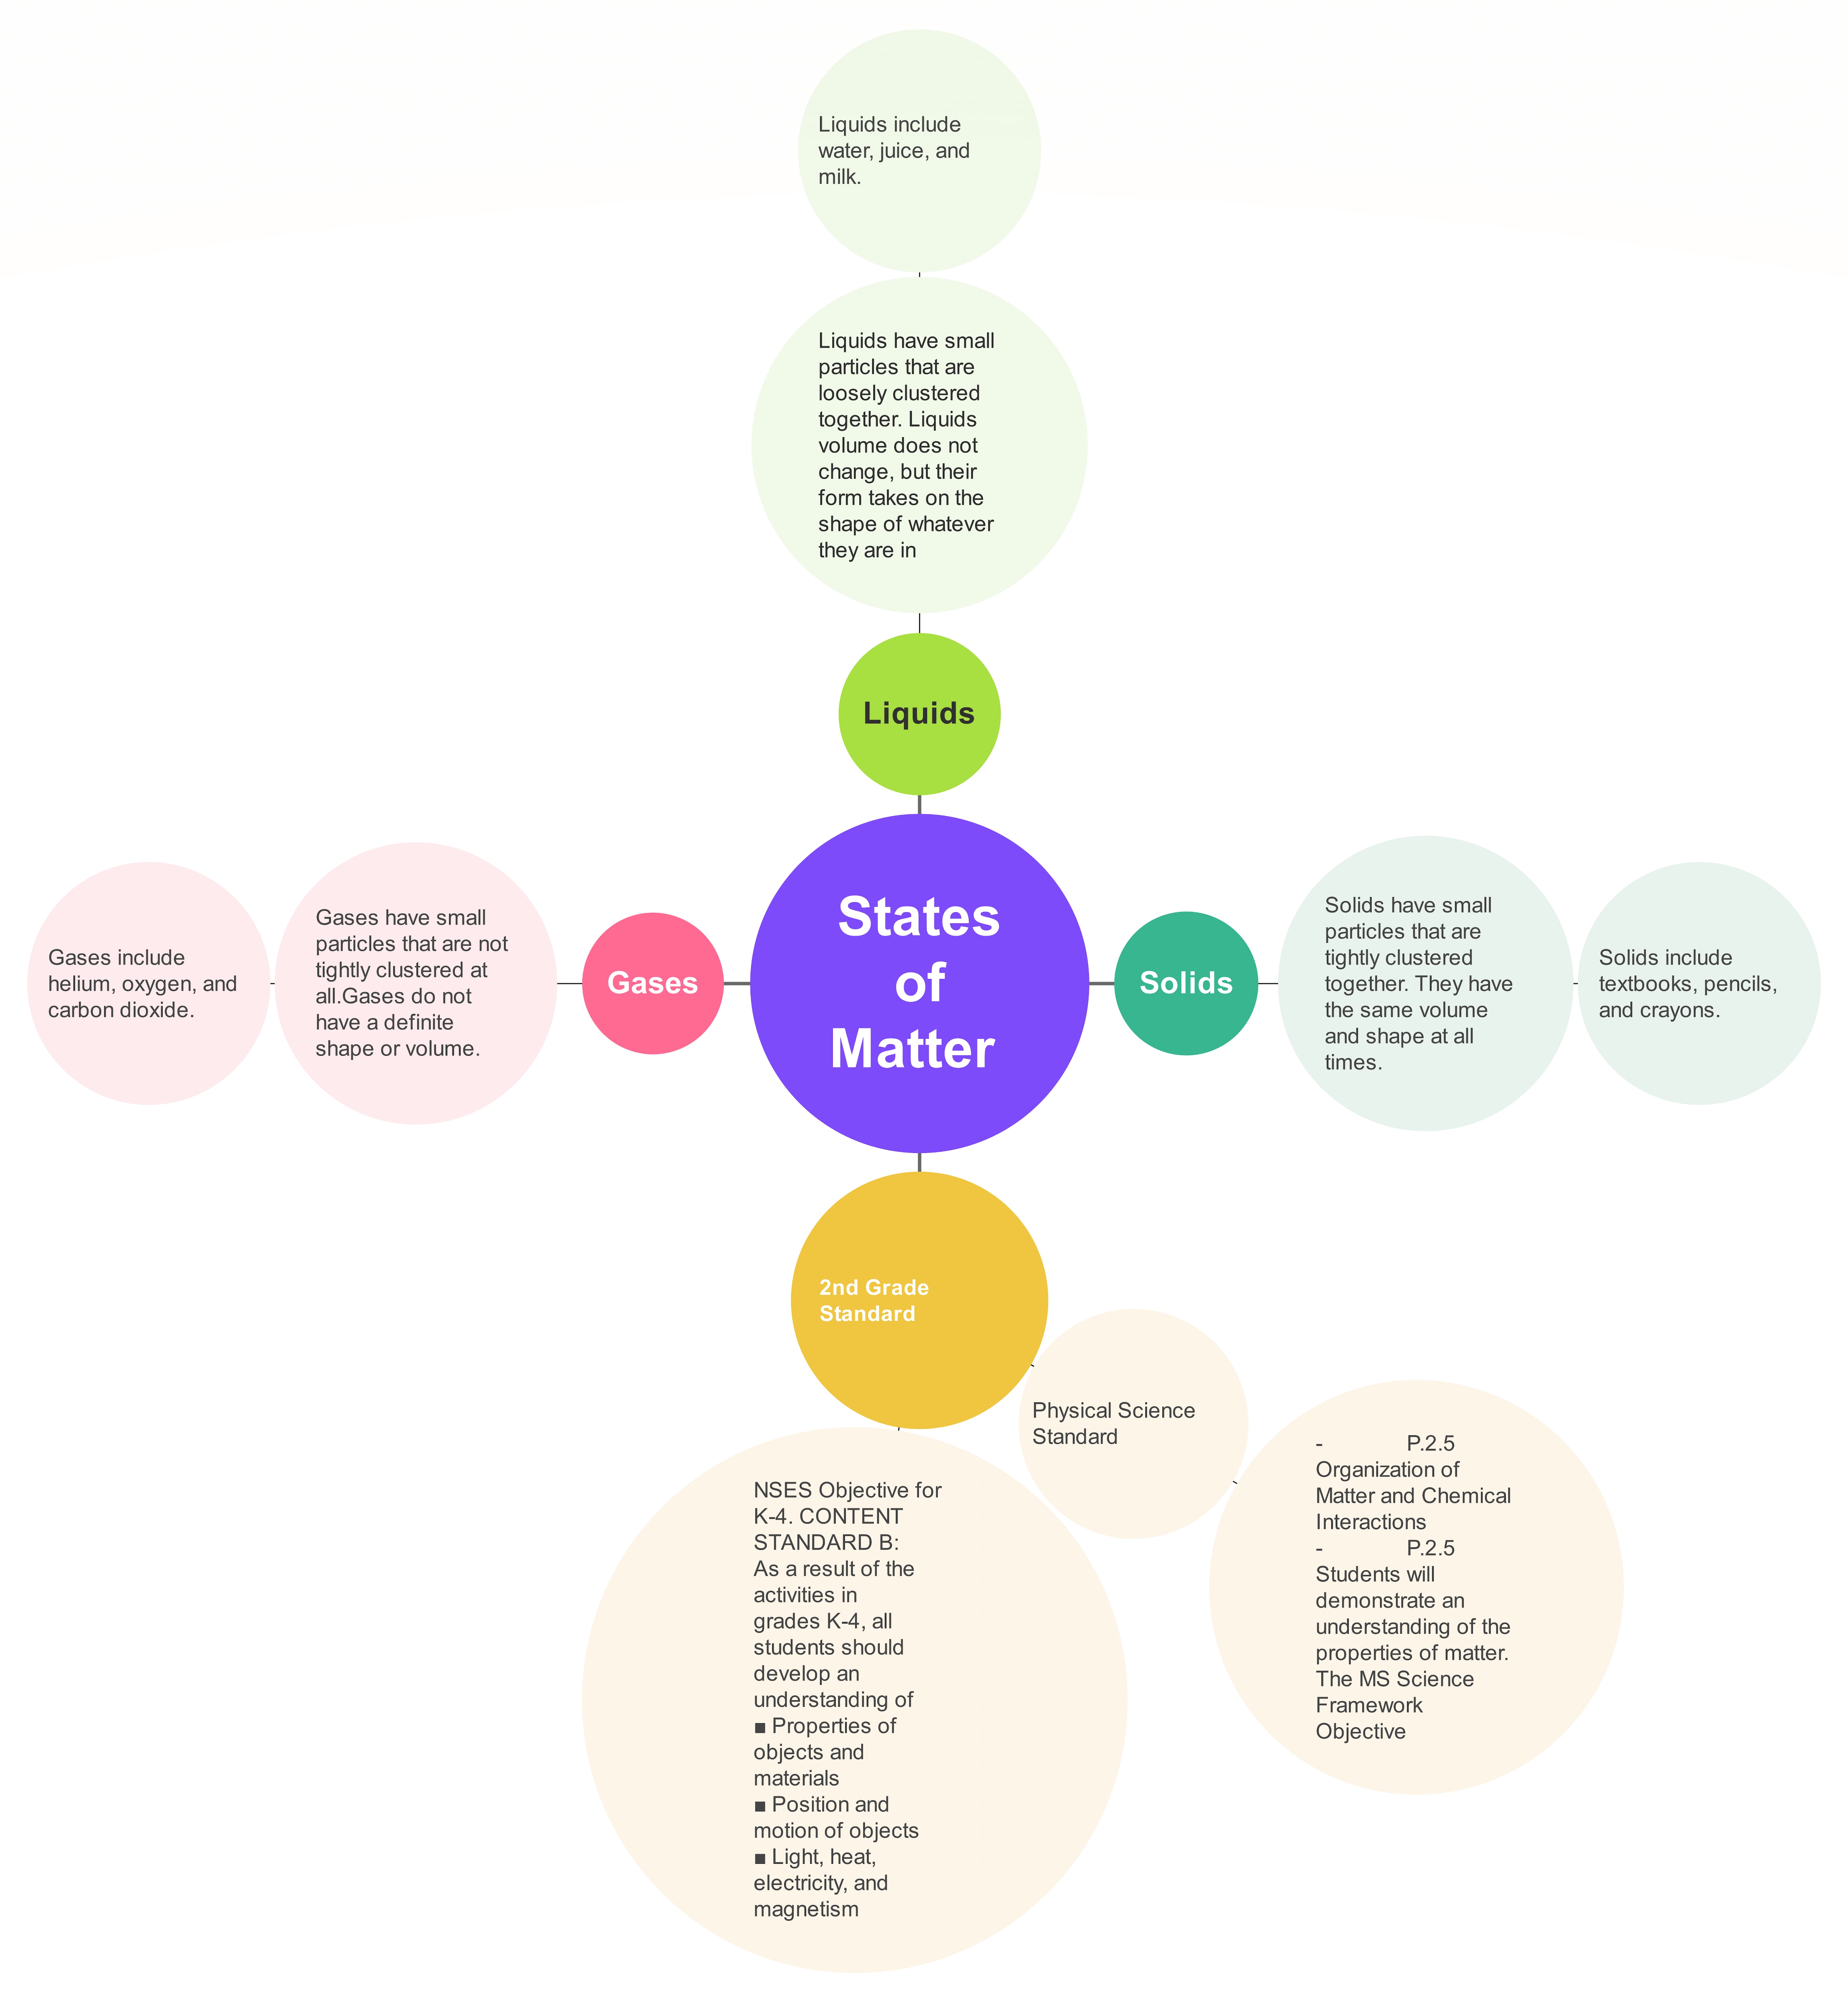
This concept map example depicts the nature of the three matter states: solid, liquid, and gas. It showcases their character and chemical composition, essential for a foundation in phase change. This map uses a spider map-like approach to differentiate between categories.
The center circle in green represents the reference point, the State of Matter, extending into three small circles for each state of matter. In addition, each circle has straight lines going to sub-circles. These sub-circles describe the characteristics of solid, liquid, and gas. The creator has used phrases, leaving no need for further research.
?Have more CONCEPT MAP TEMPLATE to improve efficiency and enhance visual effects.
Conclusion
Concept mapping is a kickstarter for understanding scientific concepts like phase changes. Educators utilize phase change concept maps to evaluate their character, understand the process hierarchy, and grasp the factual basis in minutes. However, making them from scratch means spending a lot of time in front of the screen.
What’s better is to get your hands on pre-made concept maps. EdrawMind has a massive mind map gallery with several phase transition concept maps. Its easy interface and concept map-specific toolkit give it an edge over other mind-mapping tools. Check this out, and it may help you with your studies.
