Suppose you are organizing a community health intervention. And your task is to distribute resources to different neighborhoods. You would go for the most effective way to illustrate these datasets. Won't you? Bubble Map outperforms all the other word clouds by a long shot. The size and color of the bubble correspond to certain indicator values.
Different bubble map examples help to understand how these maps are crucial in decision-making. Below are some bubble map samples that may help organize how your visual analysis shapes and that no detail escapes your scrutiny. Now, let’s learn how bubble maps enhance the possibility of making decisions.
In this article
What is a Bubble Map?
A bubble map is a graphic display of information wherein circles or bubbles represent pieces of data or categories. The relative size of circles also denotes a particular value, quantity, or frequency about other values. Therefore, the size helps distinguish different circles.
Bubbles represent various relationships. For example, if you want to represent similar data then you create bubbles closely linked to each other. Bubble maps are specifically effective in showing proportions, distribution, and relationships where data is complex. This can easily be interpreted when displayed in the form of bubbles.
Bubble maps assist in marketing, geography, and business organization. They enable one to find patterns and tendencies that cannot be described in any other way. They use an open and unbiased approach when presenting data. They help where the size of categories is relevant to the study.
12 Bubble Map Examples
Bubble maps present a fresh point of view for data comprehension. Moreover, first-time users of this concept will find it useful to look at the different samples. It includes the double bubble map example and the story bubble maps.
We will provide 12 different examples to enable you to follow their practical application. Moreover, we will explain how they may be tailored to serve various informational purposes. So let's dive deeper into these templates and find out their possibilities.
1. Roisin Carey Bubble Map
The main idea of this bubble map is to plan a vacation. It has one big bubble asking ‘Where to Holiday?’. Other bubbles around point out different aspects of holidays. It is a handy tool for organizing holidays. This helps in arriving at a decision and planning for other details regarding the trip.
2. Kingdom Animali Bubble Map
This bubble map enables learners to gain insights into the Kingdom Animalia classification. It categorizes different animal bodies according to a much-defined structure. The central bubbles hold various classes. This example is beneficial for serving educational purposes. It assists students to see relationships and rankings within the animal kingdom. It is a fruitful example to make detailed scientific reports.
3. Cell Cycle Bubble Map
This bubble map describes the cycle of the cell. Some of the significant processes are Interphase, Mitosis, and Cytokinesis. Cell Cycle Concept bubble is in the middle of the map. This map uses a flow chart and is extremely useful for students to visualize the sequence of cellular reproduction. It is beneficial to be used in a biology class or even as study material.
4. Materi Narrative Text Bubble Map
This bubble map breaks down the analysis of narrative texts. The aspects are divided into lexicogrammatical characteristics, social uses, and generic patterns. It defines relationships between the narrative components. This educational tool is unmatchable when it comes to storytelling and textual analysis. This way it becomes easier to realize the roles in the narrative and their impact on the story.
5. Agenda Web Org Grammar Exercise Bubble Map
The bubble allows you to grasp English grammar concepts. It teaches how to implement verbs, adjectives, and other forms. Clients can understand the connection between "the comparative frame" and "superlative descriptive words". It is a fun instrument for students to take language structure rules and work out together. It assists in clarifying confusion between various grammar structures.
6. Invertebrate Bubble Map
This bubble map displays different invertebrate groups like Arthropoda, Mollusca, and Annelida. This map visualizes numerous invertebrate species. Moreover, it depicts links between various categories. This bubble map is fruitful for teachers and students. Users can skip complex biological classifications if they study this bubble map.
7. Sociolinguistics Bubble Map
This bubble map examines the area of sociolinguistics. The map helps us understand the interconnection between languages and society. It includes lexicons like ‘Linguistic Choice’ and ‘Social Dimensions’ and themes pertaining to them. The focus is on the reasons and the methods of variation in speech in different social situations. This map can help understand various linguistic interrelations.
8. Global Issues Bubble Map
This bubble map illustrates the major global issues such as Health, Education, Economy, and Politics. Each area shows the links among various elements of global challenges. This map is important for discussion and for teaching purposes. It demonstrates the interrelation of different global issues more clearly.
9. Psychosocial Risk Bubble Map
This bubble diagram explains the different dimensions of psychosocial risk. At the core, is Le Risque Psycho-Social. It radiates out to related dimensions which include the work environment, recruitment process, and institutional assessment. It focuses on the core problems that disturb the employees' mental health. It is effective for organization assessments and advocacy of mental health issues.
10. Energy Forms Bubble Map
The bubble map illustrates various types of energy including Thermal, Mechanical, and Nuclear. Each of them is connected to the center bubble 'Nhan_IT (IPSV)'. It aids in the connection of multiple energies. This type of map assists in visualization when explaining difficult physical concepts. It allows students to understand energy forms diversity and their use rather effectively.
11. Cancel Language Bubble Map
This bubble map deals with “Cancel Language.” It relates peoples’ names, the media, and their political orientation to the center. Besides, it shows the role that a variety of factors play in the public sphere and within society as a whole. This map is practical when it comes to exploring and explaining language usage in social relations.
12. Ministry of Health and Family Welfare Bubble Map
The bubble figure depicts a certain process undertaken by the Ministry of Health and Family Welfare. It also explains the targets of these projects. This map seeks to highlight the extent and relationships among the several public health policies. These are developed for the advancement of public health systems and services.
Make Your Bubble Map Now
We’ve explored a variety of bubble map examples that had been prepared for clarifying concepts, controlling projects, and defining a course of action. So, what is to be done next?
It will not be enough that you explore bubble maps until you convert the plans to action. To achieve something tangible, you should first design a custom bubble map that fits your needs. In this case, you might think to use a pencil and paper or some simple software, but these methods are pretty ineffective during the active brainstorming process.
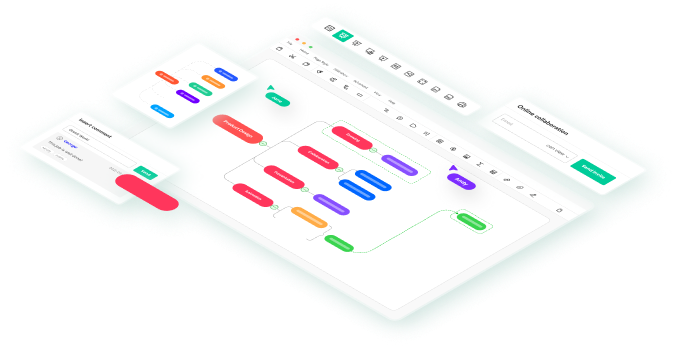
Introducing EdrawMind – a versatile software with excellent bubble mapping capabilities that elevates your planning to a whole new level. EdrawMind is one such product that makes sure that no brainstorm is left unutilized due to its simple yet efficient features.
Free registration at EdrawMind allows you to use bubble mapping tools so that you can realize your dreams and ambitions. Wish you could see those items now, instead of just imagining. Take action today and watch your ideas shape in a way you’ve never imagined.


 below.
  below.


