


A fishbone or Ishikawa diagram offers a visual illustration of a problem's cause-and-effect relationship. In this technique, teams brainstorm and identify the problem, its causes, and contributing factors following a fish-like structure. It is a popular problem-solving mind-mapping method that helps improve the system's efficiency and avoid bottlenecks during development.
However, creating it is a real pain, especially when you are working in a team. Most offices prefer making a fishbone diagram in Excel for its simple interface, confidentiality, and established comfort level with the tool.
So, here is a complete guide on how to make a fishbone diagram in Excel for anyone stepping into professional life.
In this article
Part 1: How to Make a Fishbone Diagram in Excel
Most people working in office setups are familiar with MS Excel, given that it is a prerequisite for most jobs. Companies use Excel to make charts, graphs, stacked graphs, fishbone diagrams, analyze data, and more.
However, if you are new to this tool and wondering how to make a fishbone diagram in Excel, Follow these steps.
Step 1: Prepare the Diagram
Before you start, arrange a brainstorming session and lay out a process map on a whiteboard. Note down the problem statement and identify its causes and the contributing factors. Once done, download Microsoft Excel, and you are ready to make a fishbone diagram.
Step 2: Create an Outline
Launch Excel and press New from the dashboard to start working on a blank document.

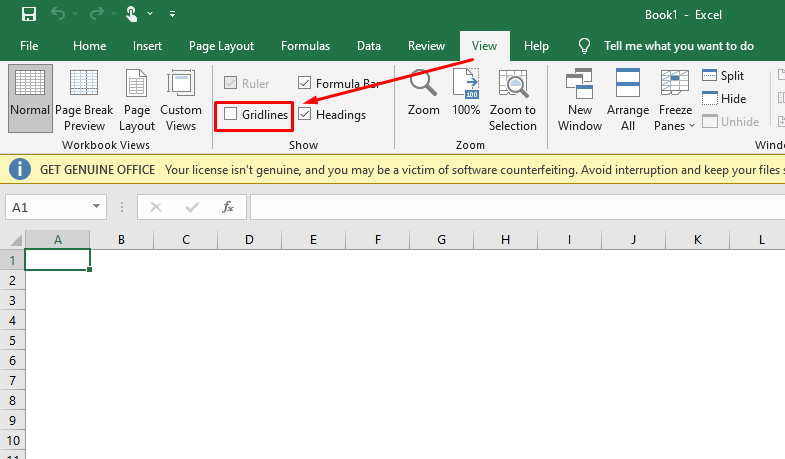
When the editing panel opens, remove the gridlines by clicking View > Uncheck Gridlines from the top toolbar. Doing this will create a blank canvas where it is convenient to draw and place shapes. Now, you can proceed to build the outline.
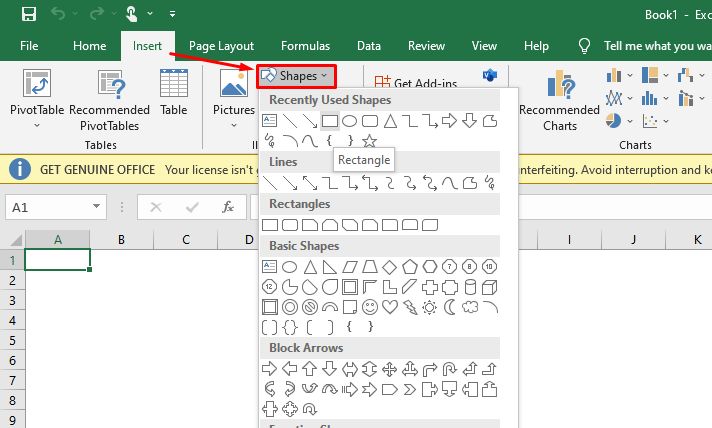
Unfortunately, Excel has no pre-built fishbone diagram templates. So, you will have to rely on your creativity. A good way is to search for inspiration on the internet. Once you have a mock design, add shapes by clicking Insert > Shapes > Your Preferred Shapes. For this diagram, let us use rectangles.
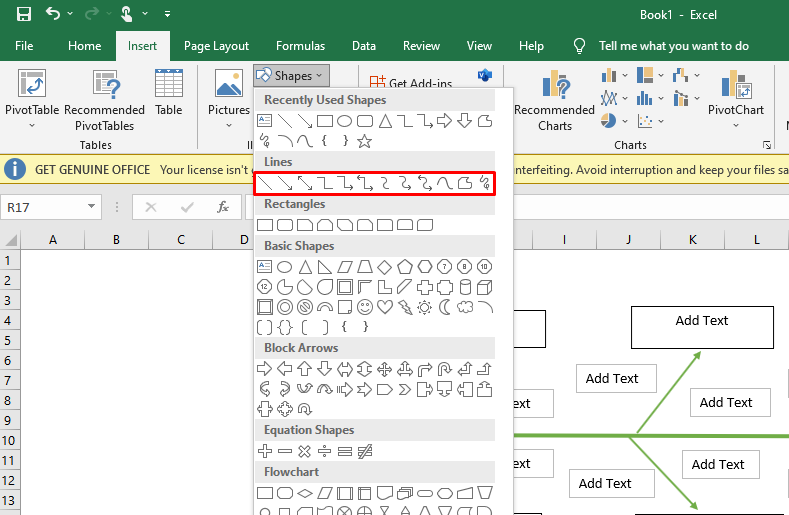
Now that you have added rectangles for the problem statement and its causes, it is time to connect them to the fish spine. Arrows are best for this task. So, go to Insert > Shapes > Your Favorite Arrow, and connect the rectangles.
Step 3: Edit the Data
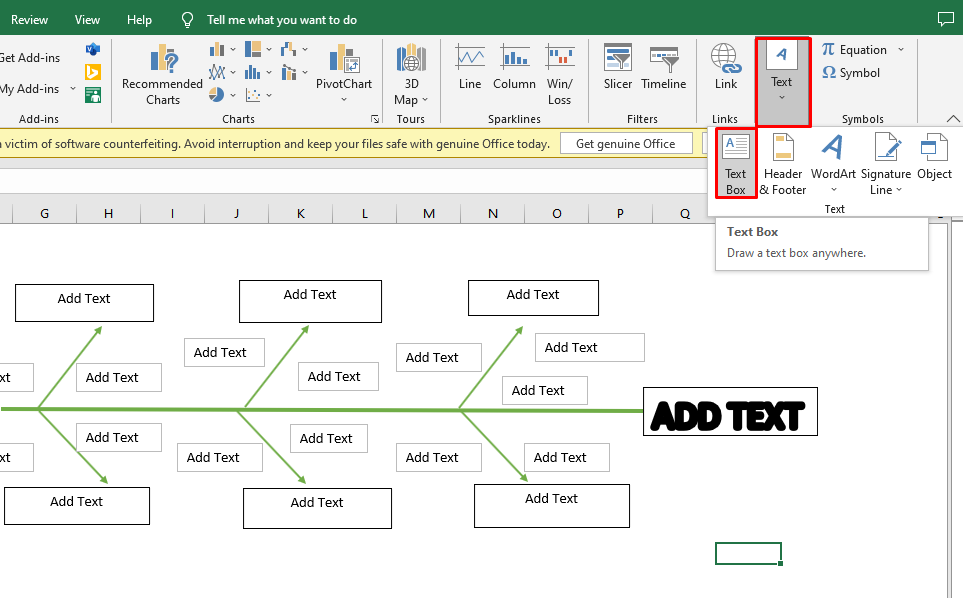
Now that the outline is ready, you can start writing. Excel allows you to add text in two ways.
- If you are adding text over a shape, just double-click it and start writing.
- To write the contributing factors around the connecting lines, click Insert > Text > Text Box. Write down the text accordingly.
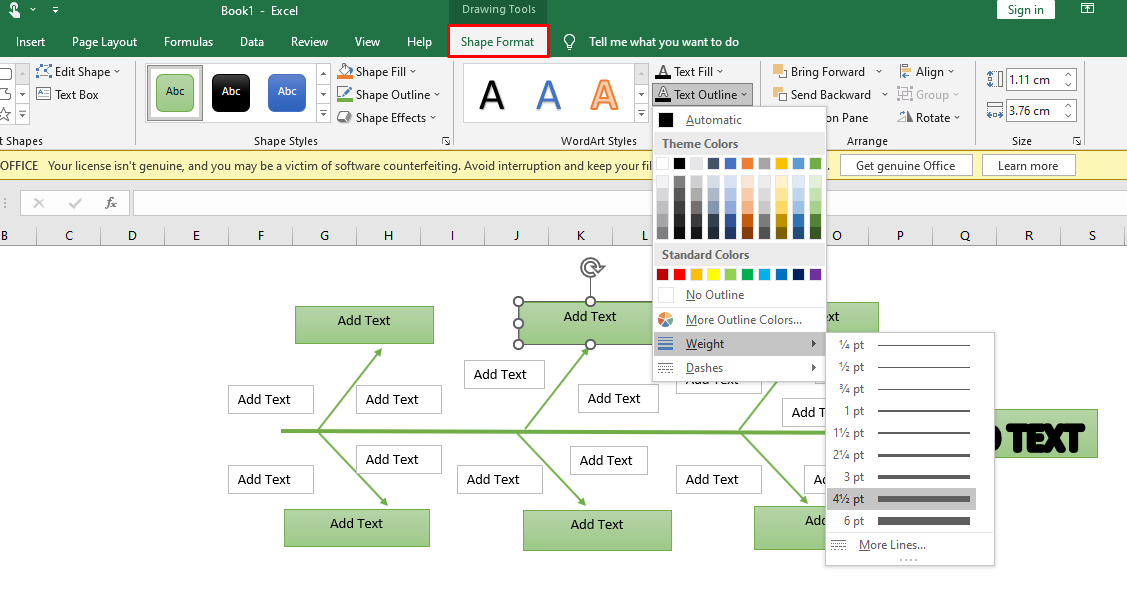
Step 4: Format the Diagram
A presentable and clutter-free fishbone diagram will engage your audience better. A basic outline may not satisfy the visual requirements. Hence, the right way is to format the diagram by changing its color, outline, font style, and more.
Sadly, Excel does not have ready-made themes or color schemes. However, it allows you to change the formatting of each shape individually. You can do this by clicking any shape, and it will open a Format tab in the toolbar. Use it to change color, fill, outline, weight, and more.
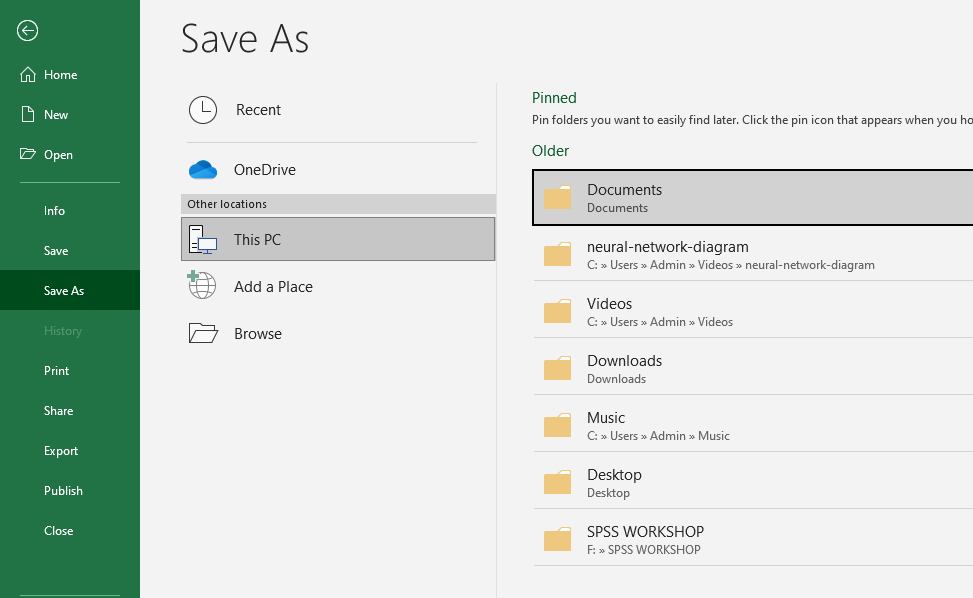
Step 5: Export and Download
Finally, your fishbone diagram is ready to download. Go to the File menu from the top-left corner and click Save As > Preferred Location. Or click Export > PDF to get the file in a PDF format. You can also embed it in Email by clicking Share > Email > Email Address.
Part 2: How to Make a Fishbone Diagram in EdrawMind
There are two ways to make fishbone diagrams in EdrawMind, either from scratch or by using its pre-built designs. So, let us check out each method in detail.
The first stage of making a fishbone diagram is preparation, and it starts with team discussion. So, gather your team, discuss the problem, identify causes and their contributing factors, and note everything down. Once you have a rough outline, download EdrawMind or start on its Online version.
Method 1: Make a Fishbone Diagram from the Scratch
EdrawMind allows you to make a fishbone diagram from scratch in two ways. So, let us discuss them.
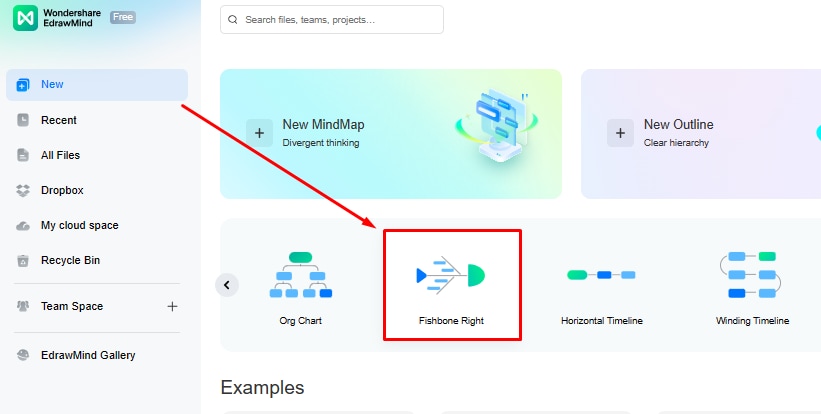
Before you start either method, click New > Fishbone Diagram from the main menu, and it will open the editing panel.


Step: 1 Create a Fishbone Diagram
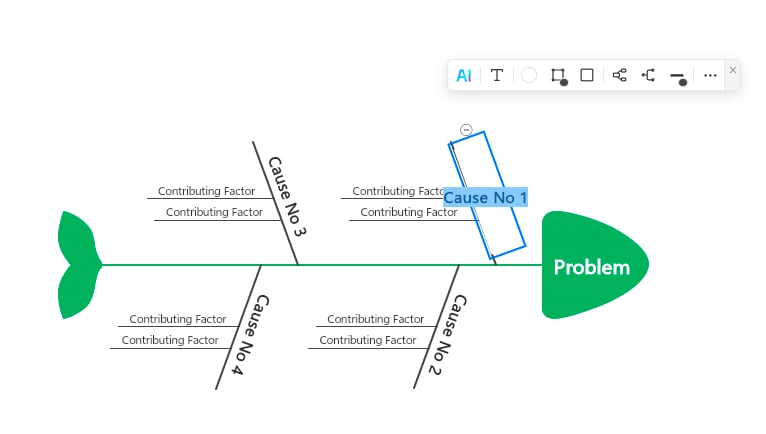
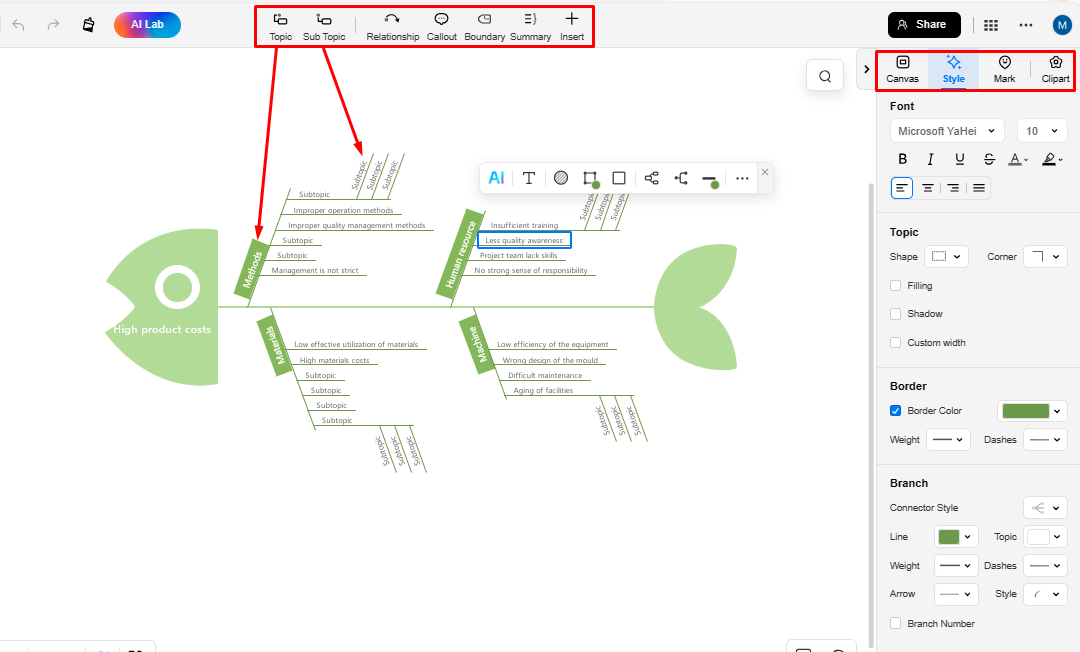
You will see a rough fishbone structure after opening the editing panel. Start expanding it by inserting subtopic and topic from the top toolbar.
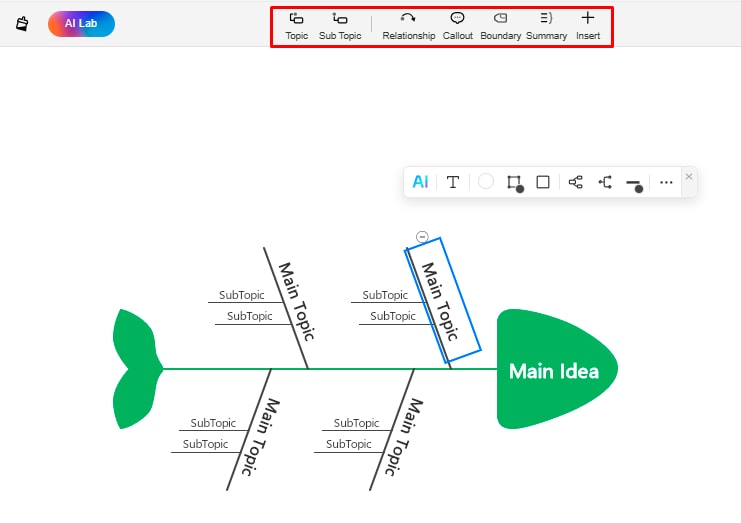
Once done, enter the data in designated fields. You can write in any box by double-clicking it.
Step 2: Create an Outline
Another way to create a fishbone diagram in EdrawMind is through the outline. Here is how you can do it.
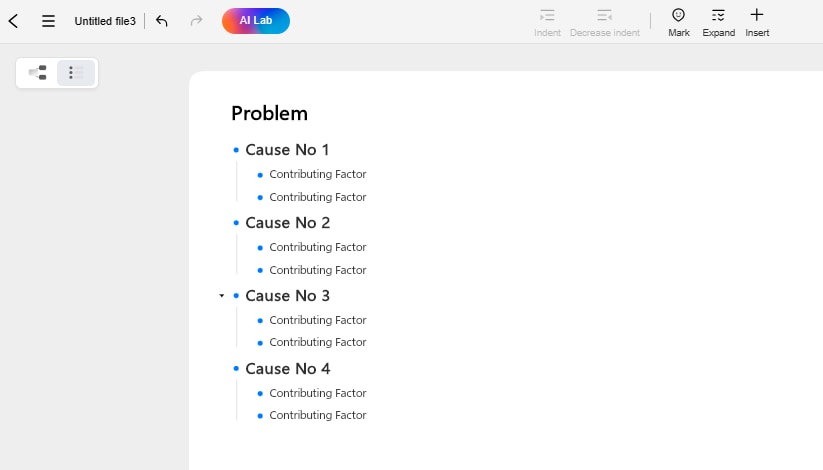
First, click New > Fishbone Diagram. Once you are on the editing panel, switch to Outline from the top-left corner of the canvas and enter the data.
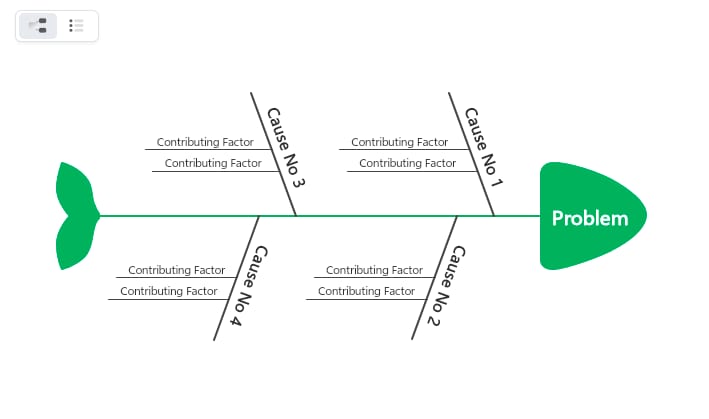
Now that you have an outline ready, switch it back to the Mind Map from the top-left corner, and it will automatically create a fishbone diagram.
Step 3: Personalize the Diagram
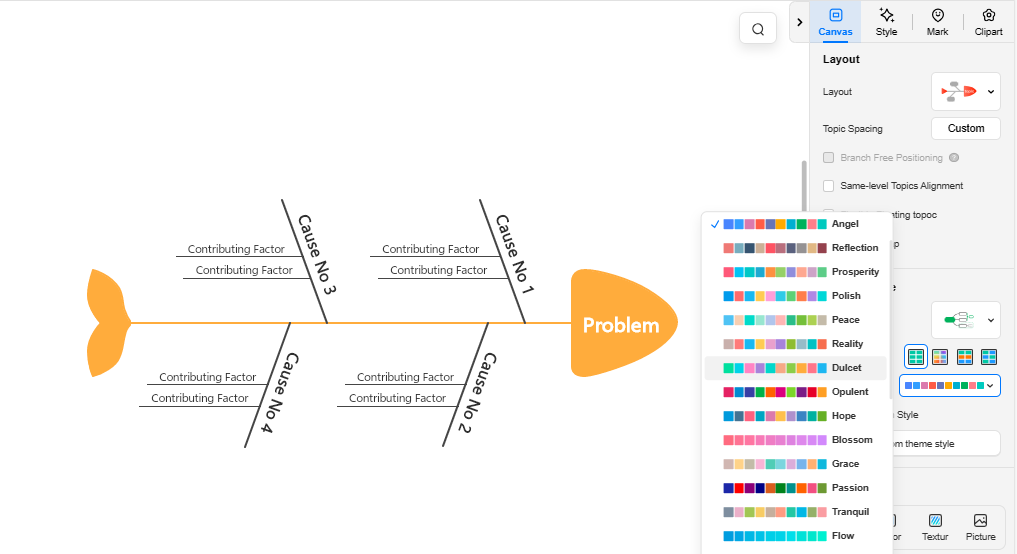
EdrawMind's formatting tools allow you to modify the appearance of your fishbone diagram. You can change the diagram's alignment, color scheme, font, and style. Just open the information setting panel from the right side of the canvas and start customizing.
Method 2: Make a Fishbone Diagram Using Built-in Templates
EdrawMind also has pre-built designs that cut down the creation time in half. These templates are great for projects with tight deadlines.
Here is how to use these templates and make a fishbone diagram.
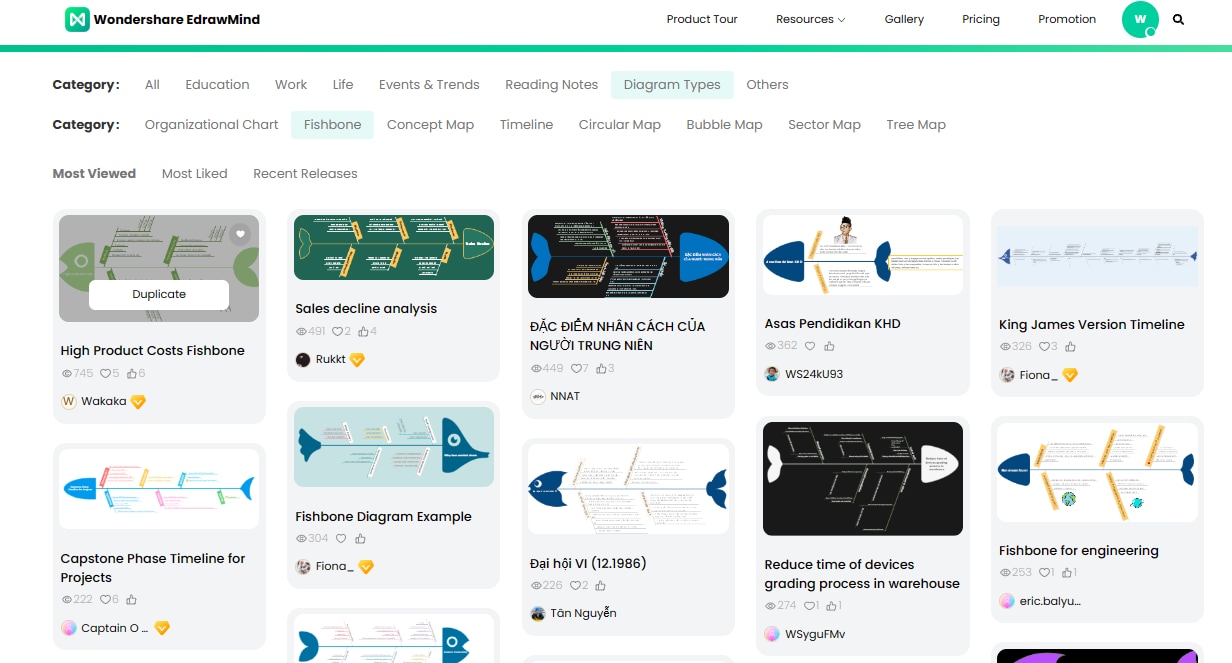
Step 1: Select a Template
Visit the Template Gallery from the EdrawMind dashboard. Filter search by selecting the Fishbone Diagram, and it will display the pre-built designs. Check each diagram thoroughly to find a perfect fit for your task, and click Duplicate. It will open the template in the editing panel.
Step 2: Edit and Personalize
Enter the problem statement and causes. You can expand the diagram by using the Topic and Sub-Topic buttons on the top toolbar. Once done, double-check the data.
Now that the diagram is complete, you can change its formatting from the right-side information setting panel. Modify the color scheme, font style, and theme. Congratulations, your fishbone diagram is ready.
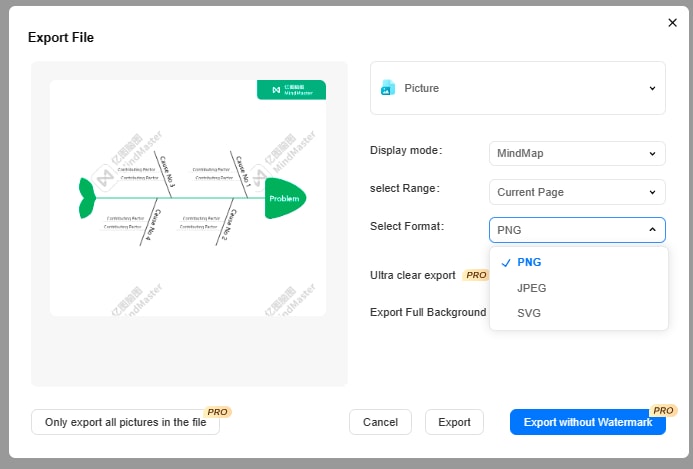
Step 3: Download and Share Your Fishbone Diagram
Download the fishbone diagram from the top-right corner once it is complete. You can choose to export it in multiple formats, including PNG, JPG, XLSX and more.
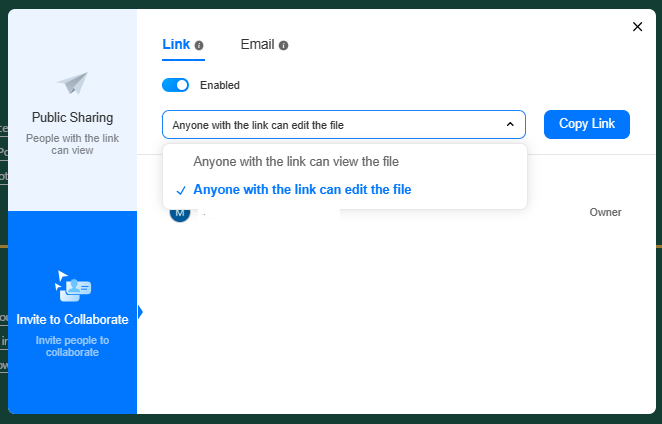
It also allows sharing of the final diagram. Just click Share from the top-right corner and edit permission.
Part 3: Making Fishbone Diagram in Excel Vs. EdrawMind
It is difficult to choose one when you have two equally impressive options for making a fishbone diagram. But, you have to select.
An excellent way to decide is by narrowing down your requirements. For instance:
- if you want to ease and speed up the creation process, EdrawMind is the right choice. It has pre-built designs that narrow down the required steps.
- Plus, its beginner-friendly interface further makes it suitable for teams who are just starting.
In comparison, some teams demand the use of convenient tools like MS Excel. It is because most of us are already familiar with it, and they do not have to train new hires. Needless to say, making a fishbone diagram in Excel is easy and does not require training.
Part 4: Free Fishbone Diagram Maker

Making a fishbone diagram for team projects means organizing lengthy meetings, creating mind maps, and sharing feedback. And using different tools for each step is undoubtedly time-consuming and challenging.
Hence, a wise way out would be an all-in-one space like Edrawmind, where you can brainstorm, manage teams, and create diagrams. Here are potential reasons why it might be a better choice.
- It allows you to create detailed mind maps from outlines and text with one click.
- EdrawMind has a massive template gallery with free fishbone and mind map designs. So, all you need to do is modify the one that closely resembles your task.
- The EdrawMind Online supports cloud services. It allows teams to auto-save, share, and revise their designs.
- It supports multiple export formats, including PDF, SVG, HTML, MindManager, and Txt. So, people who are not registered on EdrawMind can view and appreciate your work.
Conclusion
Making a fishbone diagram in Excel is undoubtedly a popular choice and for good reasons. Our familiarity with this tool, along with its simple layout and diverse range of shapes, make it a good alternative for people just starting out.
Sadly, it may not be the right one for professionals, considering that it may not have the best formatting options. What may work well for them is a digital space like EdrawMind that is easy to learn and allows you to expand.
So, if you are thinking of switching from Excel, give EdrawMind a try. You may like its detailed and structured interface.
