


Why does the structure of power matter so profoundly within an organization? Understanding the Department of Energy org chart reveals the blueprint of decision-making and efficiency in managing our nation's energy resources. There's a growing need for clarity in how the energy org chart is designed and implemented, reflecting the intricate web of roles and responsibilities.
This article will guide you through the creation of such an org chart using EdrawMind, offering a step-by-step approach to visualize the hierarchical structure effectively. By the end of this guide, you'll have a clear roadmap to design a Department of Energy org chart that reflects the complex yet essential organization behind energy management and policy implementation.
Let's unveil the layers of this vital structure together!
In this article
Part 1. Best Department of Energy Organizational Charts
General Department of Energy Organizational Chart
 below.
  below.
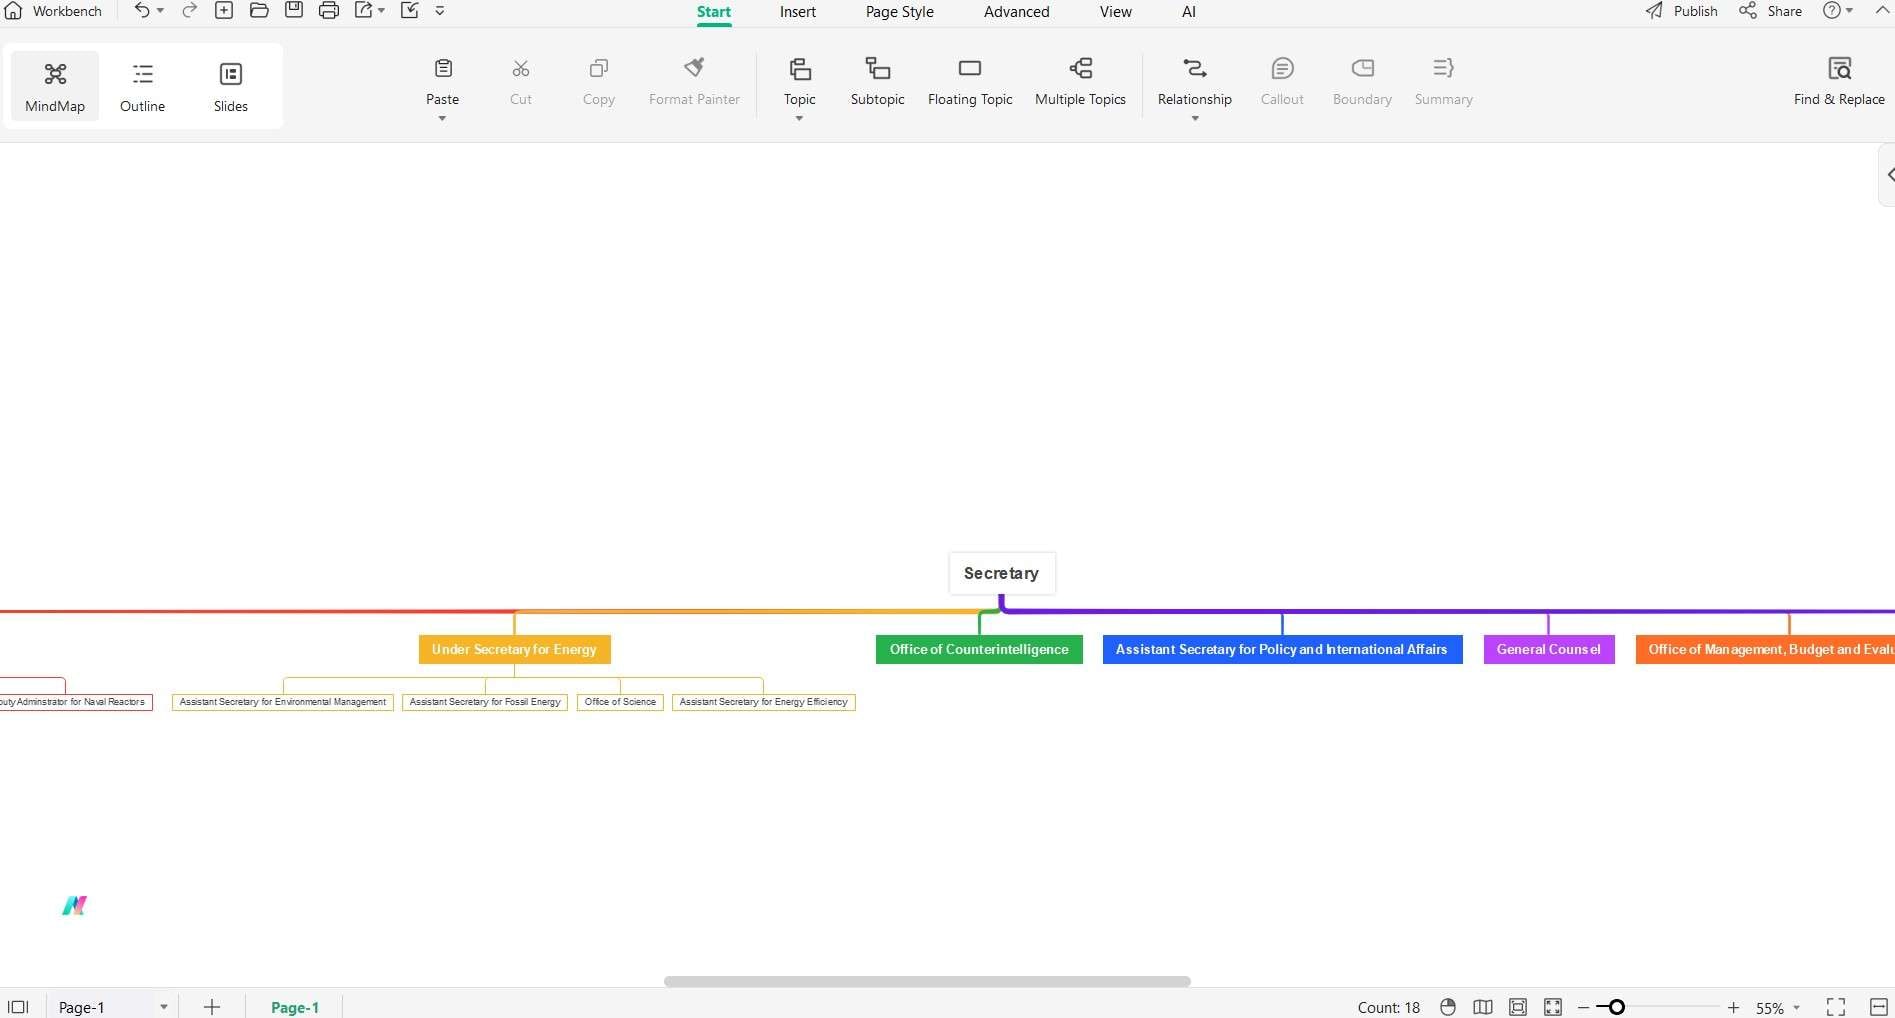
 The General Department of Energy Organizational Chart serves as a structural guide, delineating the various key positions that contribute to the department's mission.
At the apex is the Secretary, who oversees pivotal offices including the Under Secretary for Energy and the Office of Counterintelligence, as well as several Assistant Secretaries responsible for different areas.
Deputy Secretary Energy Organizational Chart
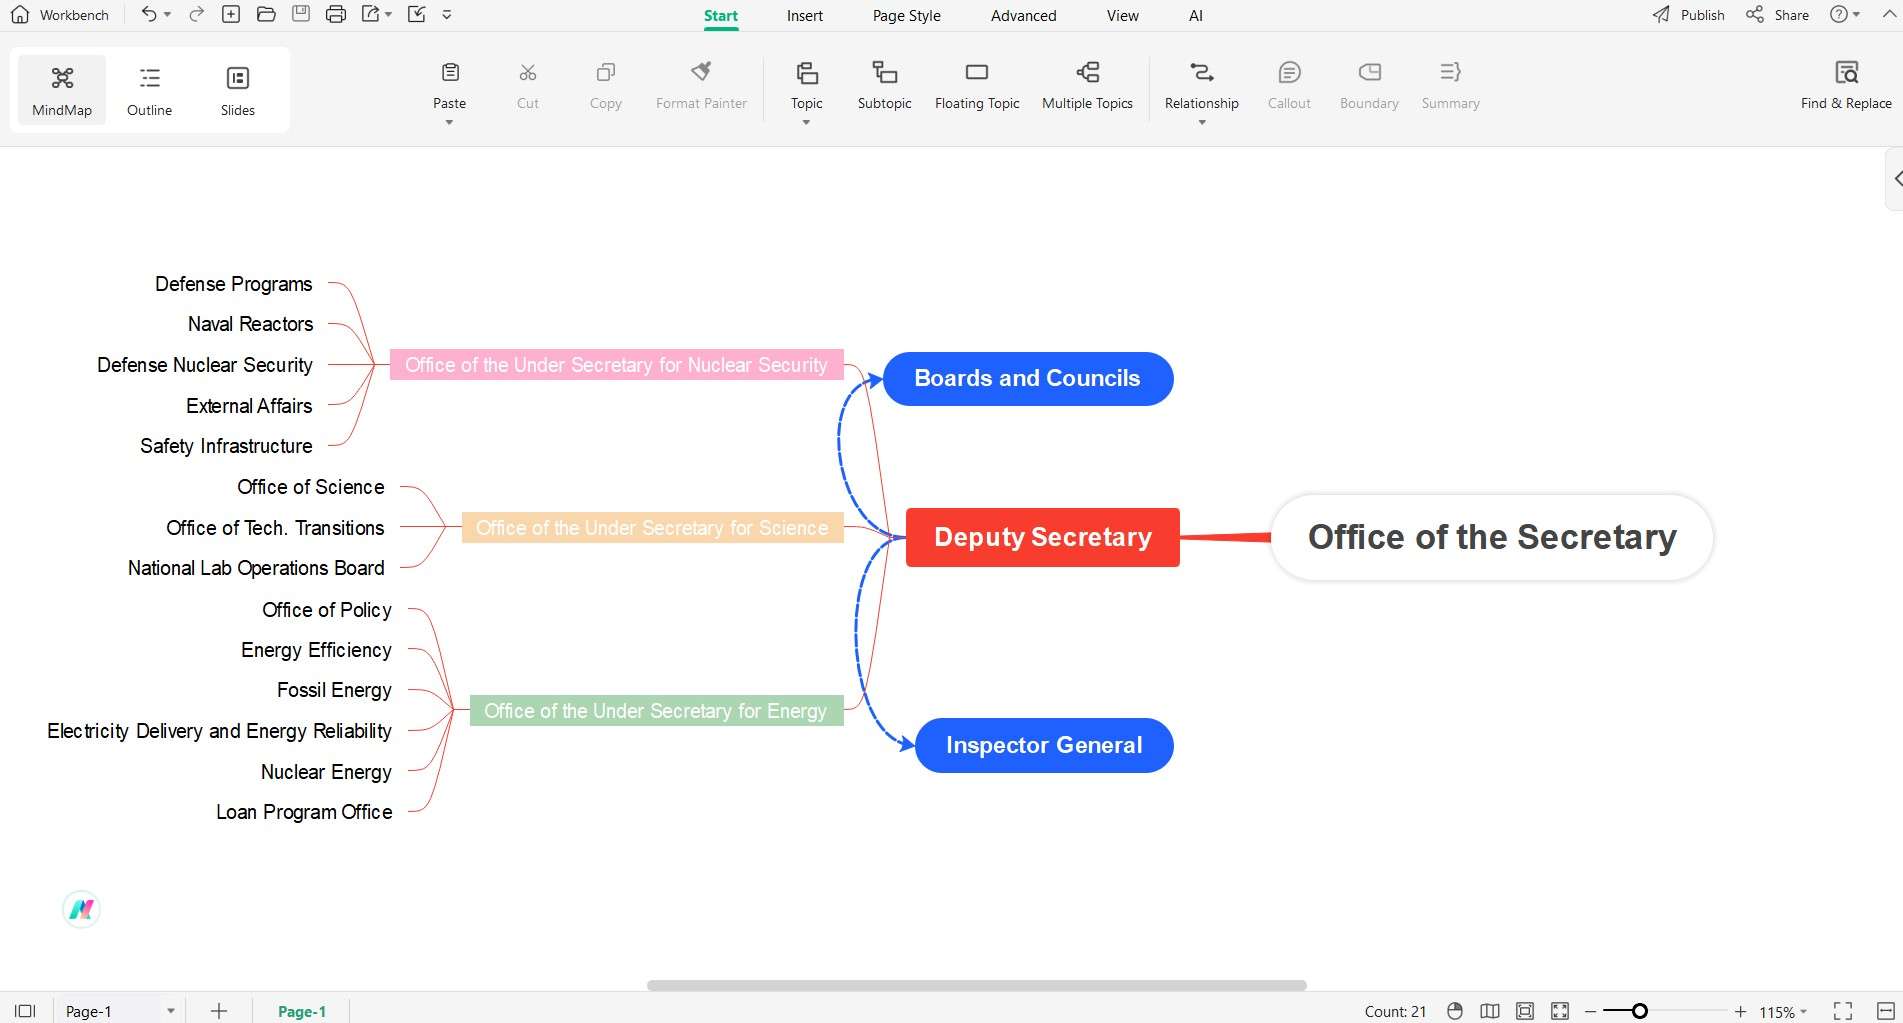
The Deputy Secretary Energy Organizational Chart maps the flow of command and coordination within the Department of Energy. It places the Deputy Secretary at the core, connected to critical areas like Nuclear Security, Science, and Energy.
The chart shows direct links to boards and councils and the essential roles of the Inspector General and the various offices dedicated to energy policy, science, and security. This visualization aids in understanding the Department's structure and the Deputy Secretary’s significant role in managing these relationships.
Principal Deputy and Supportive Branches Energy Org Chart
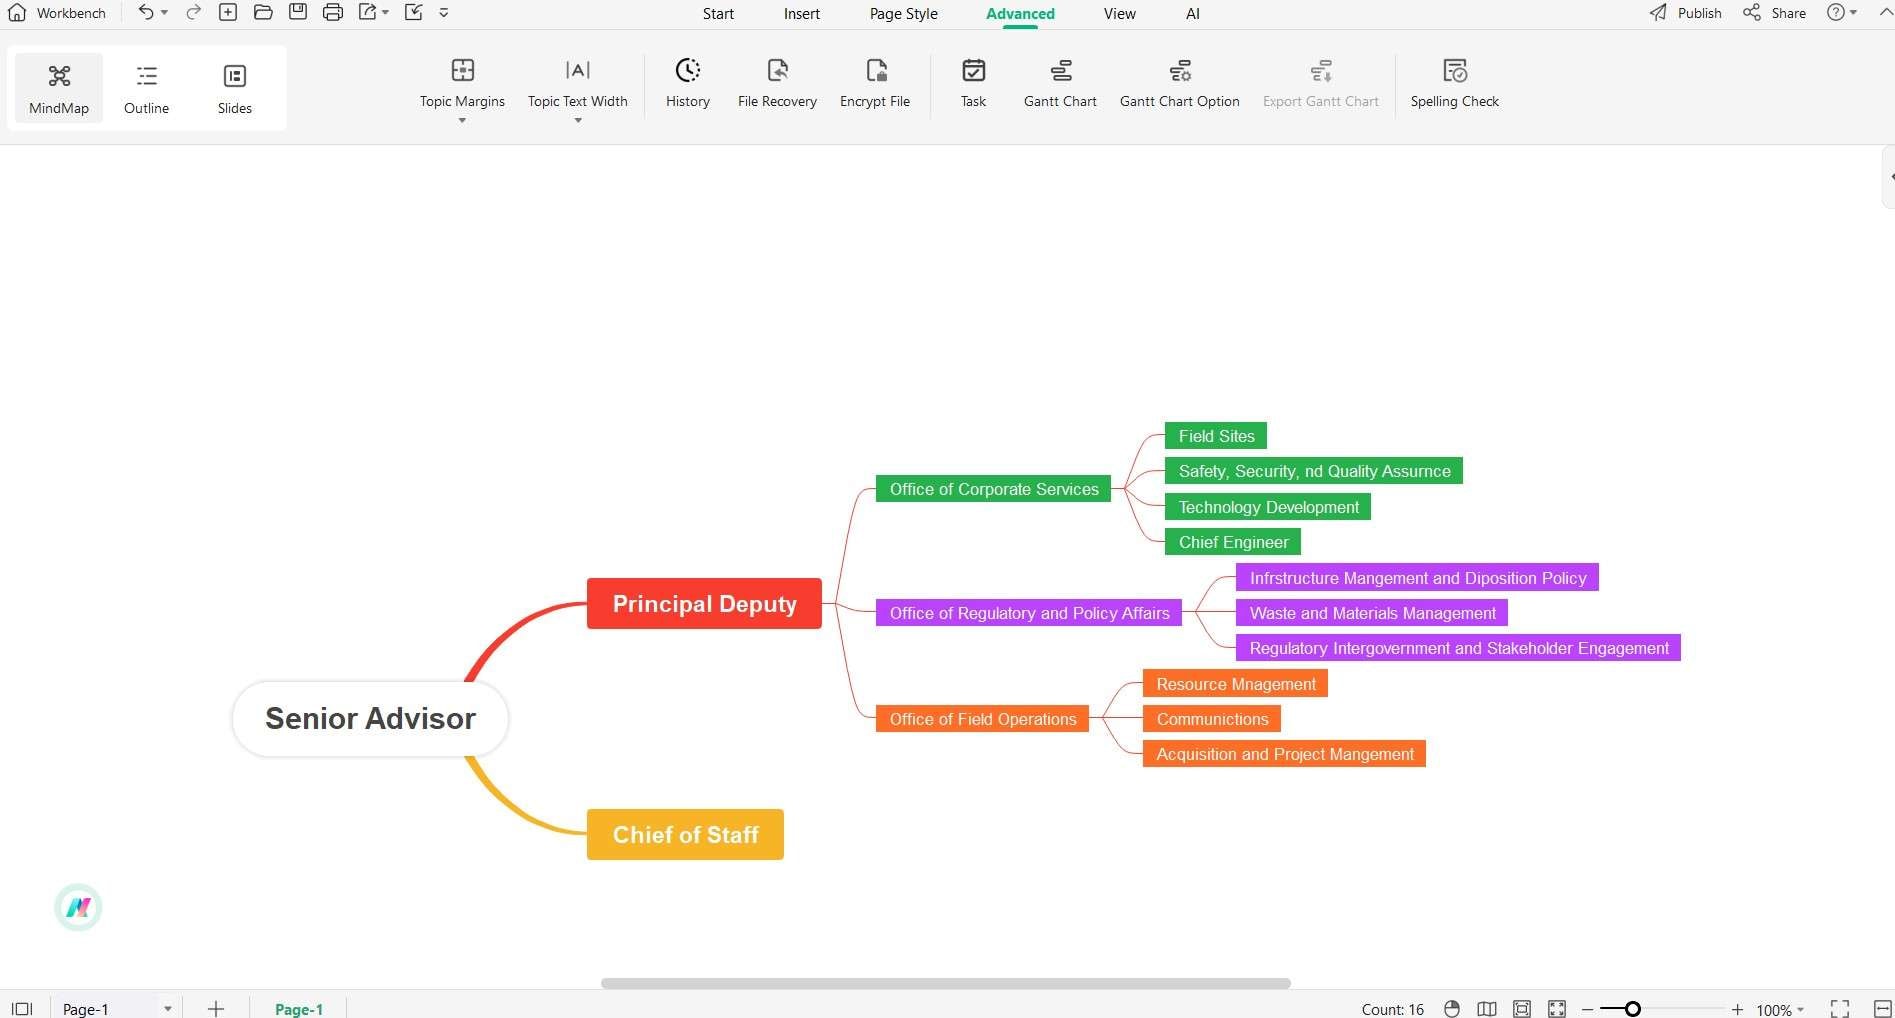
The Principal Deputy and Supportive Branches Energy Org Chart visually organizes the relationship between the Principal Deputy and critical support roles within the Department of Energy. It outlines the Principal Deputy's coordination with advisors and chiefs, as well as the oversight of essential services like corporate affairs, regulatory matters, and field operations.
Division Director's Specialized Energy Research Centers Org Chart
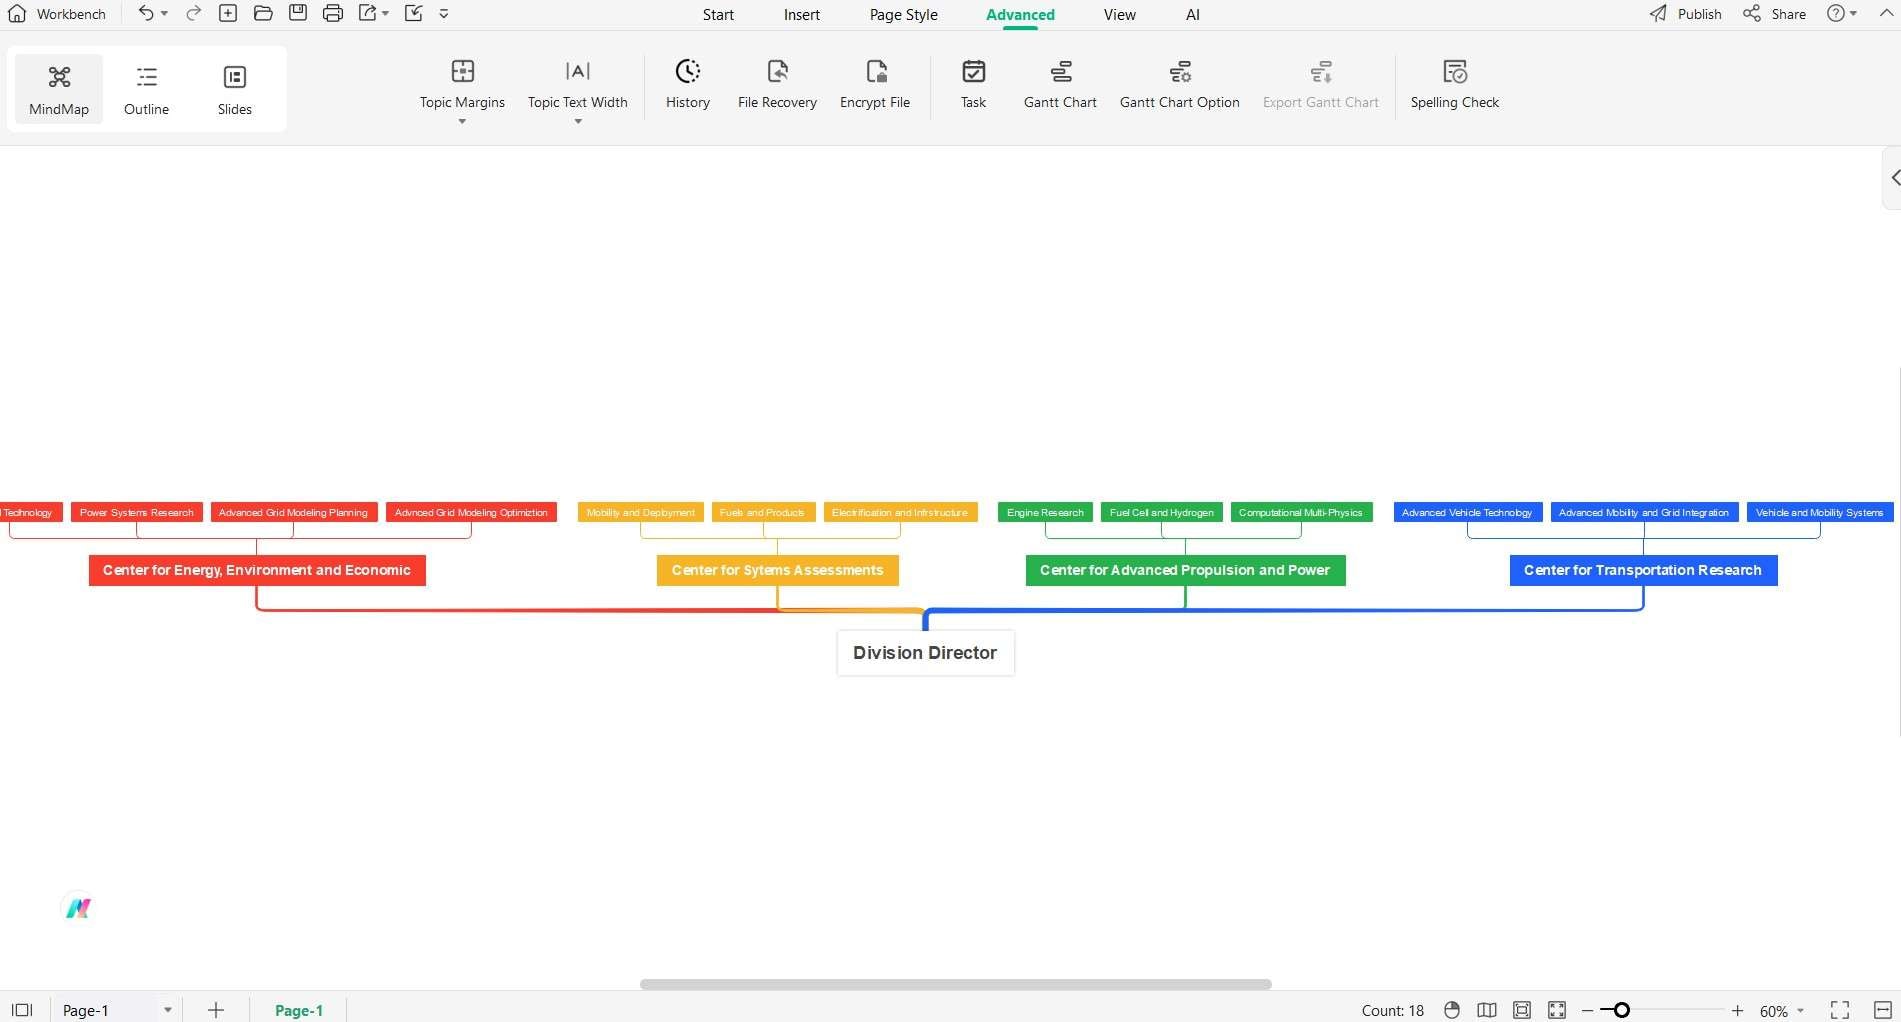
The Division Director's Specialized Energy Research Centers Org Chart outlines the Division Director’s role in leading multiple research centers. These centers focus on different aspects of energy, environment, and transportation.
They work on advanced technologies, systems assessments, propulsion, and economic analysis. The chart is a straightforward display of how the Division Director connects to each research center, ensuring targeted progress across varied energy-related fields.
Part 2. How to make Department of Energy Org Chart in EdrawMind
Creating an organizational chart for the Department of Energy is a breeze with EdrawMind. The tool's user-friendly interface lets anyone put together a clear energy org chart. Now, let’s move forward and explore the steps you’ll follow in EdrawMind to create your department’s org chart.
Step 1. Starting your Energy Org Chart Process
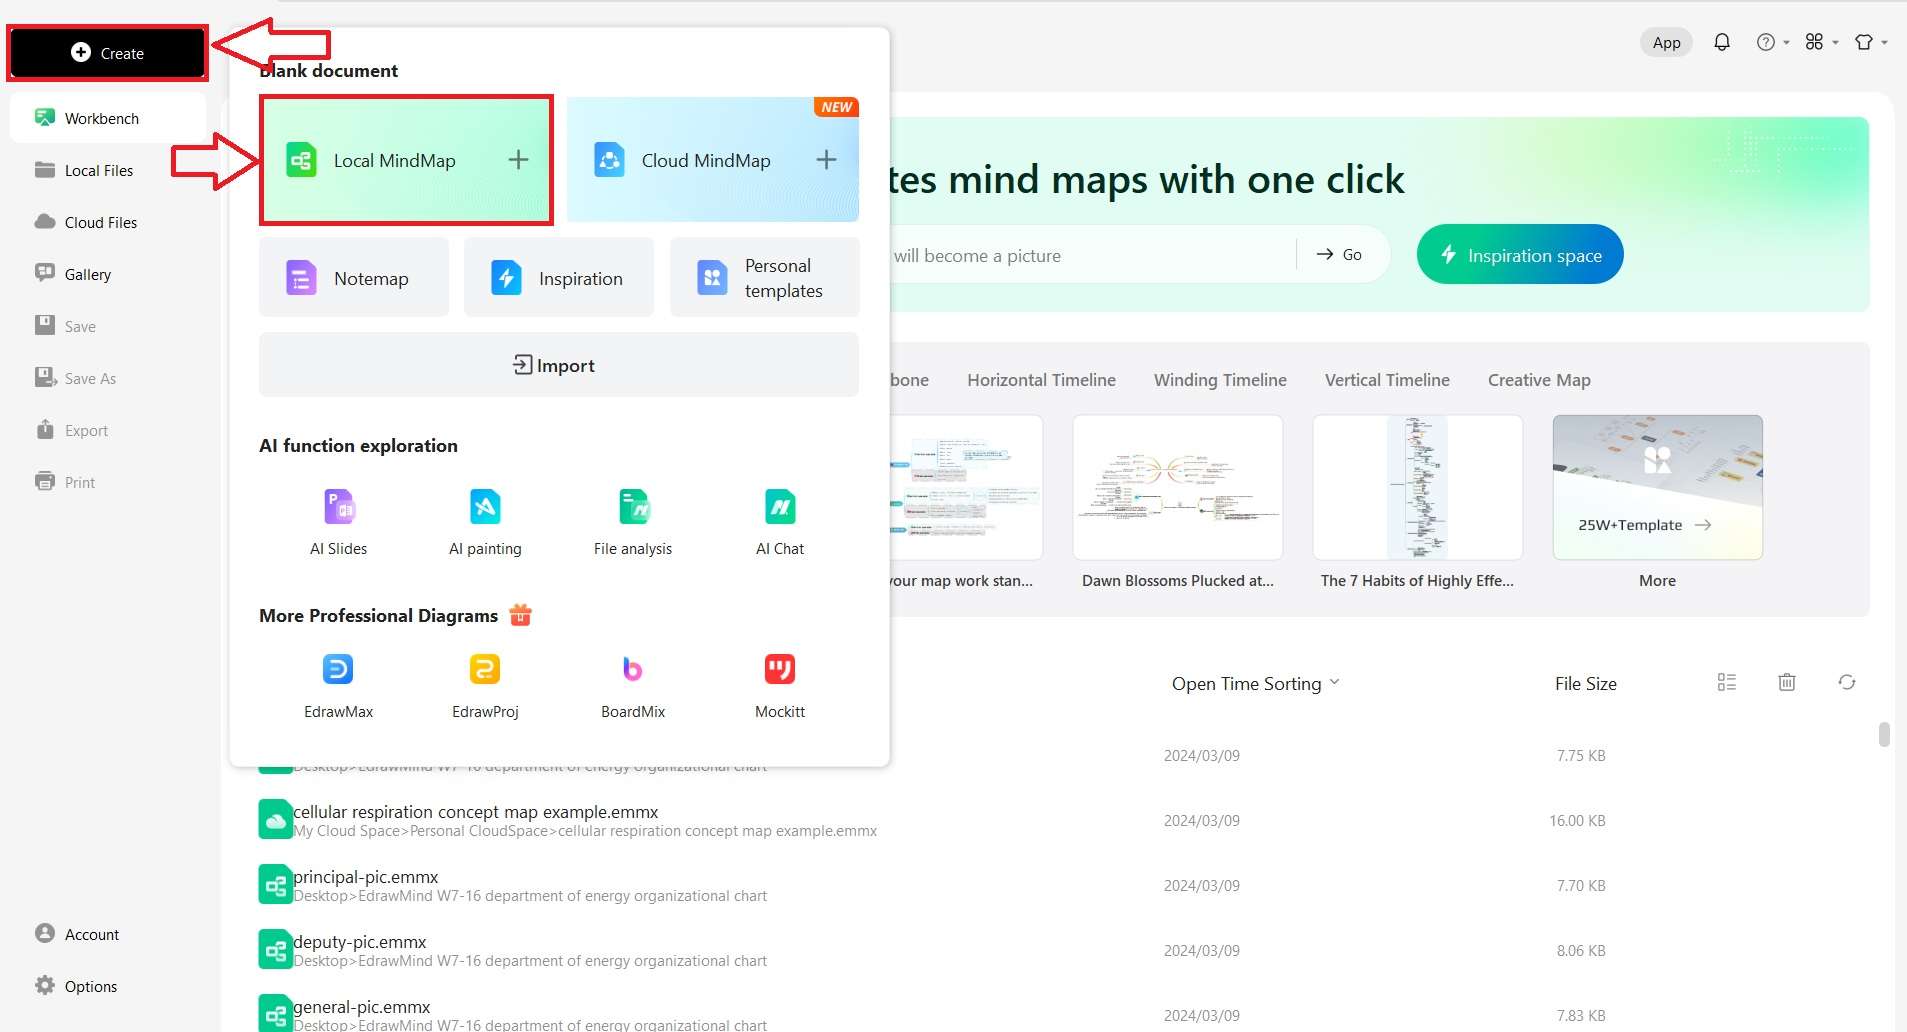
Open EdrawMind and look for the Create icon to kick off yourenergy org chart. Tap on it and choose Local Mind Map for a new design. If you're working on an already started chart, just click Import to upload and edit it within the app.
Step 2. Modifying Topics
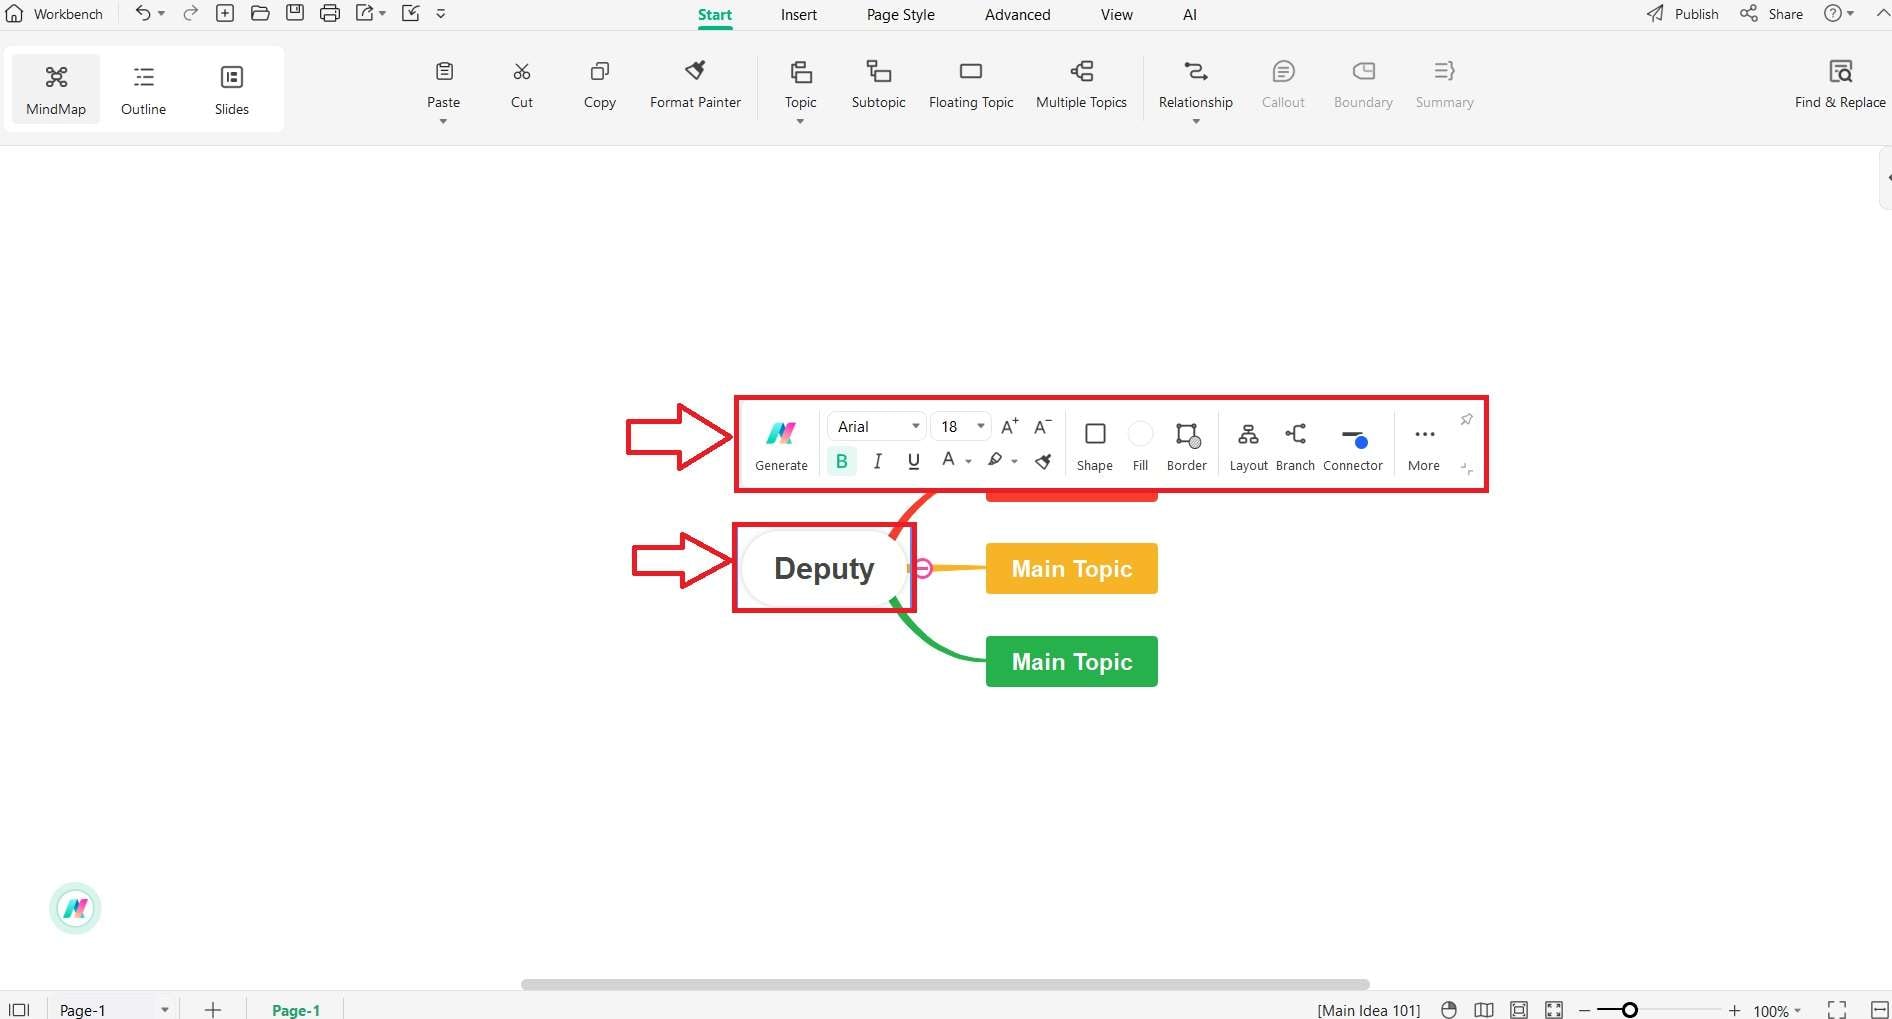
Once you're in the Local Mind Map, start shaping yourorg chart for energyby double-clicking on a topic to edit the text. Arrange the structure to reflect your department's hierarchy. Utilize the toolbar that appears when you select a topic to personalize its appearance to suit your chart's needs.
Step 3: Linking Topics
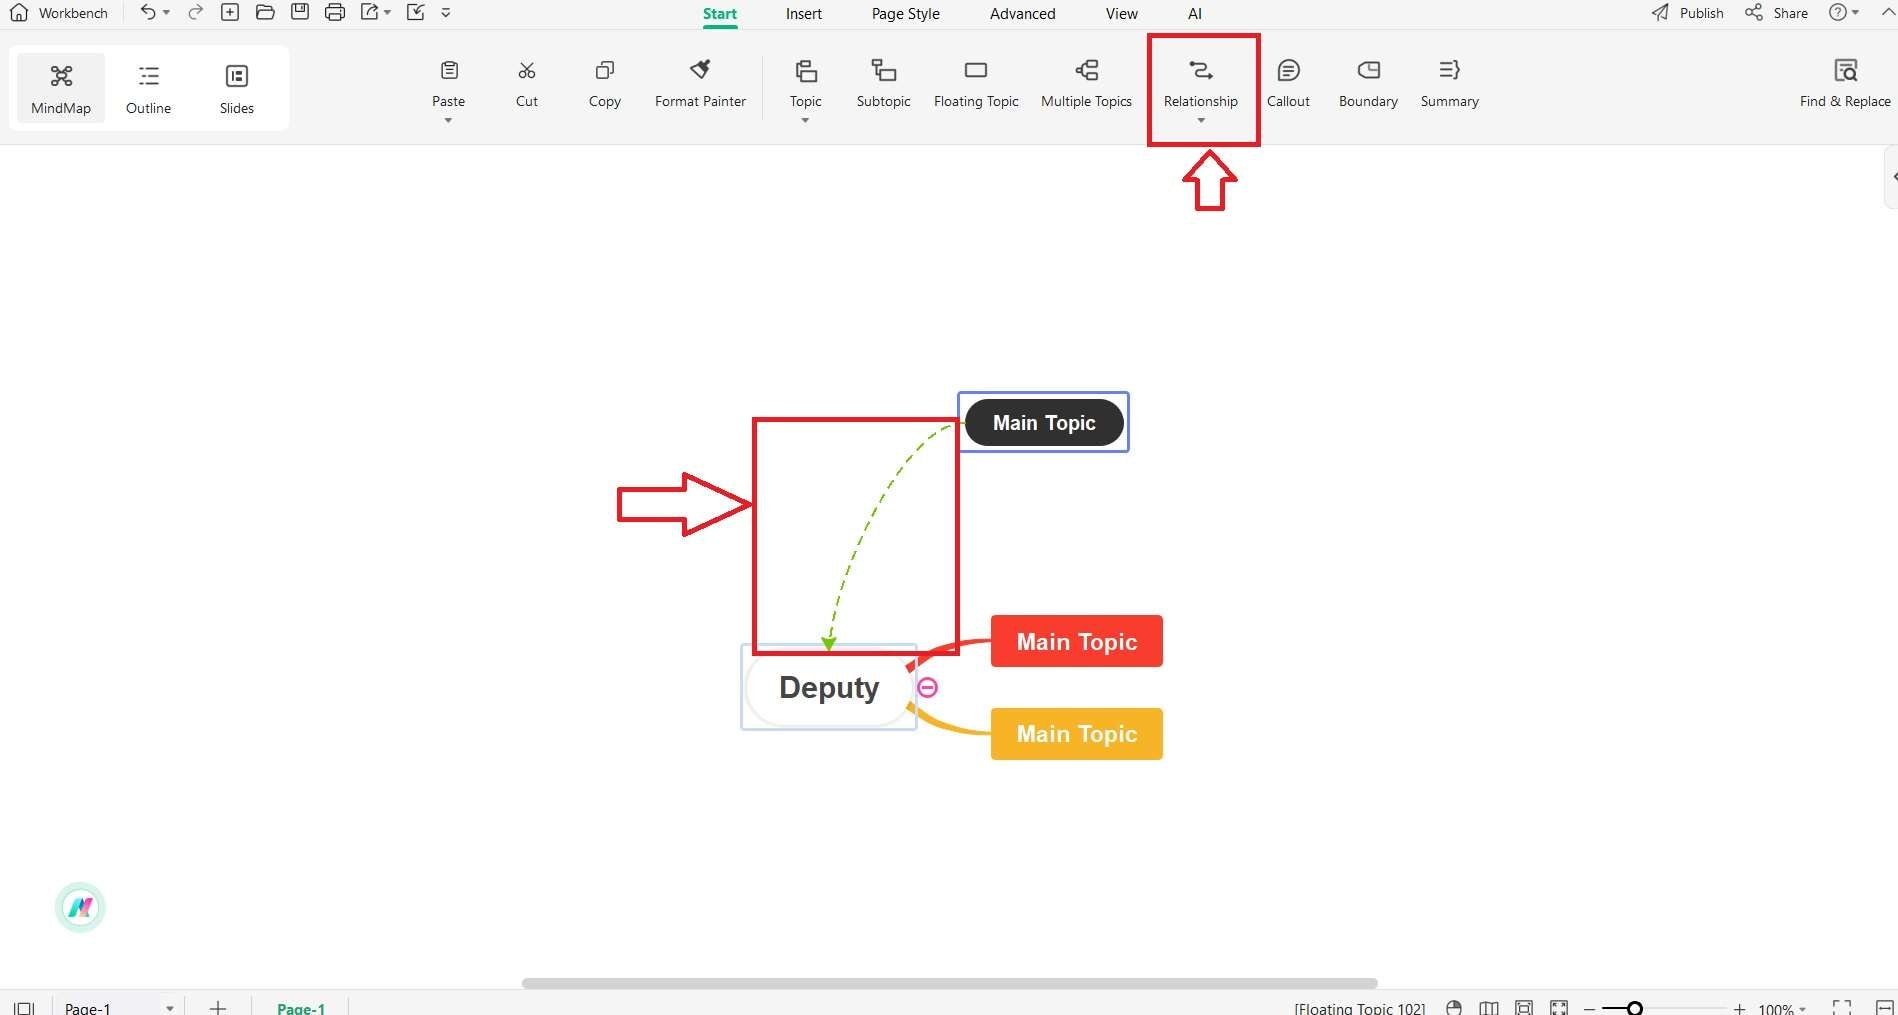
To show connections in your energy org chart, select a topic, then choose the "Relationship" tool to draw arrows between two topics. This visually represents the reporting lines and collaborations within the Department of Energy.
Step 4. Managing Topics and Subtopics
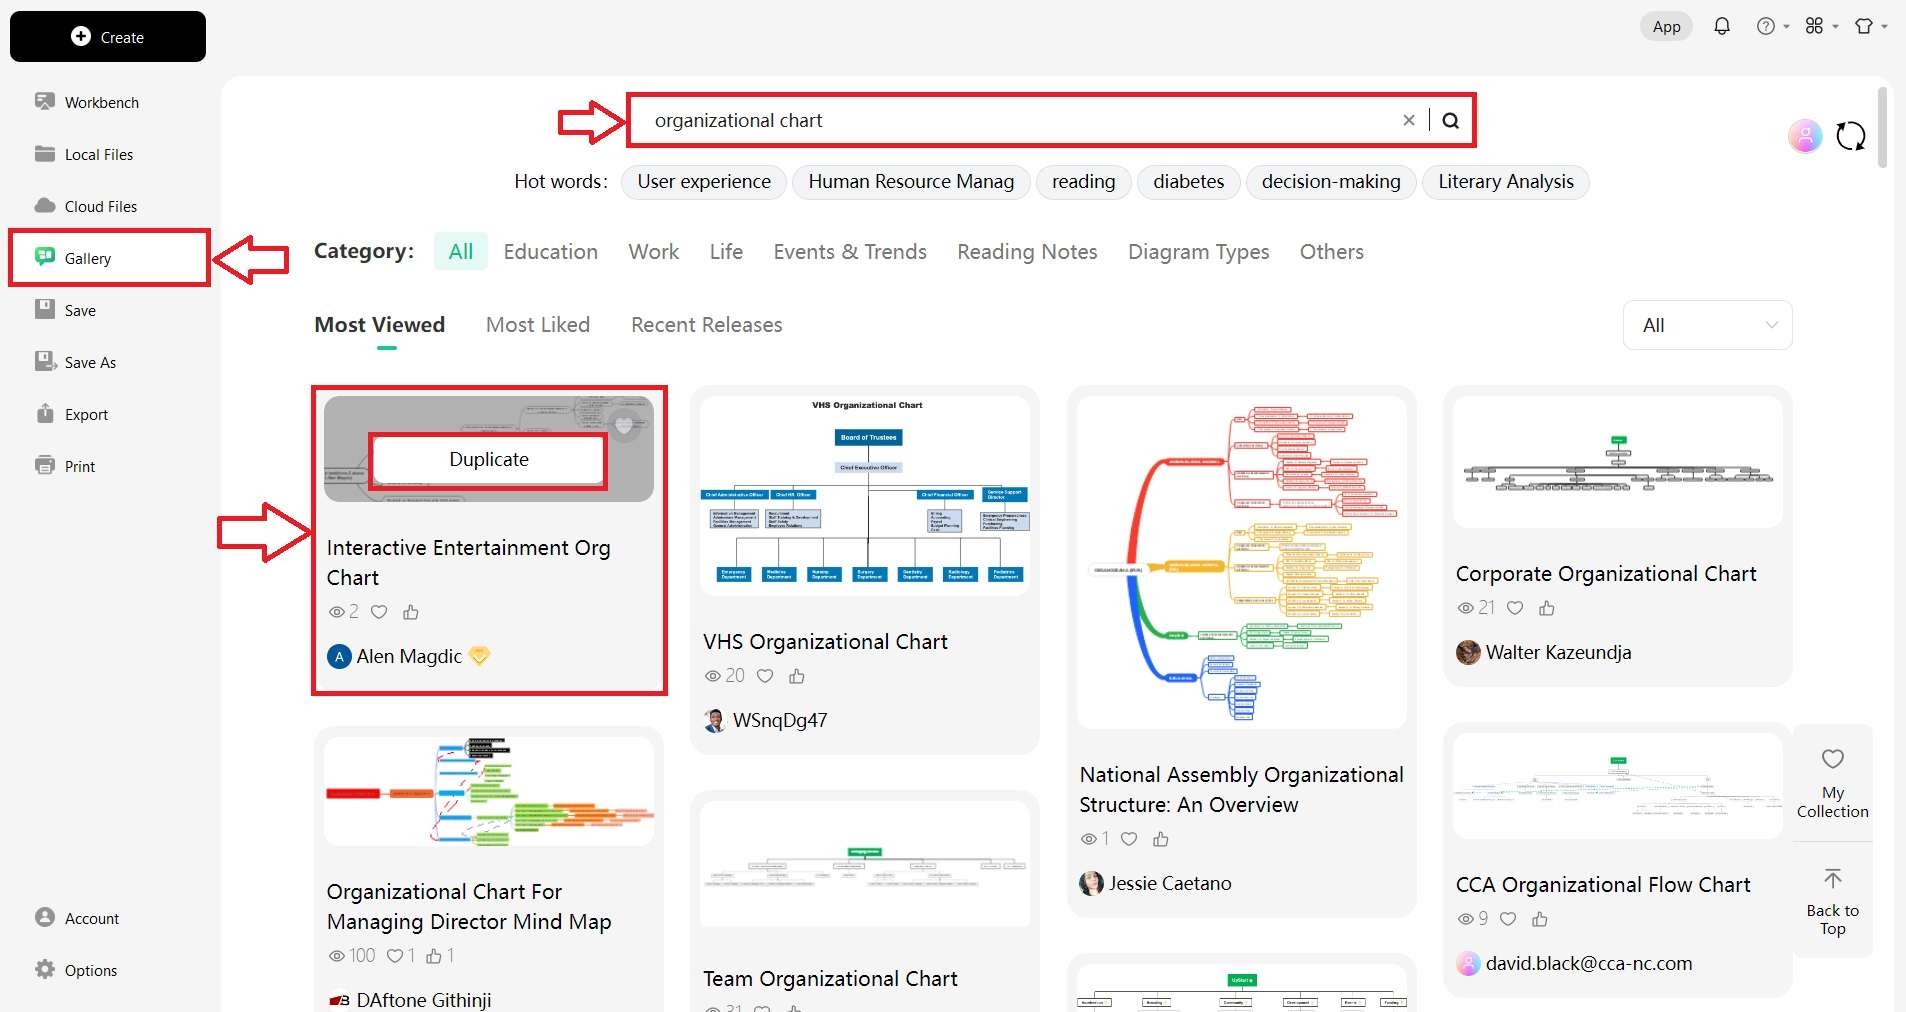
For those who prefer a head start, navigate to the Gallery in EdrawMind, and type organizational chart into the search bar. Find a template that fits your vision for the energy org chart, click Duplicate to add it to your workspace, and then tailor it to meet the specific needs of your department.
Step 5. Saving Your Work
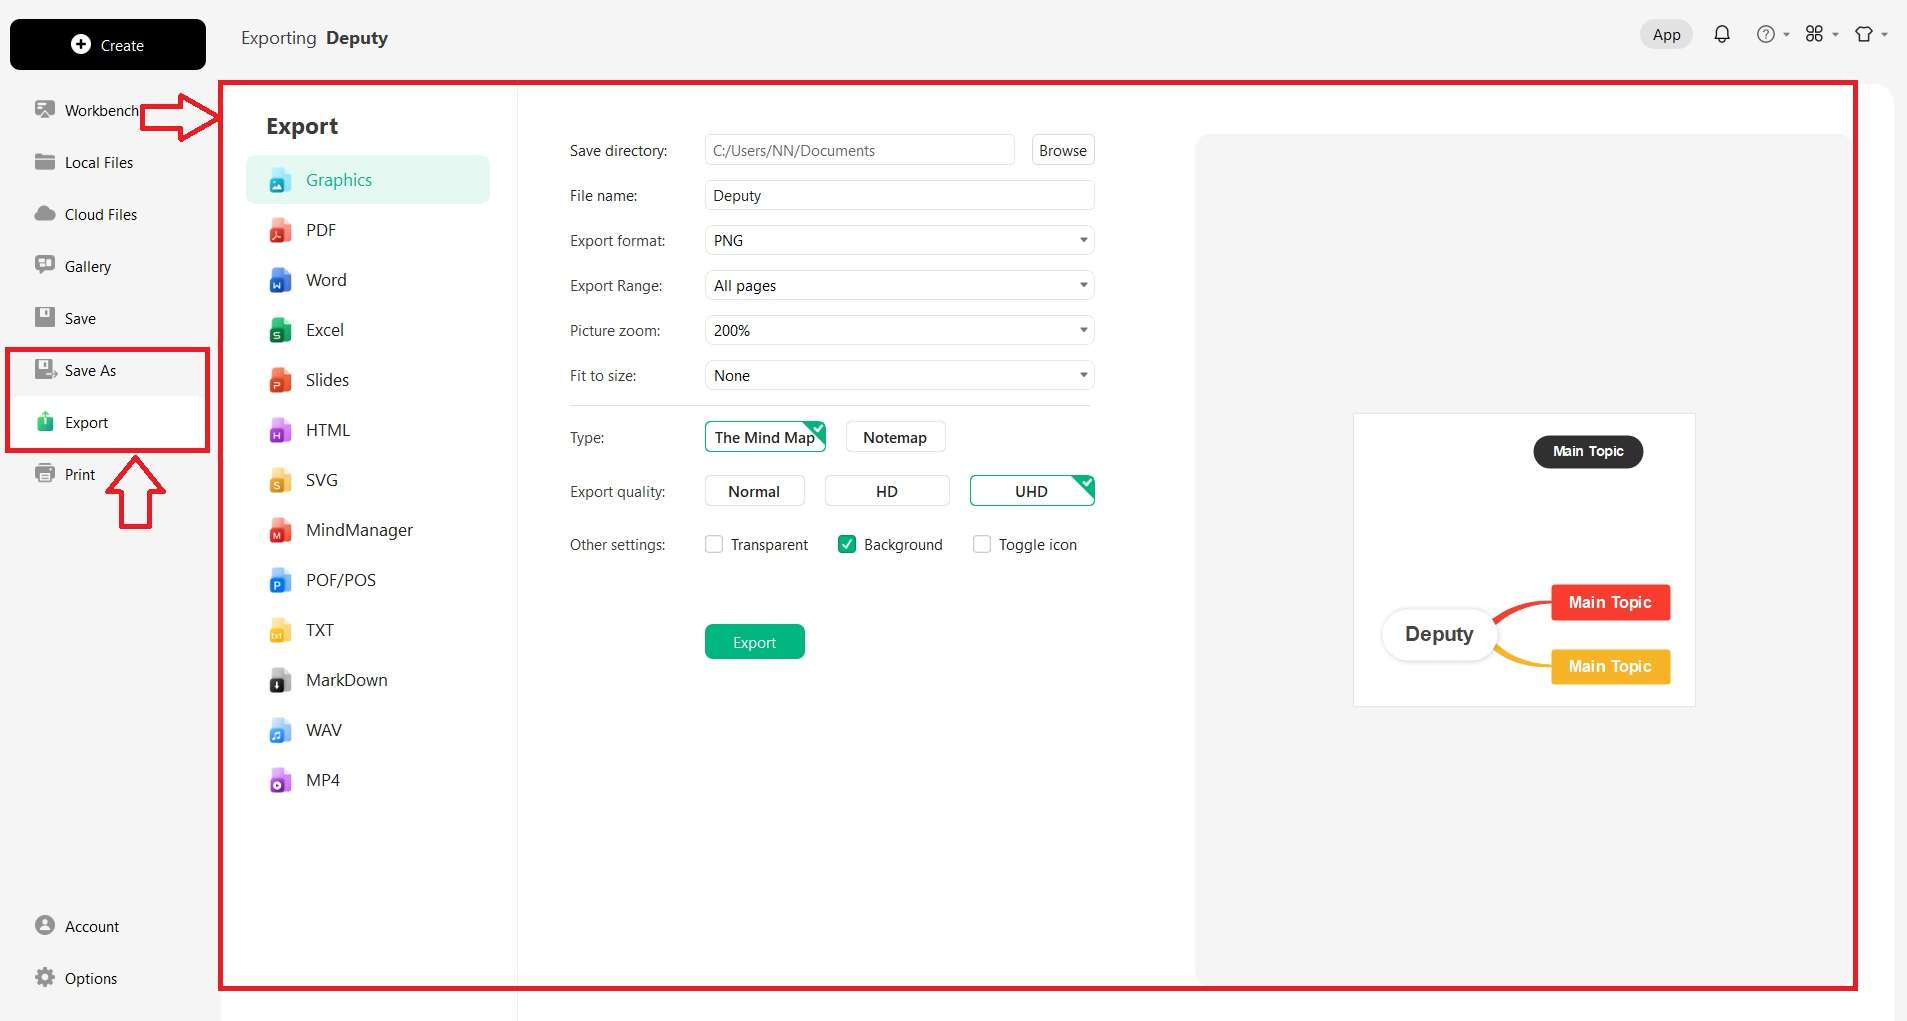
After completing your organizational chart for energy, save your work by going to the Save As option.To export your file, navigate to the Export section. Choose your preferred file format and quality, then click Export to save it on your device. Now your chart is ready for presentation or sharing with colleagues.
Part 3. What is Wondershare EdrawMind
EdrawMind stands out as a versatile and collaborative online tool, designed to enhance productivity and organization. It excels as a mind map maker, allowing for the visual structuring of thoughts and ideas. The platform shines in team management with its collaborative features, enabling multiple users to contribute simultaneously to a project.
This makes it an ideal solution for creating a Department of Energy organizational chart. Its compatibility across multiple platforms ensures that team members can contribute regardless of their device. Whether you're mapping out a high-level overview or a detailed departmental hierarchy, EdrawMind is equipped to handle the intricacies of the Department of Energy’s needs.
Key Features
- Real-Time Collaboration: EdrawMind enhances teamwork by enabling multiple users to work on the same document simultaneously. Changes are updated live, ensuring that everyone is always on the same page.
- Template Community: Users have access to a rich library of over 5,000+ templates, making it easy to jump-start any project, from brainstorming to project planning.
- Diverse Import Options: EdrawMind supports a wide array of import formats. You can bring in files from MindManager, Xmind, FreeMind, EdrawMax, Word, Markdown, HTML, TXT, and even Baidu brain map.
- Flexible Export Choices: When your organizational chart is complete, you have the option to export it in numerous formats. These include Graphics, PDF, Word, Excel, Slides, HTML, SVG, MindManager, POF/POS, TXT, Markdown, WAV, and MP4.
- Cross-Platform Compatibility: EdrawMind works seamlessly across Windows, Mac, Linux, Web, iOS, and Android, ensuring access to your work from any device, at any time.
Reasons to Choose
- Simple: EdrawMind's intuitive design ensures that anyone can start creating mind maps without a steep learning curve, streamlining the organization of thoughts and tasks.
- User-friendly: With its clean interface and drag-and-drop functionality, EdrawMind makes it easy for users to develop complex charts with minimal effort.
- Affordable: EdrawMind stands out in the market with competitively priced plans, offering a comprehensive set of features even in its free version, making it accessible for all users.
- Cross-platform Availability: EdrawMind's compatibility across various operating systems such as Windows, macOS, Linux, iOS, and Android means you can work on your projects anytime, anywhere, on any device.
Software Rating
- G2: 4.6 out of 5 stars
- Capterra: 4.6 out of 5 stars
Pricing Plans
EdrawMind offers the following pricing plans:
- Subscription Plan: $59
- Perpetual Plan: $118 (one-time payment)
- Perpetual Bundle Plan: $245 (one-time payment)
Furthermore, it is critical for users to visit the official pricing page of EdrawMind to get the latest pricing updates and offers.
Part 4. Why make an organizational chart
From fostering clearer communication to facilitating new member integration, these visual tools are pivotal in enhancing overall operational effectiveness. Let's explore the tangible benefits that org charts offer.
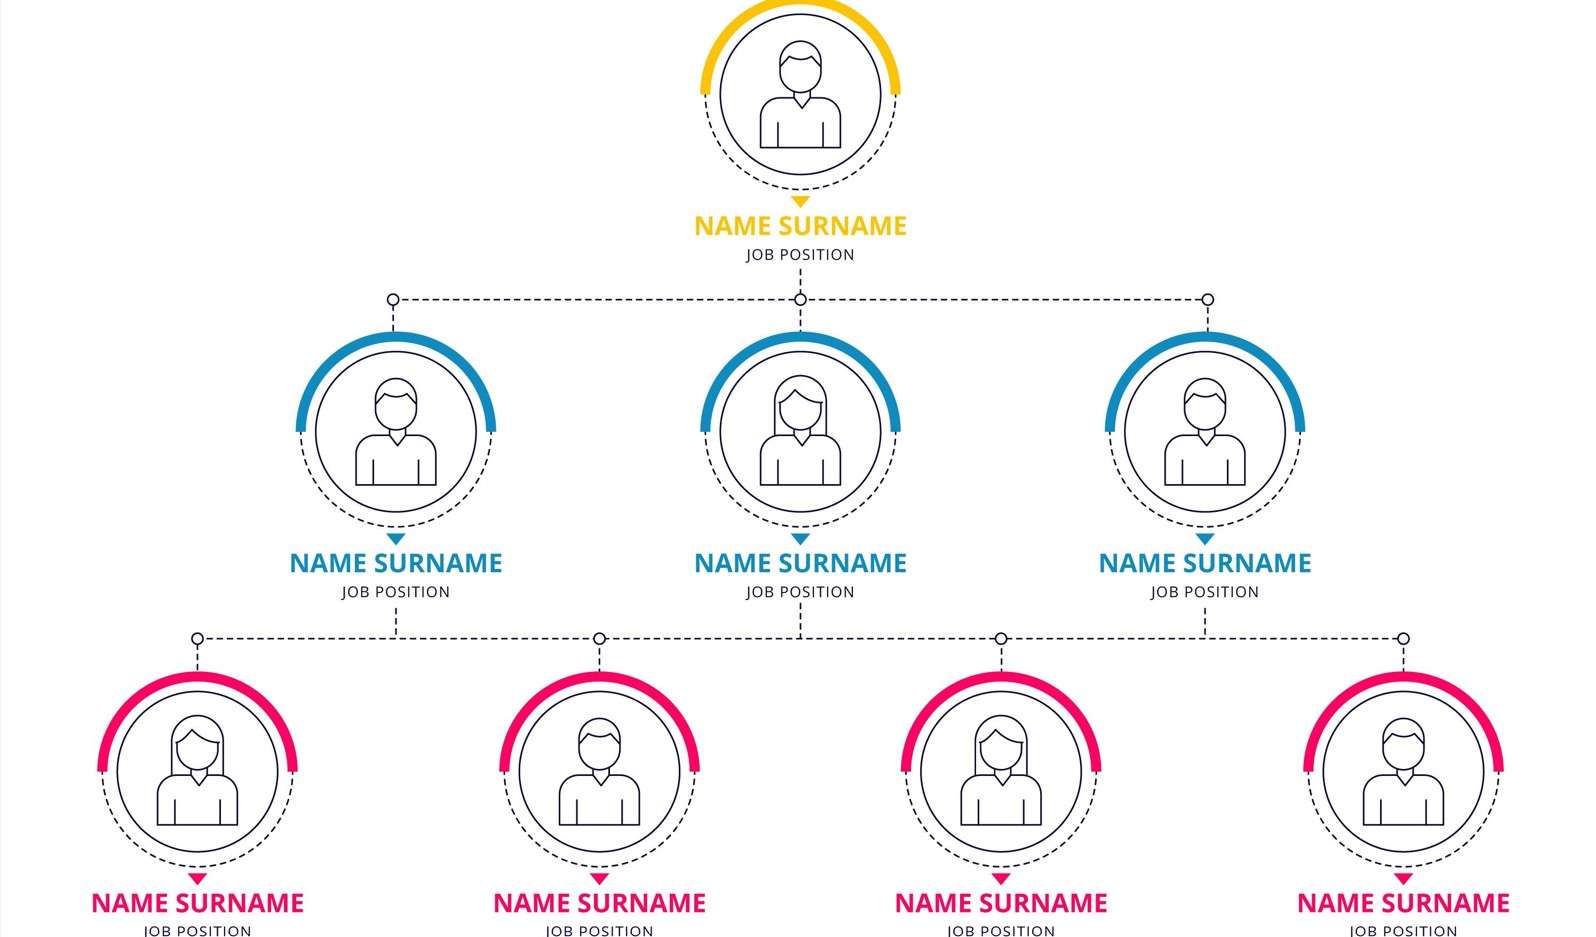
- Clear Structure: Org charts map out a clear structure of an organization, showing the hierarchy and defining individual roles, which simplifies understanding and enhances operational flow.
- Improved Communication: They help clarify who is responsible for each area, making it easier to route questions and decisions to the right person, which enhances efficiency.
- Streamlined Onboarding: For newcomers, org charts are a visual aid for better understanding their place in the organization and who their colleagues are, leading to quicker integration.
- Effective Planning: They are crucial tools for planning, as they provide a snapshot of the organization, aiding in the strategic distribution of tasks and management of organizational changes.
- Growth Strategy: Org charts serve as a foundation for spotting areas with potential for development, helping guide the strategic growth of the organization.
Conclusion
With the intricacies of power and decision-making within any robust institution, creating a Department of Energy organizational chart can often seem like a daunting task. This article has walked you through various layouts of designing an effective energy org chart. EdrawMind emerges as a powerful ally in this process, offering intuitive tools that simplify complex chart creation.
Whether you're restructuring or just starting out, EdrawMind equips you with the necessary tools to depict the hierarchy and facilitate clear communication channels within the Department of Energy. Its affordability, ease of use, and cross-platform support make it a wise choice for anyone looking to craft an org chart.
Why let the chance to streamline and enhance your organizational processes pass by? It’s time you gave EdrawMind a try and witness the transformation in your organizational communication and planning!
