


Embarking on a corporate exploration prompts a fundamental question: what is an organizational chart? Referred to colloquially as an "org chart," this visual representation serves as a dynamic compass for structured hierarchy within an organization. To truly understand the meaning of an organizational chart, it becomes imperative to define organizational chart components and the inherent meaning of an organizational chart conveys.
At its core, the organizational chart is more than a static diagram—it's a living definition of an organization's chart. To explain organizational charts it is to decode the visual language it employs, offering a tangible representation of roles. As we define the org chart, we naturally unravel its meaning, appreciating how it encapsulates the essence of an organization's internal dynamics.
In this article
Components and Characteristics of Organizational Charts
Organizational charts, commonly known as org charts, are intricate visual representations that illuminate the inner workings of a company's structure. To unravel their complexity, we must dissect the key components – boxes, lines, and titles – each pivotal role in communicating vital information about roles and relationships within the organizational hierarchy.
Boxes
The boxes representing individual positions or roles within the organization are at the core of an organizational chart. These rectangular containers encapsulate crucial details, including job titles and employee names. The placement of these boxes, whether stacked vertically or arranged horizontally, visually illustrates the hierarchy and reporting relationships within the organization.
Lines
Connecting these boxes are lines, serving as informational conduits that depict the relationships and communication channels between different roles. The type of lines convey specific meanings. Vertical lines signify direct reporting relationships, while horizontal or diagonal lines might represent lateral connections or collaborations. The interplay of lines offers insights into the flow of authority and collaboration within the organizational unit.
Titles
Titles within each box succinctly identify the role or position held by an individual. From "Manager" to "CEO," these titles quickly reference the organizational hierarchy. The font size, style, and prominence of titles further communicate each role's relative importance or seniority, offering clarity about the organizational pecking order.
Understanding the definition of organizational charts and the significance of these elements is paramount to answer the question – What is an organizational chart? Boxes, lines, and titles collectively serve as a visual language, efficiently conveying intricate details about the organizational unit. They illuminate reporting relationships, highlight the hierarchy of positions, and facilitate a swift comprehension of individuals' roles.
Types of Organizational Charts
In the vast landscape of organizational charts, various types emerge to accommodate the diverse structures and purposes within different companies. Understanding these types—hierarchical, matrix, and flat organizational charts—provides insights into their suitability for specific organizational units and goals.
1. Hierarchical Organizational Chart
The hierarchical organizational chart is the most traditional and widely used type. It arranges positions in a top-down pyramid structure, showcasing a clear chain of command. At the apex sits the highest authority, typically the CEO or president, followed by descending levels of management. This type is ideal for organizations with a well-defined and centralized structure.
2. Matrix Organizational Chart
The matrix organizational chart introduces a more complex structure, integrating horizontal and vertical reporting relationships. In this model, employees report to both functional and project managers simultaneously. This dual reporting system enhances flexibility and explains organizational charts across different functional areas. Matrix structures suit organizations engaged in diverse projects or activities, enabling cross-functional coordination.
3. Flat Organizational Chart
The flat organizational chart promotes a more egalitarian approach. It minimizes the number of hierarchical levels, fostering direct communication and quick decision-making. This type is often suitable for smaller companies, startups, or organizations emphasizing a collaborative work environment. Flat structures empower employees with greater autonomy and can enhance responsiveness to change.
The suitability of each chart type depends on an organization's specific characteristics and goals. For instance, a hierarchical chart may fit a well-established corporation, while a matrix chart might be more suitable for a project-based organization. Meanwhile, a flat organizational chart could be optimal for a startup valuing agility and open communication.
The choice of organizational chart type reflects a company's unique needs and organizational culture. Understanding what is an organizational chart equips businesses with the knowledge to select the most fitting visual representation that aligns with their structure and objectives.
Utilizing EdrawMind for Organizational Chart Creation
EdrawMind is a versatile diagramming tool that has carved a niche in simplifying the creation of visually compelling organizational charts. As a user-friendly platform, it caters to both beginners and experienced professionals, offering various features for creating visual representations, including mind maps, flowcharts, and organizational charts.
Beyond its organizational chart capabilities, EdrawMind stands out for its versatility in supporting diverse diagram types. The platform boasts an intuitive drag-and-drop interface that allows users to seamlessly add and connect elements. With an extensive library of shapes, symbols, and templates, EdrawMind enables users to customize their diagrams, fostering creativity and precision in visual communication.
Creating organizational charts in EdrawMind is a streamlined process. Users can choose from pre-designed templates or start from scratch, selecting the template that aligns with their organizational unit. EdrawMind's real-time collaboration features further enhance the chart creation process, allowing multiple users to work on the same chart simultaneously, fostering teamwork and expediting the creation timeline.
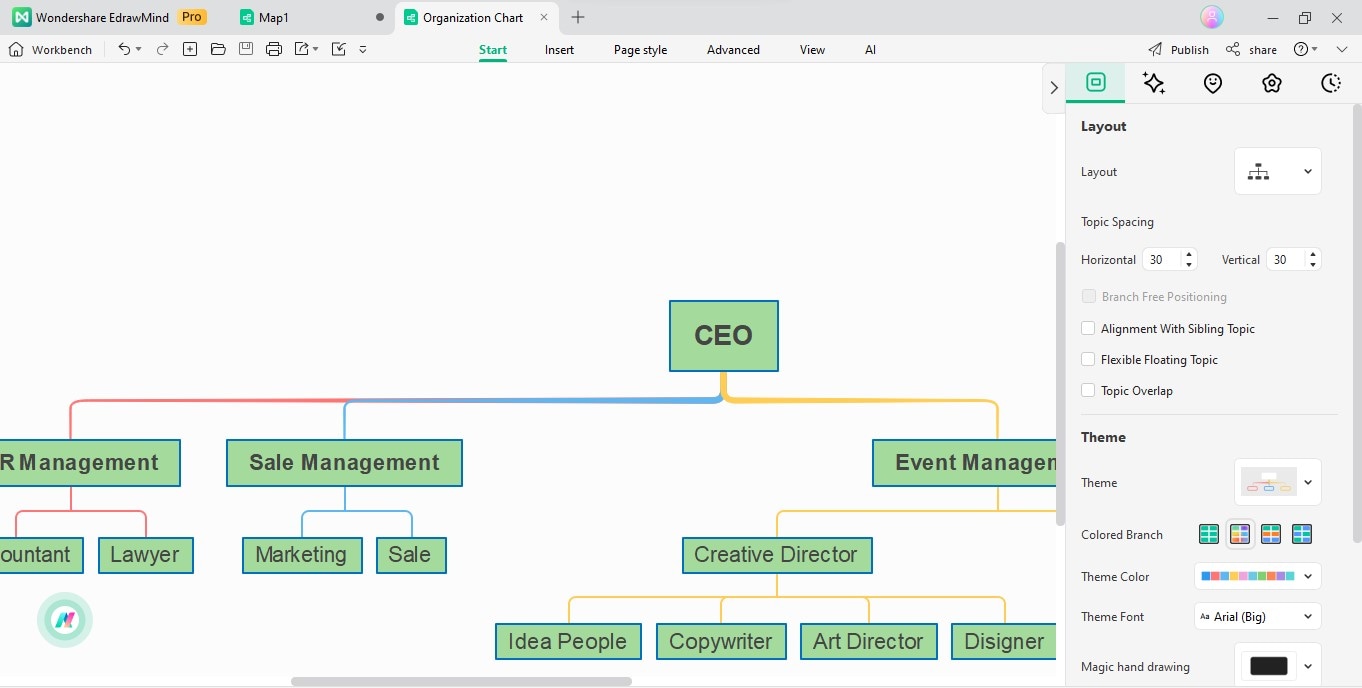
Step-by-Step Guide for Creating Organizational Charts in EdrawMind
Navigating the intricate landscape of organizational structures has never been more seamless than with EdrawMind, a versatile diagramming tool designed to simplify the creation of visually captivating organizational charts. Now, let's delve into a step-by-step guide to unleash the full potential of EdrawMind for creating organizational charts that not only elucidate but also captivate.
Step 1:Select a Template
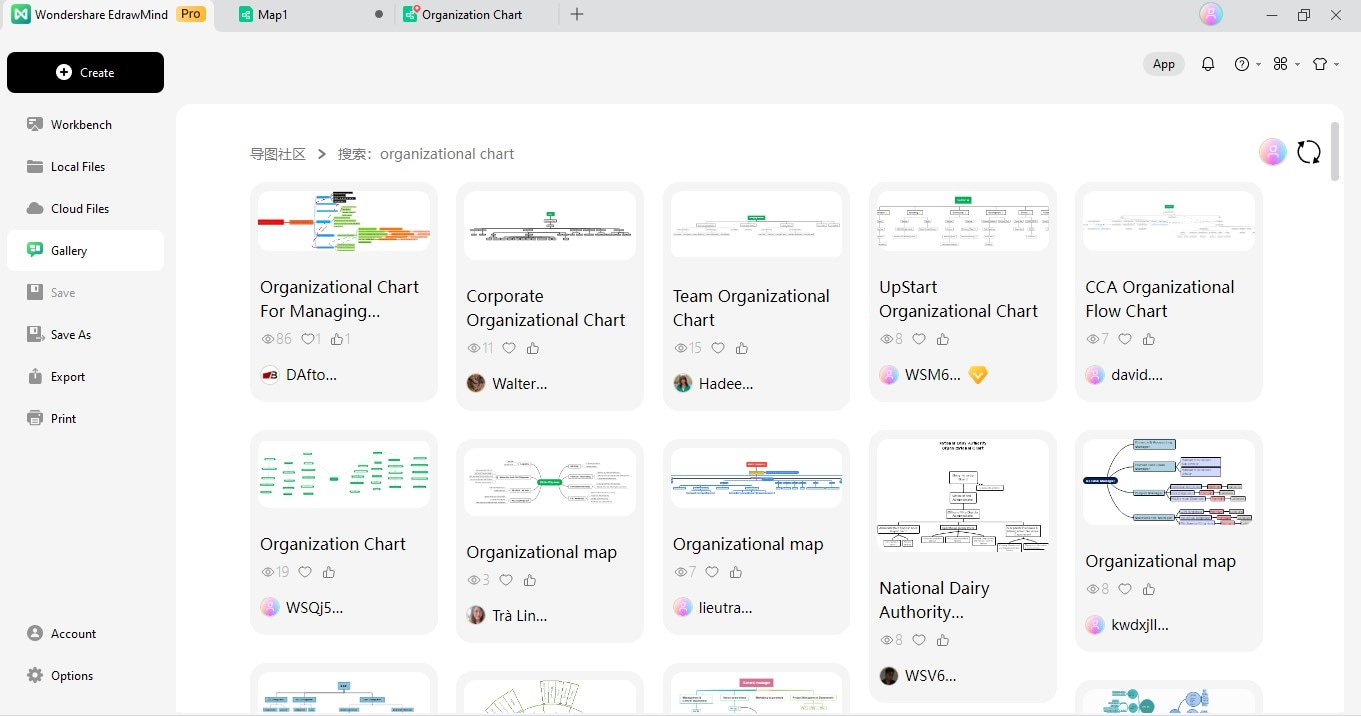
Choose an organizational chart template that best fits your organizational structure.
Step 2:Add Shapes
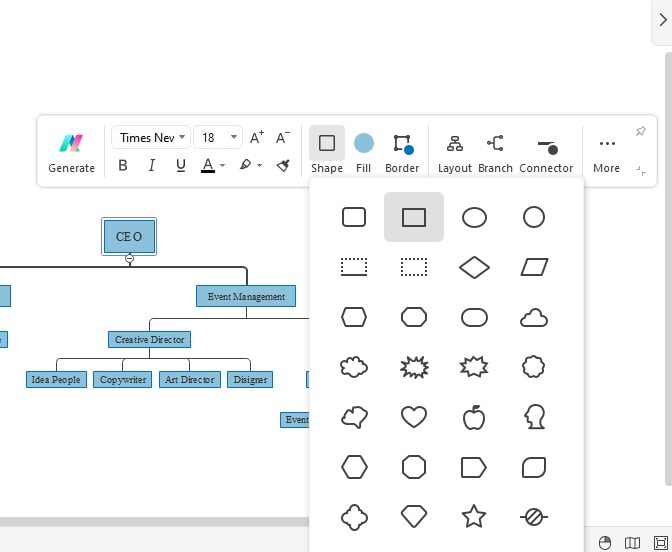
Drag and drop shapes onto the canvas to represent positions within the organization.
Step 3:Connect Shapes
Use lines to establish reporting relationships between different positions.
Step 3:Add Titles
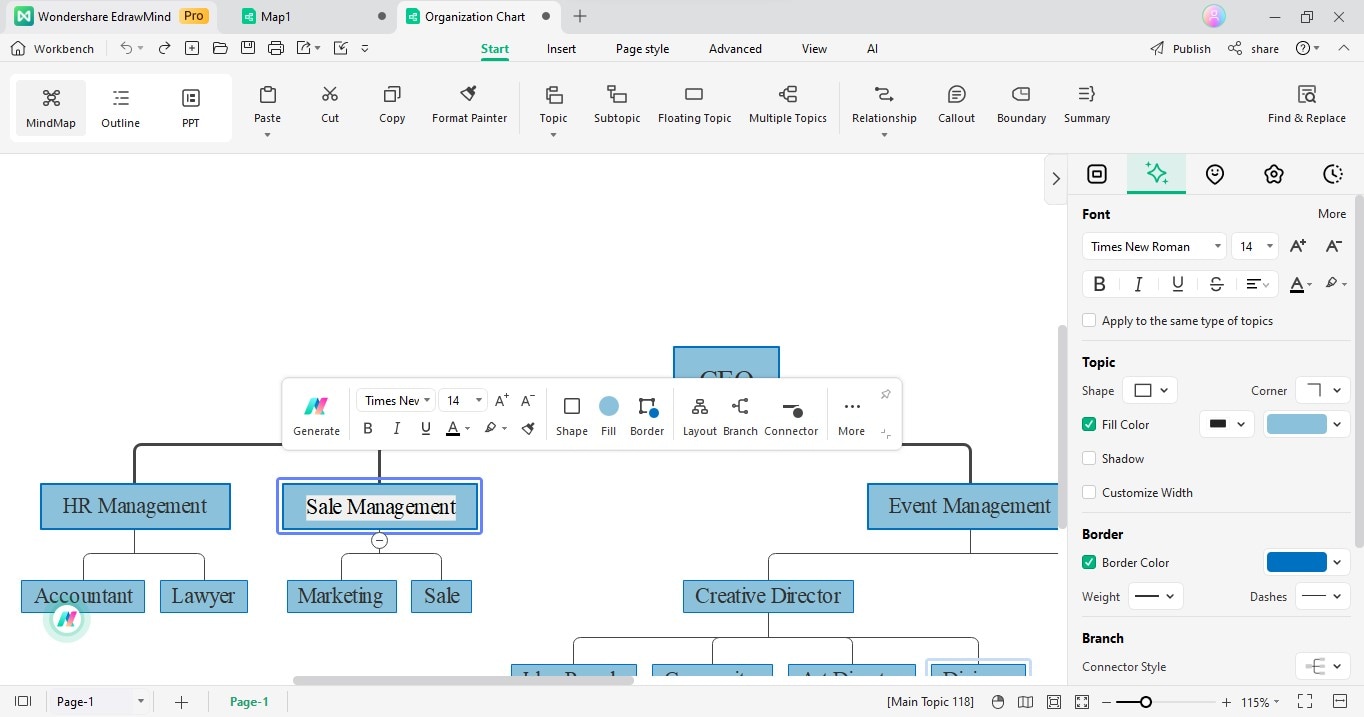
Populate each shape with titles, specifying the role or position individuals hold.
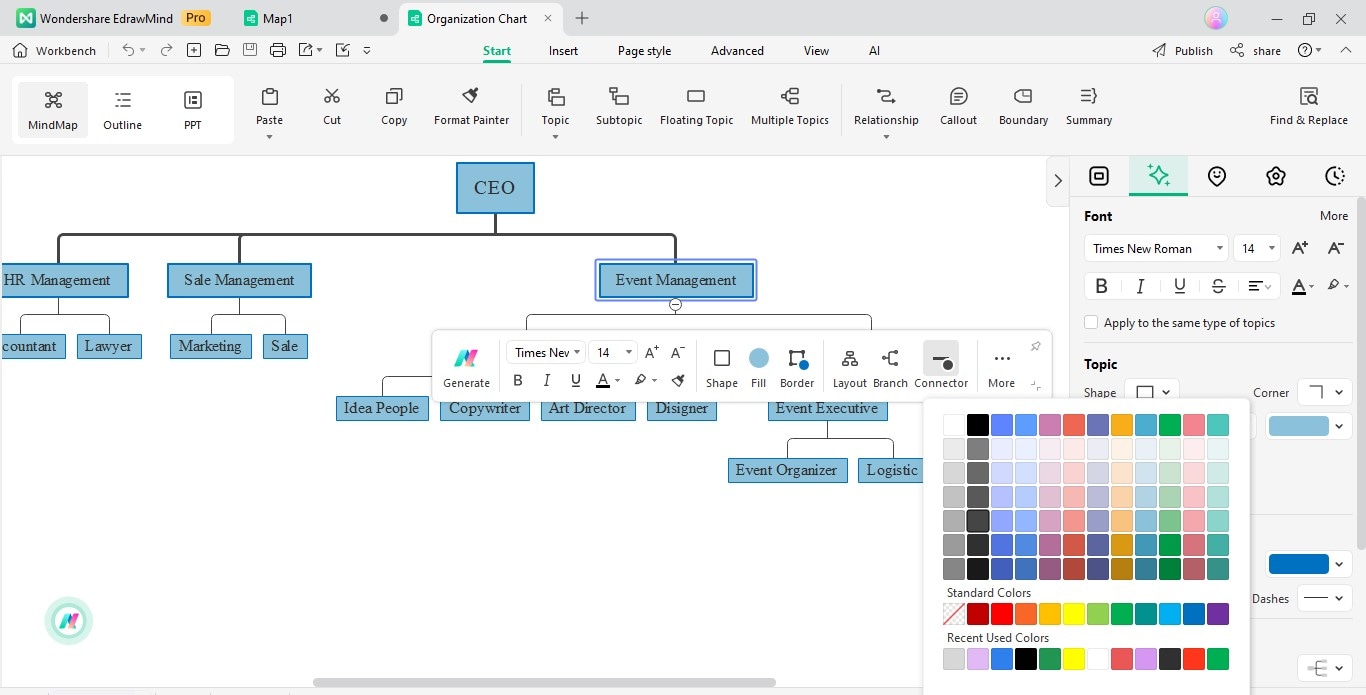
Step 4:Customize Details
Explore customization options for colors, shapes, and additional details to enhance visual appeal.
Collaborative Features in EdrawMind
The benefits of EdrawMind's collaborative features become apparent in understanding what is an organizational chart. Team members can collectively contribute to creating and editing organizational charts, ensuring a synchronized and efficient workflow. Here are the unique feature of EdrawMind:
- Share and Collaborate
EdrawMind facilitates real-time collaboration, allowing team members to edit and contribute simultaneously.
- Commenting and Annotations
Users can leave comments and annotations, fostering effective communication within the collaborative environment.
- Version History
EdrawMind maintains a version history, enabling users to track changes and revert to previous states if needed.
Conclusion
Understanding What an Organizational Chart and its significance delineates hierarchies and reports relationships, fostering transparency and streamlining communication. Their significance lies in providing a clear snapshot of an organization's composition, aiding decision-making, and enhancing overall efficiency.
As we conclude this exploration, EdrawMind emerges as a valuable ally in crafting these visual representations. Its user-friendly features and collaborative capabilities simplify the creation process and enhance organizational efficiency. Embracing tools like EdrawMind becomes a gateway to fostering a transparency and effective communication culture, propelling organizations toward success in an ever-evolving landscape.
