Need to show a project timeline? A Gantt chart is best for this task. However, Google Slides doesn't have a built-in way to make a Gantt chart, which is a helpful tool for project planning.
This article will show how to make a Gantt Chart in Google Slides in two ways. We'll break the process down into simple steps so you can easily visualize your project schedule. By the end of this guide, you'll be a Gantt chart pro, ready to impress your team and keep your projects on track.
In this article
How To Make a Gantt Chart in Google Slides?
In project management, a Gantt chart is a bar chart-like timeline that visually maps out a project's schedule. Tasks are listed horizontally, with bars showing how long each one takes. It even highlights task dependencies, helping you spot potential roadblocks before they arise.
The good news? You can create a Gantt chart in Google Slides. Just like other Google Suite tools, Slides offers functionalities beyond presentations. While it doesn't have a built-in Gantt chart creator, you can achieve a similar outcome using a combination of features. Here's a quick guide on how to make a Gantt chart in Google Slides:
Step 1
List the project tasks, their start and end dates (or durations), and any dependencies between tasks.
Step 2
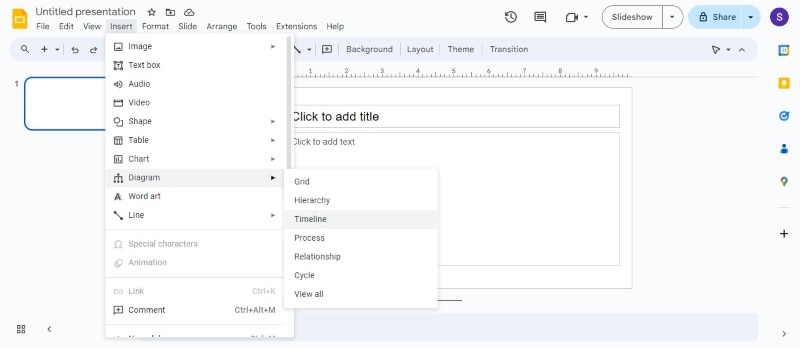
In Google Slide, go to Insert > Diagram > Timeline from the upper navigation menu.
Step 3
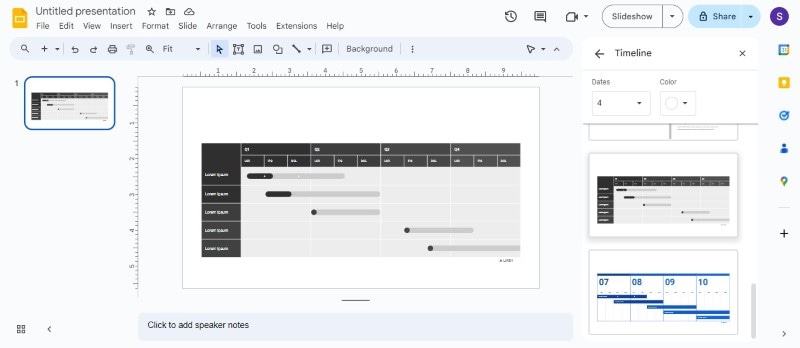
Choose a timeline layout that resembles the Gantt chart on the right panel.
Step 4
Click and edit the shapes on the timeline to represent your tasks. Adjust the length of the shapes based on the task durations in the Google Sheet.
Step 5
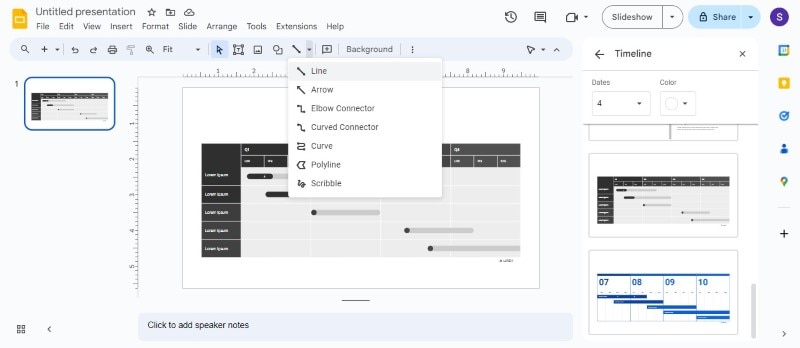
Label each rectangle with the corresponding task name. Use different colors to differentiate tasks or highlight dependencies between them with arrows. Utilize Google Slides' formatting options to create a visually appealing and informative Gantt chart.
Optional: Use Google Sheets
Using Google Sheets is better for projects with many tasks and connections between them. That's because it provides a more structured table format to organize your project data, so it's easier to manage and update. You can make your Gantt chart in Sheets and insert it into your Google Slides presentation. Here's how:
Step 1
Create a Gantt chart template in Google Sheets with columns for tasks, start dates, durations, etc.
Step 2
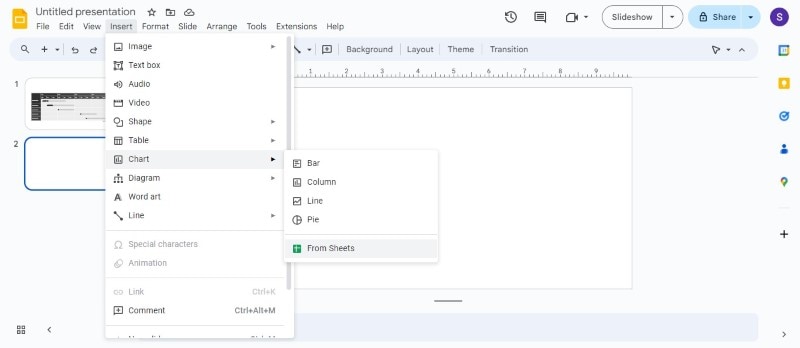
In Google Slides, insert a chart by navigating to Insert > Chart > From Sheets from the top menu.
Step 3 Import Pre-Made Gantt Chart
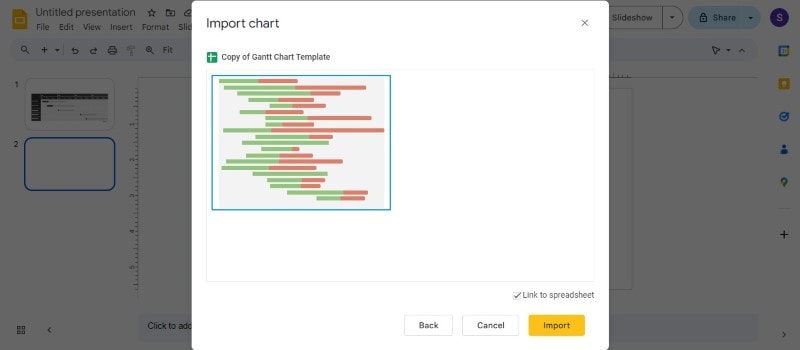
Choose the pre-made Gantt chart template from Google Drive and click Import. It creates a linked chart that updates automatically whenever you modify the data in your Google Sheet.
If you're already familiar with Google Slides, creating a basic Gantt chart is quick and easy. Also, being part of Google Suite, Slides allows real-time collaboration on your project timeline with your team members. However, Google Slides doesn't offer advanced features like automatic calculations or resource allocation often found in dedicated Gantt chart software like EdrawMind.
How To Make Gantt Charts for Google Slides in a Faster and Easier Way
While Google Slides is a fantastic tool for presentations, it wasn't designed to create complex diagrams like Gantt charts. This can make building a Gantt chart in Google Slides a bit time-consuming.
Wondershare EdrawMind can help you create Gantt charts for Google Slides quickly and easily. This user-friendly diagramming tool works on many devices, so you can use it on any computer. EdrawMind makes it simple to add tasks, set priorities, track progress, and define durations – all in just a few clicks.
Here's how EdrawMind can help you create a Gantt chart and then how to add it to your Google Slides presentation:
Step 1
Download and install the EdrawMind desktop version to a PC. Alternatively, try it online on a web browser for free.
Step 2
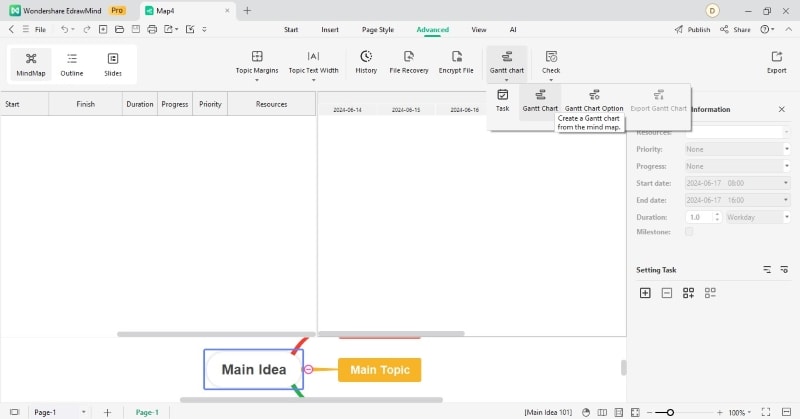
Go to the Advanced tab from the upper navigation menu and select Gantt Chart.
Tip: Search and customize a Gantt chart template on EdrawMind with the project details, including tasks, durations, and dependencies.
Step 3
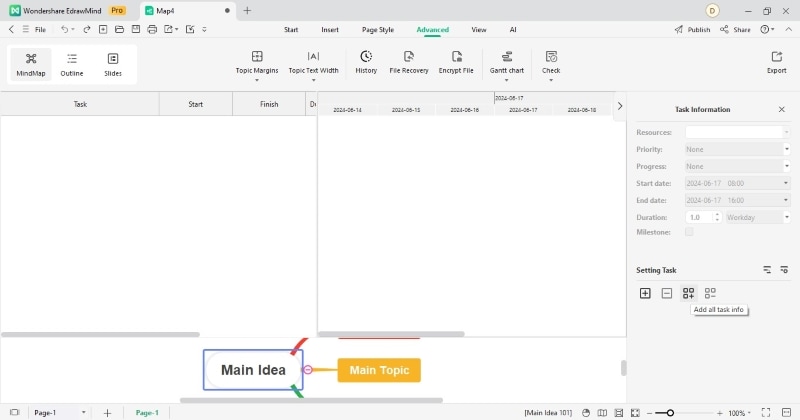
Click Add all task info from the Setting Task section in the right panel.
Step 4: Edits Details for Tasks
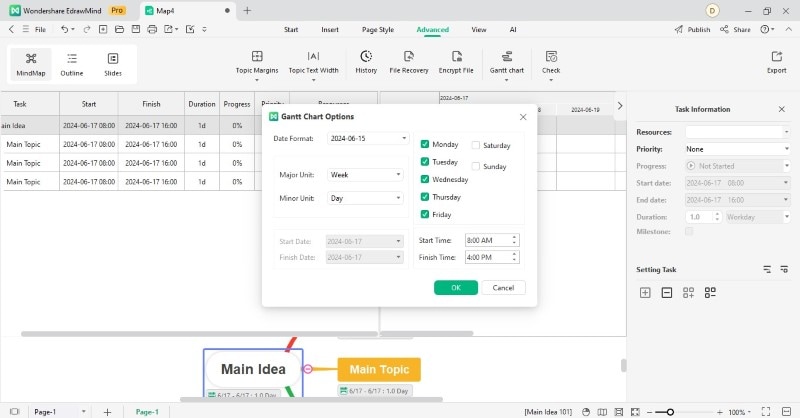
Add, edit, and format the tasks within the Gantt chart. Go to Gantt Chart > Gantt Chart Option from the top menu. Define the Date Format, select the specific days to show on the chart, and choose the time unit to be displayed.
Step 5: Export Gantt Charts as PDFs
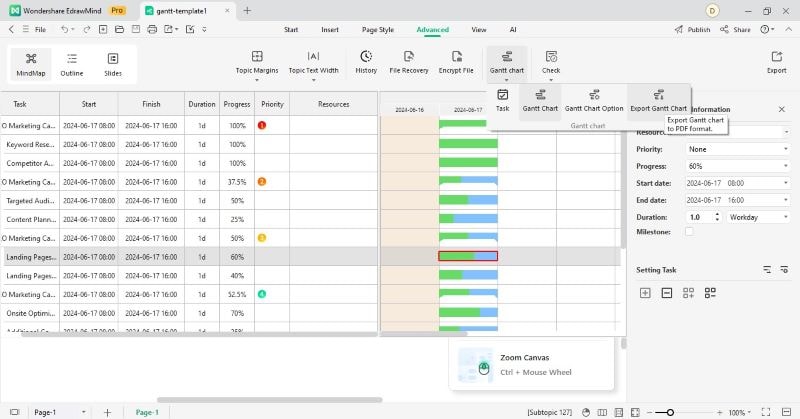
Once the Gantt chart is complete, go to the Advanced tab in the upper navigation pane. Select Export Gantt Chart from the Gantt Chart dropdown menu and save it as a PDF file.
Step 6
Use PDF to JPG converters like PDFelement to change the file type.
Step 7: Upload Gantt Charts JPG to Google Slides
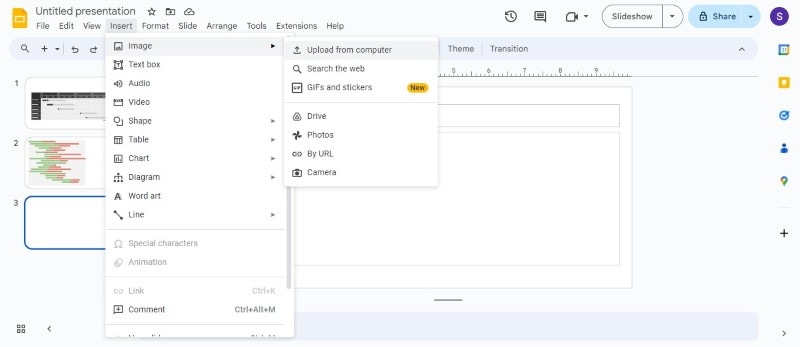
In Google Slides, navigate to the slide for which you want to include the Gantt chart. Go to Insert > Image > Upload from computer in the upper navigation pane.
Step 8
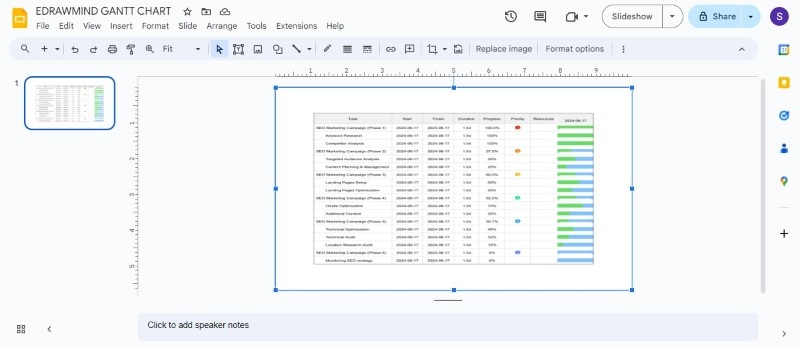
Upload the JPG or PNG file of the Gantt chart made from EdrawMind. Resize and position the image on the slide to fit the layout.
What Is Wondershare EdrawMind?
Wondershare EdrawMind is a mind-mapping software that comes in both free and paid versions. Its mind-mapping functionality lets you brainstorm and organize tasks for your project. You can then convert this mind map into a Gantt chart. This can be useful for getting a quick visual representation of your project timeline with start and end dates for tasks.
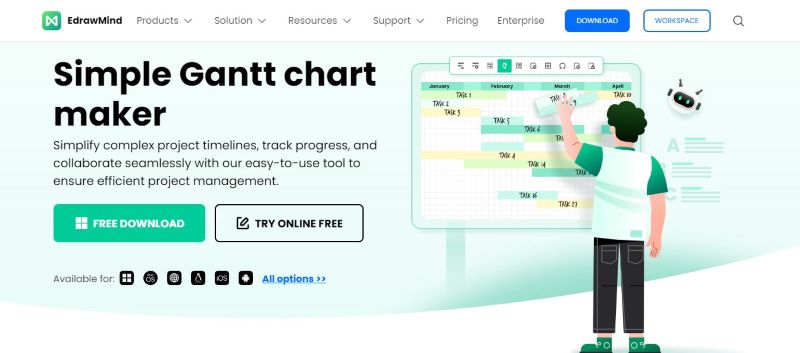
Here's how EdrawMind can help you become more efficient in project management:
- Visualize tasks, dependencies, timelines, and resource allocation: EdrawMind helps you see your entire project clearly and organized. It can help you identify potential delays or bottlenecks early on.
- Track milestones and project progress: Easily monitor your project's progress and see how close you are to meeting your deadlines.
- Plan projects, events, and product development: Use EdrawMind to brainstorm ideas, create a project roadmap, and track your progress.
Key Features
EdrawMind offers several key features that can be beneficial for users:
Templates Gallery
Get started quickly with 1000+ pre-designed mind maps on various topics, including a Gantt chart template. EdrawMind saves you time and ensures a professional look for your project.
Real-time Collaboration
Work with your team members on the same mind map and Gantt chart simultaneously online. It is a great way to share ideas and get real-time feedback.
Cross-Platform Compatibility
Access and edit your Gantt chart from any device using Windows, Mac, Linux, Android, iOS, or even working online through a web browser. EdrawMind lets you work remotely from home, in the office, or anywhere else.
AI Tools
Take advantage of its AI integration to generate mind maps, create presentation slides, and convert mind maps to videos. You can also use its AI summarization to extract key points from your work.
Conclusion
No matter your project management style, this article has you covered. This beginner's guide explored two ways to use Google Slides: How to make a Gantt chart in Google Slides using Slides or using a Gantt chart maker. Both approaches offer flexibility but require effort. For a faster option, pre-made templates can save valuable time.
The verdict? Google Slides is a good choice for creating basic Gantt charts, especially when you need them quickly. But for complex projects or frequent diagramming needs, Wondershare EdrawMind is a better solution. It is easy to use and has extensive Gantt chart templates with diagramming tools.


