A Gantt chart is a powerful visual tool used in project management to illustrate project schedules and timelines. It presents tasks or activities as horizontal bars along a timeline, allowing project managers and team members to see the sequence of activities, their durations, and their dependencies at a glance. Named after its inventor, Henry Gantt, this chart provides a clear overview of project progress and helps in planning, scheduling, and monitoring tasks effectively.
The importance of Gantt charts lies in their ability to enhance project organization and communication. By visualizing project timelines, dependencies, and resource allocation, Gantt charts facilitate better planning and coordination among team members. They offer a structured framework for project managers to prioritize tasks, set realistic deadlines, and allocate resources efficiently. Continue reading below to learn more.
In this article
How To Make A Gantt Chart In Google Sheets
Creating a Gantt chart in Google Sheets is a straightforward process that can greatly enhance your project management capabilities. Follow these steps to make your own Gantt chart:
Set Up Your Spreadsheet
Open Google Sheets and create a new spreadsheet. In the first column, list your project tasks or activities. In the subsequent columns, input the start date, end date, and duration of each task. You can also include additional columns for task dependencies, responsible team members, or any other relevant information.
Format Your Data
Format your data in a way that makes it easy to work with. Ensure that the start dates, end dates, and durations are entered accurately. You may need to adjust the column widths and formatting to make the data more visually appealing and easier to understand.
Insert a Bar Chart
Select the range of cells containing your project data, including the task names, start dates, end dates, and durations. Then, navigate to the "Insert" menu and choose "Chart." Select "Bar chart" from the chart types and click "Insert." This will create a basic bar chart based on your project data.
Customize Your Chart
Once the chart is inserted, you can customize it to turn it into a Gantt chart. Click on the chart to select it, then click on the three dots in the upper right corner of the chart and choose "Edit chart." In the Chart editor panel, under "Chart type," select "Stacked bar chart." This will transform your bar chart into a Gantt chart.
Finalize Your Gantt Chart
Customize the appearance of your Gantt chart by adjusting the colors, labels, and other visual elements as needed. You can also add a title and axis labels to make the chart easier to interpret. Once you're satisfied with the chart, close the Chart editor panel.
The Best Google Sheet Alternative for Gantt Charts
If you're searching for a versatile alternative to Google Sheets for crafting Gantt charts, EdrawMind emerges as an exceptional solution. EdrawMind presents a comprehensive suite of features tailored to streamline project management tasks, including the creation of Gantt charts. With its intuitive interface and robust functionalities, EdrawMind offers a seamless experience for visualizing project timelines and tracking progress.
EdrawMind stands out for its user-friendly interface, which makes it accessible to users of all proficiency levels. Whether you're a seasoned project manager or a novice, its intuitive design and straightforward navigation simplify the creation of intricate Gantt charts.
Furthermore, EdrawMind excels in simplicity and boasts advanced features essential for efficient project management. From task dependencies and critical path analysis to resource allocation and timeline adjustments, it equips users with the tools necessary to meticulously plan, monitor, and execute projects of any scale.
Step-by-step Guide on How to Use EdrawMind in Making a Gantt Chart
Creating a Gantt Chart in EdrawMind is a straightforward process. Here's a step-by-step guide to help you get started:
Open EdrawMind
Launch the EdrawMind application on your device or access it through your web browser.
Select a Gantt Chart Template
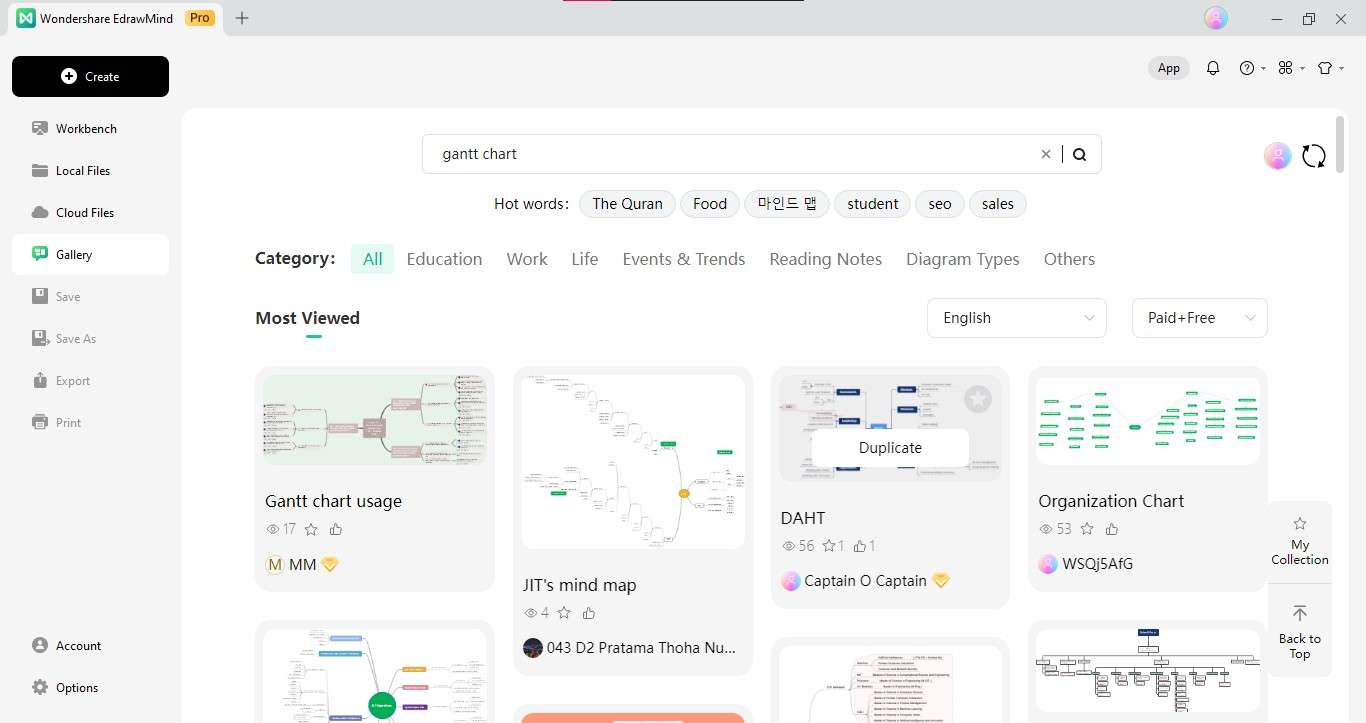
Once you're in the EdrawMind interface, choose a Gantt chart template to begin your project. You can select a pre-designed template from the template library, start with a blank canvas, and build your Gantt chart from scratch.
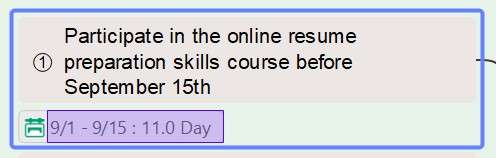
Add Tasks
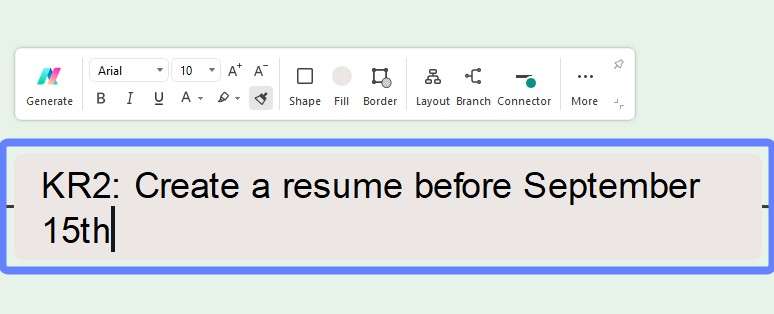
Begin by adding tasks to your Gantt chart. Click on the relevant section of the chart and enter the task name. You can also include additional details such as task duration, start and end date, and other relevant information.
Adjust Timeline
Customize the timeline of your Gantt chart to reflect the project schedule. Drag and drop tasks along the timeline to adjust their start and end dates as needed. You can also resize tasks to modify their duration.
Set Task Dependencies
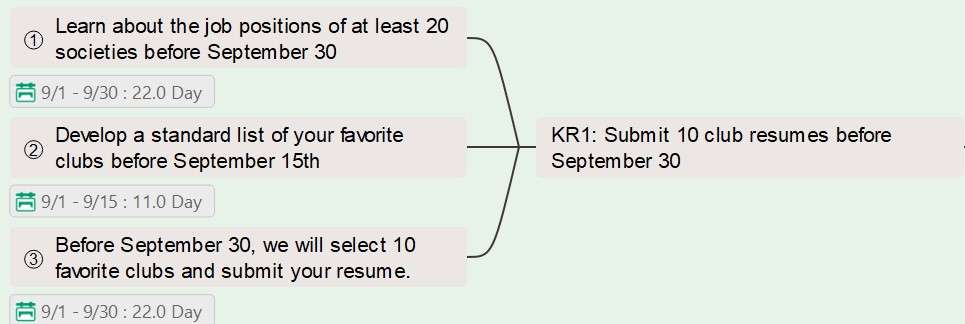
Establish task dependencies to outline the sequence of activities in your project. Identify tasks that are dependent on one another and link them accordingly. This helps in visualizing the flow of work and ensures that tasks are completed in the correct order.
Customize Appearance
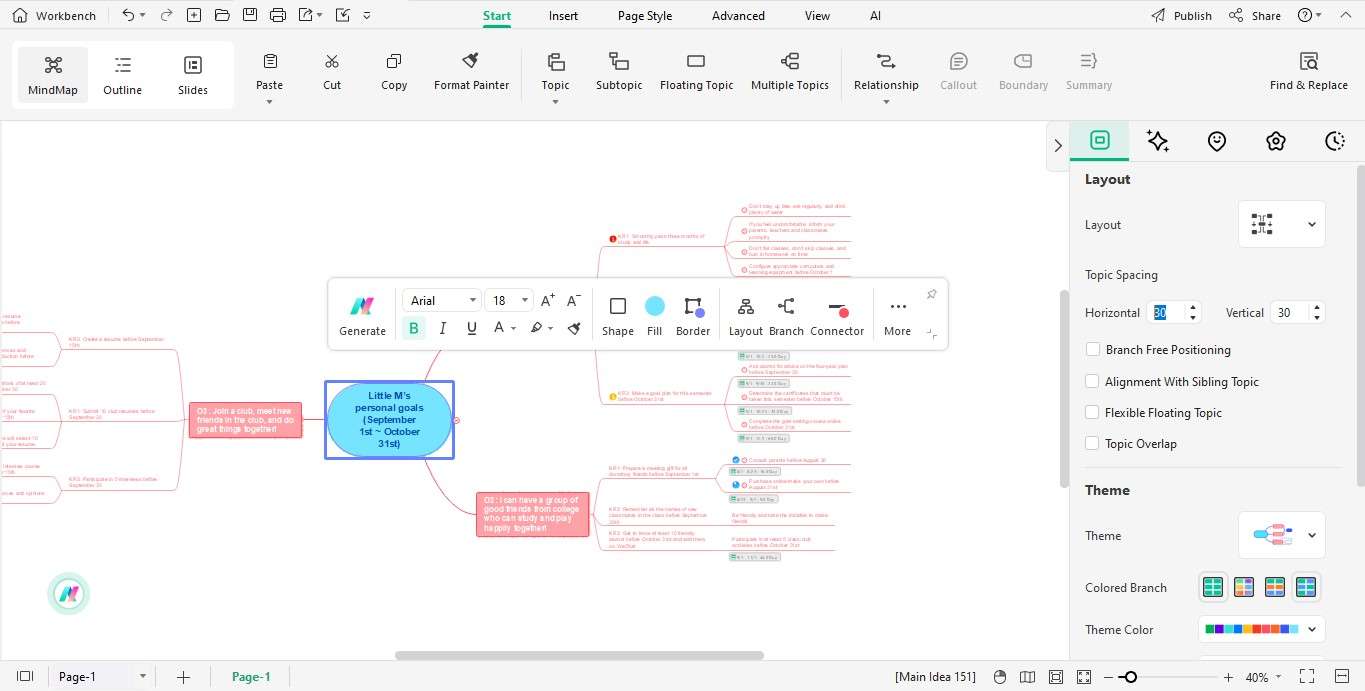
You can customize the appearance of your Gantt chart to suit your preferences and project requirements. Adjust colors, fonts, shapes, and other visual elements to make your Gantt chart appealing and easy to understand.
Collaborate with Team Members
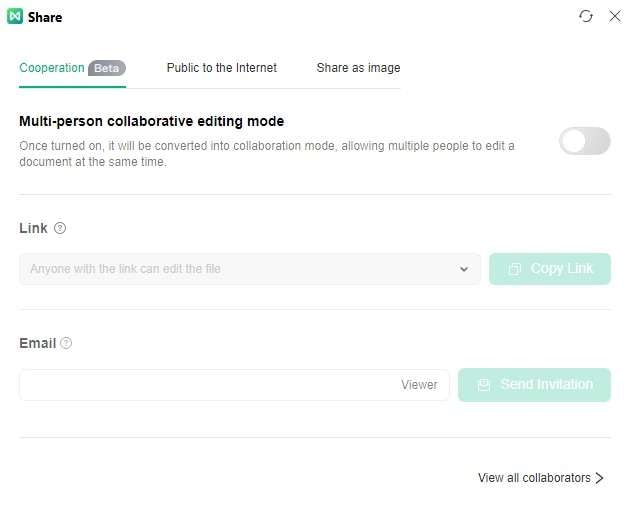
Share your Gantt chart with team members to collaborate in real-time. Invite colleagues to view, comment on, and edit the chart, ensuring everyone stays informed and aligned throughout the project.
Save and Export
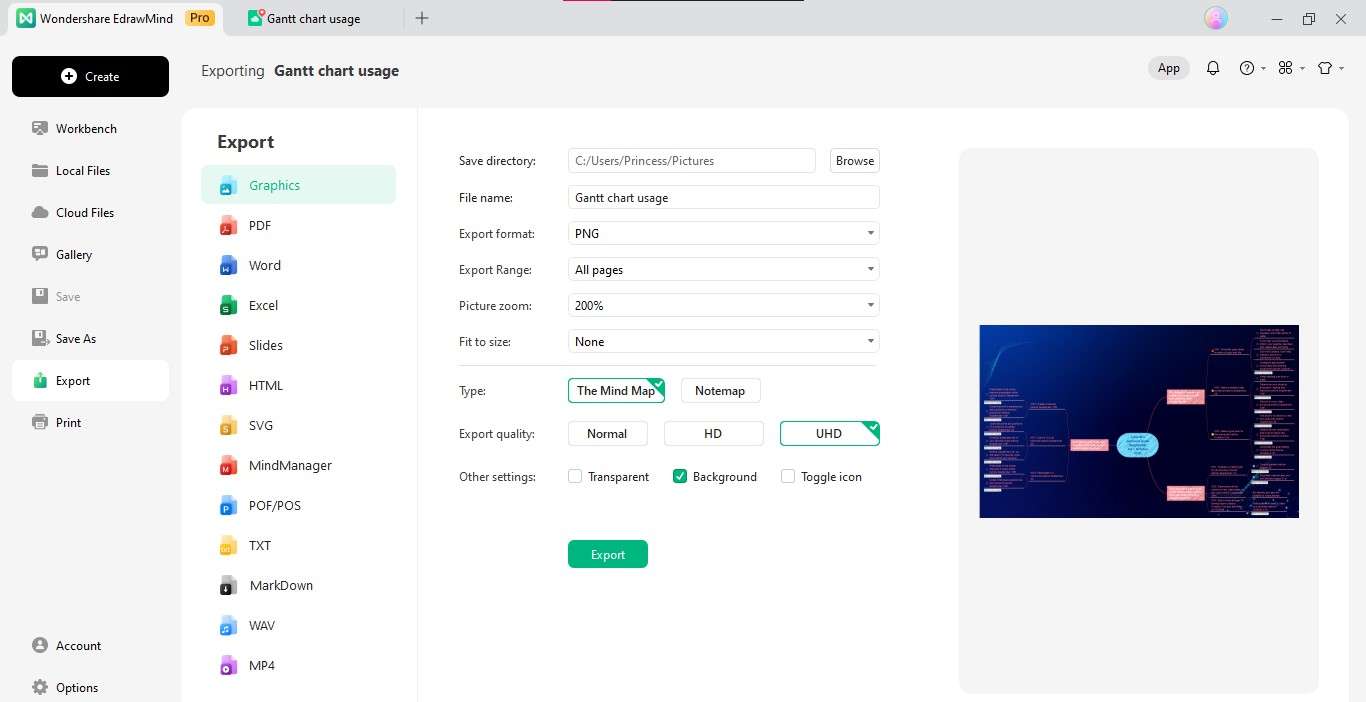
Once you've finalized your Gantt chart, save your work to preserve your progress. EdrawMind allows you to export your Gantt chart in various formats, such as PDF, PNG, or Excel, making it easy to share with stakeholders or integrate into project documentation.
Following these steps, you can create a comprehensive Gantt chart in EdrawMind to effectively plan, manage, and track your projects.
Why Use EdrawMind to Create a Gantt Chart?
Using EdrawMind to create Gantt charts offers a range of benefits that streamline project management and enhance collaboration. Here are some key advantages:
User-Friendly Interface
EdrawMind features an intuitive interface that makes it easy for users of all skill levels to create Gantt charts. With its drag-and-drop functionality and simple design, EdrawMind simplifies the process of building complex project timelines.
Advanced Functionality
EdrawMind offers advanced features essential for effective project management, such as task dependencies, critical path analysis, and resource allocation. These features enable users to create detailed and accurate Gantt charts that reflect the intricacies of their projects.
Customization Options
EdrawMind provides a wide range of customization options, allowing users to tailor their Gantt charts to suit their preferences and project requirements. Users can adjust colors, fonts, shapes, and other visual elements to create visually appealing and informative Gantt charts.
Real-Time Collaboration
EdrawMind facilitates seamless collaboration among team members with real-time sharing, commenting, and editing capabilities. Team members can work together on Gantt charts regardless of location, ensuring everyone stays aligned and informed throughout the project.
Integration
EdrawMind integrates with other project management tools and platforms, allowing for smooth data exchange and workflow integration. Users can import data from external sources, such as Excel or Google Sheets, and export Gantt charts in various formats for sharing and documentation purposes.
Accessibility
EdrawMind is accessible across multiple devices and platforms, including desktop computers, tablets, and smartphones. This ensures users can access and work on their Gantt charts anytime, anywhere, making it ideal for remote teams and on-the-go project managers.
Conclusion
This article has provided an insightful guide to creating Gantt charts, showcasing both Google Sheets and the alternative tool, EdrawMind. We explored the significance of Gantt charts in project management and detailed the step-by-step process for crafting them on both platforms. While Google Sheets offers a familiar option, EdrawMind emerges as a compelling alternative with its user-friendly interface, advanced functionalities, real-time collaboration features, and cross-device accessibility. As project management becomes increasingly dynamic and collaborative, embracing EdrawMind as a tool for creating Gantt charts streamlines project workflows and fosters enhanced team communication and productivity.