


Creating a Gantt Chart can be tricky for beginners; even expert project managers wonder how to make aGantt PowerPoint and gantt chart in other software! So, the Gantt Chart is a bar chart project management tool that helps to illustrate and define a project's schedule. This tool can track a project process while marking the priority of a task. Gantt Chart is also used to plan things out in day-to-day life or make a schedule for the long run.
Moreover, we will cover how to create a Gantt Chart in EdrawMind, discuss its features, and more.
In this article
What is a Gantt Chart?
Gantt Chart is a project management tool that illustrates each parameter and milestone of the project, including the tasks to be done, starting and ending dates of the tasks, task dependencies, assignees, etc. The Gantt Chart is divided into two portions:
- Task Table
- Timeline View Pane
Gantt Chart briefly gives a visual overview of a project, including the tasks that should be done within a particular period while relating to the planned time for each task. This horizontal bar chart includes these measurements: beginning and ending date of the task, milestones, dependencies between tasks, assignees, and more.
Why is the Gantt Chart Necessary?
Gantt Chart is a valuable project management tool, and maintaining one can help you get rid of these issues:
- Poor Quality of Work:The Gantt Chart helps to break the tasks into smaller pieces, so by following it thoroughly while actively monitoring, you can easily avoid poor performance from the collaborators.
- Delay of a Task: TheGantt Chart helps monitor each task's timeline while visualizing each step. Communicating with your peers allows you to balance things out before any delay occurs.
- Complications of a Task:Some tasks are complicated, and sometimes, it is exceptionally critical to visualize the outcome. By making a Gantt Chart and following it daily, you can eliminate the complications that can block your vision of the project.
How do you create a Gantt Chart in PowerPoint?
Gantt charts can be made using various software, including PowerPoint. However, as PowerPoint is considered one of the best choices when making a presentation, Excel has better charting capabilities. Thus, You have to make a table in Excel first and then import it to PowerPoint, as putting the data in PowerPoint directly can be tricky for beginners.
Here are some steps that will help you to make a Gantt Chart in a PPT template:
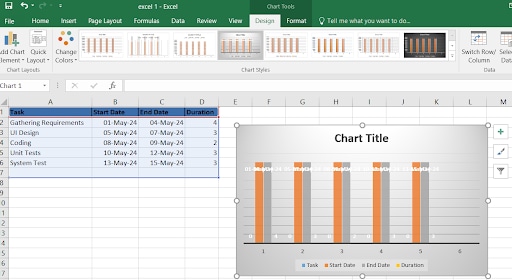
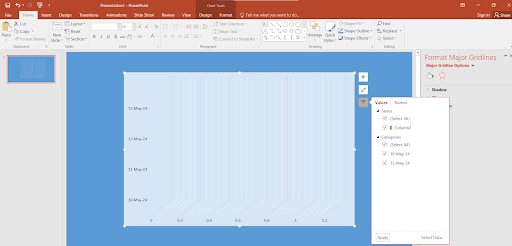
Step 1:Open an Excel Sheet on your system, insert project data, and save the file. Later, you can import the data or the Excel file to PowerPoint.
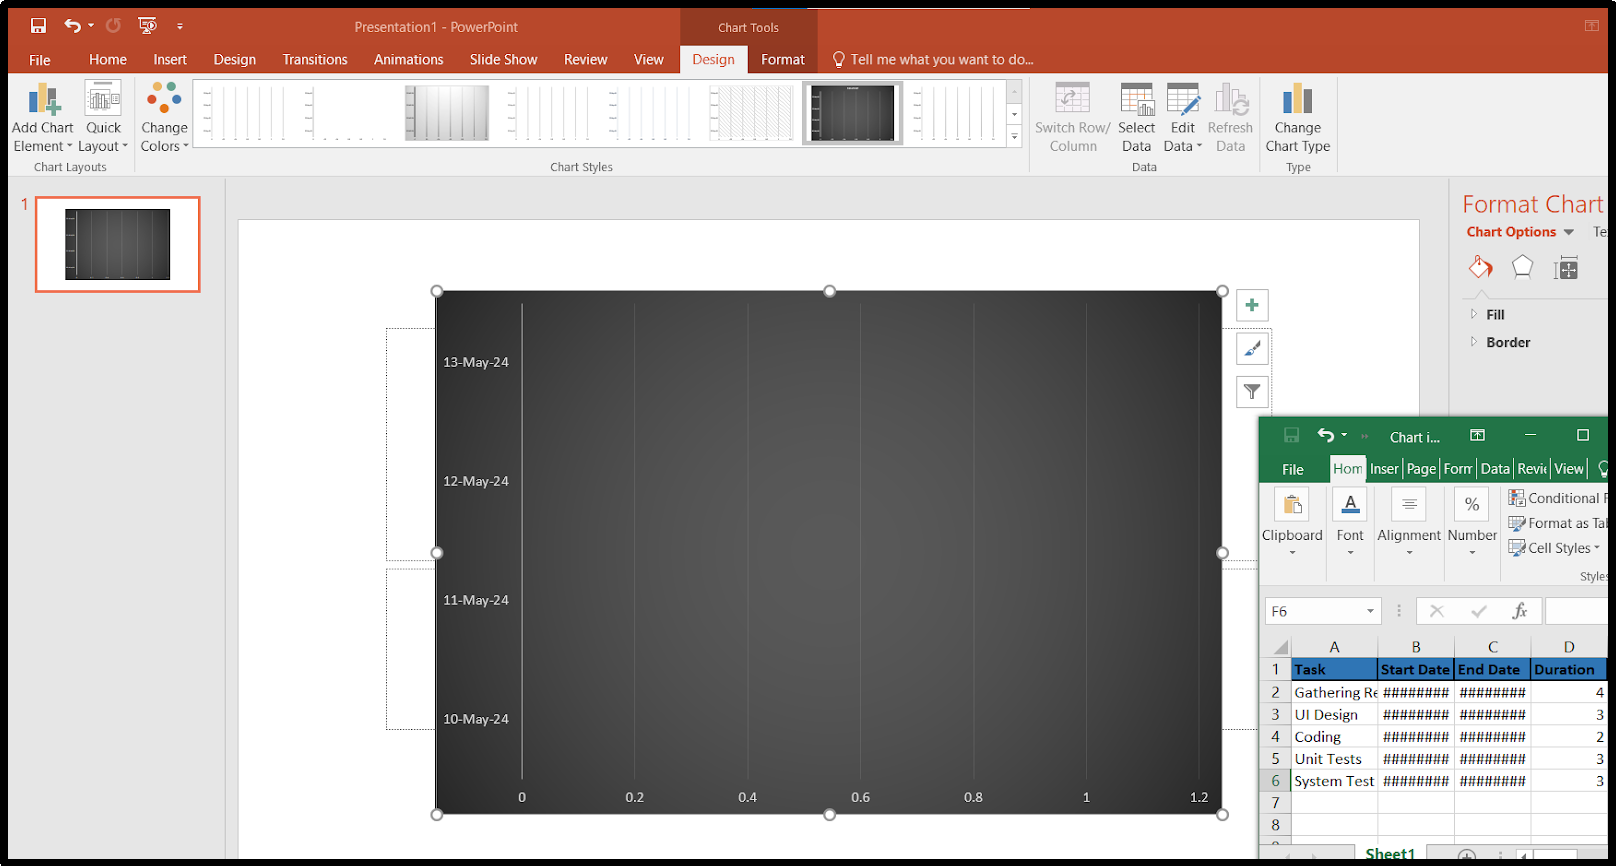
Step 2:After exporting the chart from Excel, select a suitable Gantt Chart template in PowerPoint so it is easier for other collaborators to use.
Step 3:After doing all this, if you see some major milestones missing from the chart, add them to the empty cells using PowerPoint's drawing tool. Later, you also change a few font colors for certain parameters to make it easier to understand.
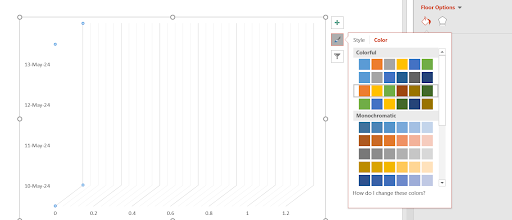
Step 4:The Gantt Chart PowerPoint template allows you to use various formatting options, such as fonts and colors. Use the Smart Guide feature to align your Gantt chart elements quickly.
By following these steps, you can create a Gantt Chart in PowerPoint.
Advantages and Disadvantages of Creating a Gantt Chart in PowerPoint
PowerPoint is the first choice of many when it comes to making slides; however, for many reasons, it can be tricky for beginners or experts to make a Gantt Chart in PowerPoint. Here are some advantages and disadvantages of making a Gantt Chart in PowerPoint:
How do you make a Gantt Chart in EdrawMind?
EdrawMind is a mind-mapping tool for structuring knowledge and ideas. It is accessible from various operating systems, such as Windows, macOS, Linux, iOS, and Android, and can also be used online.
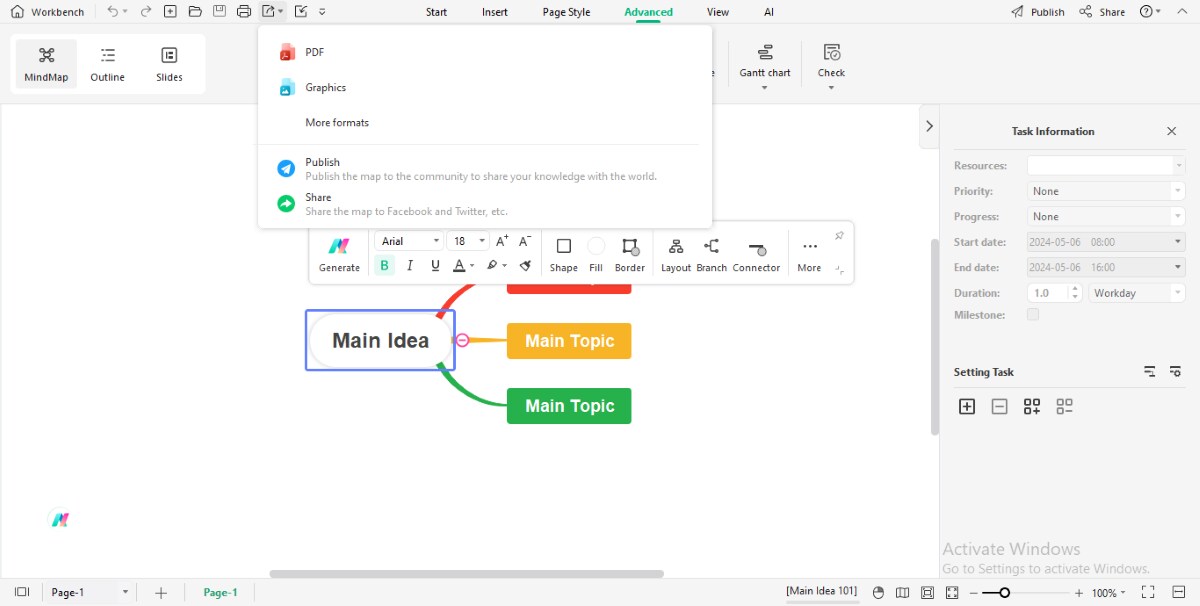
Step 1:Sign up or log in to your EdrawMind account. Then, click on the Advanced tab in the Navigation pane and click on Gantt Chart.
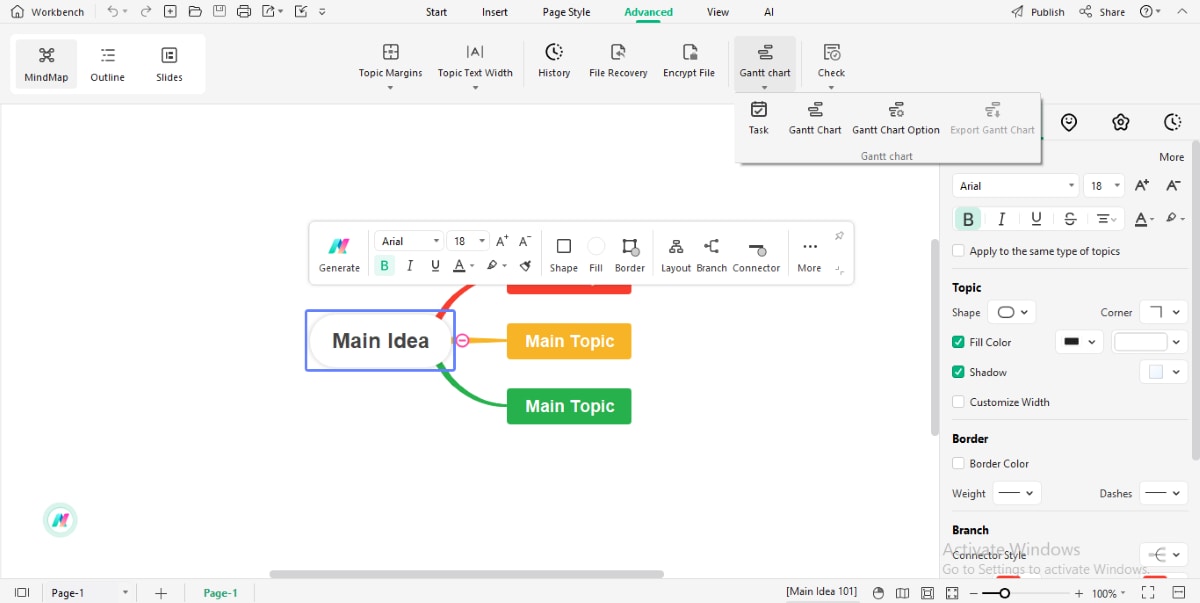
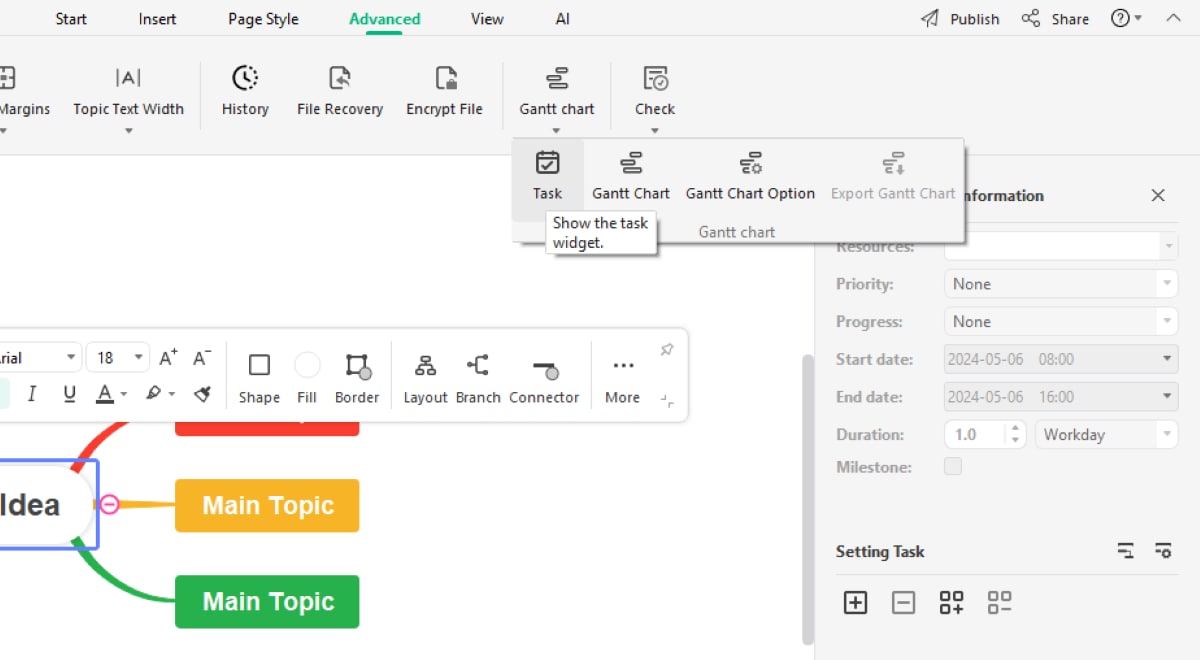
Step 2: Decide the topic and click the Add Task Info icon in the Setting Task menu (on your right-hand side). If you want to delete tasks, then click on Delete Task Info.
MAGE
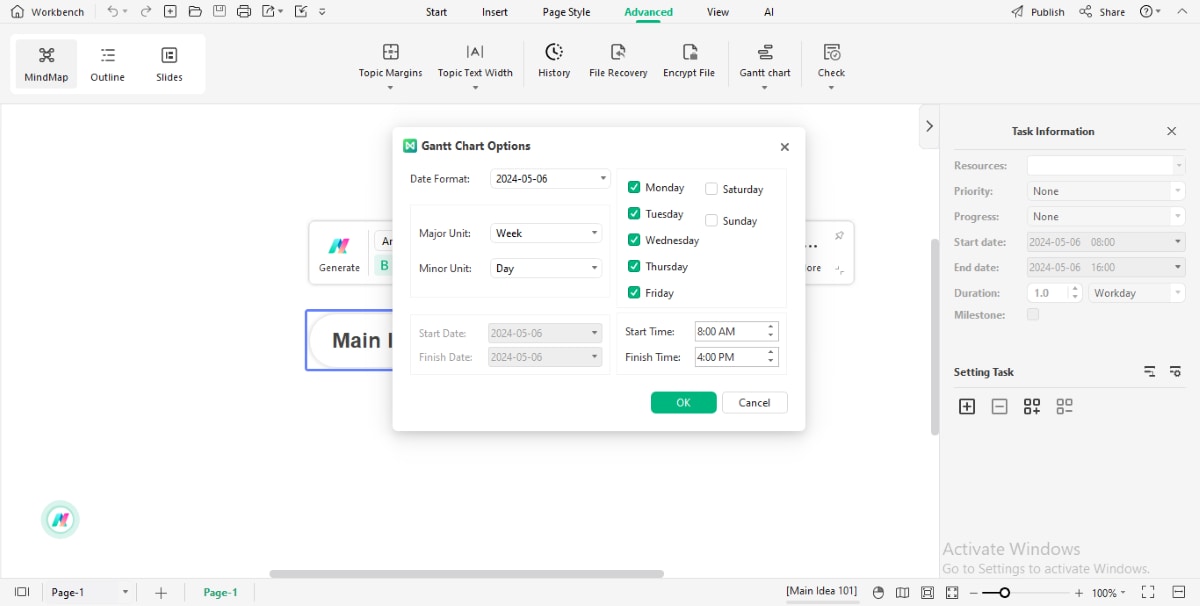
Step 3: Click the Advanced tab and open the Gantt Chart Option. Here, you can modify the data format, the major and minor units, the start and finish times, and more.
Step 4: Now, click the Advanced tab and Export Gantt Chart. Name the Gantt chart in the saving window and save the file by clicking the Save option.
Following these easy steps, you can create a Gantt Chart in EdrawMind without confusion.
Features of EdrawMind
Apart from Gantt Chart making, more features make the EdrawMind Software reliable:
- Password Protect:This feature allows you to secure a confidential file by locking it with a password. This way, nobody can open the file without your help.
- Ready-Made Templates:EdrawMind has a massive library of 6000+ editable free templates, which provides a vast choice of professionally designed templates for your project.
- Layouts:EdrawMind has 22 diverse layouts or structures, which helps to create mind maps.
- Mind Map Gallery:The Mind Map Gallery has 10,000+ original mind maps, which creates examples for beginners and experts to make mind maps for projects.
- Remote Collaboration:While making a diagram or mind map, you can invite your collaborators or teammates to join you on EdrawMind Online.
Ratings
Wondershare's EdrawMind is one of the most reliable software according to most users. If we talk about Gantt Chart making, it has strong charting ability and various built-in Gantt Chart templates, and the software provides assurance when it comes to making a Gantt Chart with less effort.
This software has a large number of constant users, and because of its user-friendly features, it receives positive ratings from the users themselves.
Here are some reviews from notable platforms:
- G2:4.6 out of 5.0 (based on 11 reviews)
- Capterra: 4.6 out of 5.0 (based on 51 reviews)
- GetApp: 4.6 out of 5.0 (based on 51 reviews)
Conclusion
With this guide, you must understand how to create a Gantt PowerPoint. Even though MS PowerPoint is considered an excellent tool for presentation, it lacks certain features and customization options required to make a project management Gantt Chart. However, EdrawMind offers a multi-functional solution. With its simple interface and extensive features, EdrawMind simplifies creating Gantt charts and managing them later for convenience. With its comprehensive features and implemented interface, it helps to visualize the project schedule activities.
