


In this article
What is a Fishbone Diagram in Manufacturing

The Fishbone diagram takes the names from its appearance - a fish's skeleton where we note the problem statement in the head and all the contributing factors branch off as its bones. In the context of manufacturing, each of these branches would represent different categories of potential causes. Some of the most common categories are people, methods, equipment, environment, management, and materials.
A fishbone diagram in manufacturing is considered one of the most important project management plans. A fishbone diagram, or Ishikawa diagram, visually represents causes and effects that help the teams investigate the root causes of issues affecting product quality, procurement, efficiency, and overall manufacturing-related performance.
Main Purpose of Fishbone Diagram for Manufacturing
The world of manufacturing is very complex and depends on a number of factors. If there is a problem in one department, then it will affect all the others. That is why creating a fishbone diagram serves as a valuable tool for continuous improvement and avoiding unnecessary bottlenecks.
The main purpose of using a fishbone diagram in the manufacturing industry is:
- Learn About Causes: The primary objective of using fishbone diagrams in manufacturing is to understand and pinpoint the root causes of manufacturing issues and defects. By carefully categorizing the potential causes, manufacturing industry departments can find the problems' true origins.
- Continuous Improvement: Manufacturing is one such industry that constantly needs analysis and learning. By conducting brainstorming sessions and creating fishbone diagrams, different experts can ensure that there is a scope for continuous improvement in the overall process.
1. When to use the Fishbone Diagram in Manufacturing
The fishbone diagram in manufacturing should be employed when:
- There is a recurring problem in the manufacturing process.
- The cause of the issue is not evident, and the team has finalized that a deeper analysis is mandatory.
- A cross-functional team or an external team is involved to identify the problem.
2. Pros & Cons of Using the Fishbone Diagram in Manufacturing
Some of the pros of using the fishbone diagram in manufacturing are:
- It promotes structured problem-solving.
- It creates a comprehensive analysis to identify the potential causes.
- It promotes healthier team collaboration.
Some notable cons of going ahead with the fishbone diagram in manufacturing are:
- The overall process feels time-consuming.
- Without the right diagramming tool, creating a fishbone diagram seems daunting.
- It does not provide any immediate solutions.
How to Use a Fishbone Diagram For Manufacturing

Using a Fishbone Diagram for manufacturing involves a systematic approach from different departments of an organization. Here are the generic steps that you need to follow if you plan to utilize Ishikawa diagrams in project manufacturing:
Step1Define the problem
First, sit down with your team and learn about the problem you must address with this fishbone diagram. In the manufacturing industry, the problem can be anything ranging from invoicing issues to production delays, client retention, and more.
Step2Assemble Team
Once you have identified the objective, understand the key members you would like to include in the brainstorming session.
Step3Address the Effect
Create a fishbone diagram using tools like EdrawMind, and in the fish's head, note down the 'Effect.' Following this, create a straightforward line and start adding the causes.
Step4Add Categories
To easily understand the causes and sub-causes, divide all the causes for that effect into different categories. At the same time, try to identify the relationship between those causes with others. This will encourage open and creative thinking to capture all relevant factors.
Step5Identify Root Cause
Create an internal voting system to identify the problem statement's root cause. By reviewing the diagram, the team can easily identify the root causes -- which are the fundamental reasons behind the problem.
Step6Develop Solutions
With a clear understanding of the root causes, work with your team to develop effective solutions and address them during the next brainstorming meeting.
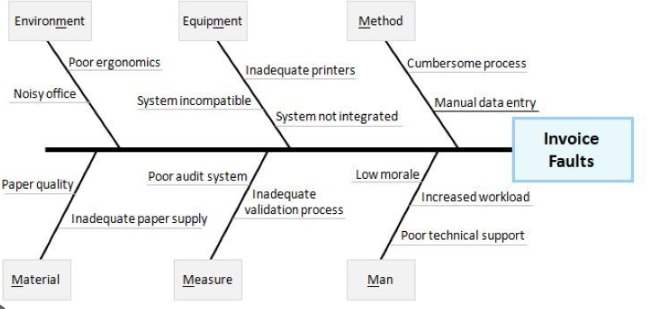
Fishbone Diagram Example Manufacturing
In the following fishbone diagram, the problem statement that the manufacturing team would like to address is 'Invoice Faults.' Using the right methodology, the team has implemented the 5M/1E process. All the causes of that effect are categorized into Method, Equipment, Environment, Material, Measures, and Man. This way, the team can include causes and sub-causes under each category to analyze and later identify the root cause. Suppose the root cause of the 'Invoice Fault' is 'Poor Technical Support,' then the manufacturing team understands that the primary cause of the issue is the 'Man' and if they resolve the issues from this category, all the issues related to 'Invoice Faults' would automatically be resolved.
Tips on Using Fishbone Diagrams in Manufacturing
When using the fishbone diagrams in manufacturing, it is recommended to follow the following tips for maximum results:
- Prioritize Data Quality: Make sure that the data you have used to identify the causes and solutions is accurate.
- Engage Cross-Functional Team: Do not be dependent on the suggestions of only one time. Try encouraging different teams and members from varied areas of expertise.
- Use Visual Aids: Try using EdrawMind to create stunning fishbone diagrams that would let you use Summary, Comments, Icons, Cliparts, and other visual elements to the diagram.
- Update Regularly: Try revisiting the causes periodically and see how the manufacturing process has changed along with the effects and causes.
- Open Communication: Do not discard any suggestion in the early hours of brainstorming. You may never know how one idea would build upon several different ideas.
Conclusion
Manufacturing is a vast industry, and one department depends on the growth of the other department. In order to ensure that there is a productive environment all the time, project groups undergo several stages of fishbone diagrams for manufacturing. When you are working with a diverse team where everyone has their own suggestions, we recommend using EdrawMind to create fishbone diagrams in the manufacturing industry. The mind mapping tool offers a safe ground for brainstorming sessions where team members can create diverse fishbone diagrams.
FAQ
-
1. What is an Ishikawa diagram?
An Ishikawa diagram, also known as a Fishbone or Cause-and-Effect diagram, is a visual problem-solving tool to identify the potential causes of any problem statement. -
2. Is a fishbone diagram a root cause analysis tool?
Yes, a fishbone diagram is a root cause analysis tool, as it helps identify and analyze the root causes of a problem.
