


In this article
- What is a Fishbone Diagram in Project Management
- What is the Purpose of a Fishbone Diagram
- How to Use a Fishbone Diagram from Project Management
- What are the Different Types of Fishbone Project Management Diagrams
- Example of Fishbone Diagram in Project Management
- Tips for Using a Fishbone Diagram
- Conclusion
What is a Fishbone Diagram in Project Management

A cause-and-effect diagram or Ishikawa diagram, more commonly known as the Fishbone diagrams, is a visual tool used by project managers in solving project management-related problems. With Fishbone diagrams, teams can easily identify and analyze different causes of any problem and issue. Since the diagram looks like the skeleton of a fish, it gives a visual appeal to beginners and also eases the problem-solving process.
Importance of Fishbone diagram in project management
- It provides a visually stimulating element that helps the teams to understand the problem.
- With fishbone diagrams, we can create multiple categories to identify the causes and sub-causes.
- It improves productivity and enhances overall collaboration.
To its core, the fishbone diagram in project management provides a structured approach that helps in problem-solving. This helps project managers to gain insights into why a particular problem has arisen in the first place.
What is the Purpose of a Fishbone Diagram
The primary purpose of a fishbone diagram for project management is to facilitate problem-solving and decision-making approaches. With the right methodology, the team can optimize the process and ensure that no such problem would arise in the perceivable future. The fishbone diagram does this by:
- Identifying Causes: A fishbone diagram allows project teams to identify potential causes that must have contributed to a specific problem.
- Visualization: With a fishbone diagram, teams can visualize the relationships between various factors and how they influence one another to create the problem.
- Prioritization: Fishbone diagrams in project management help the team prioritize the solutions or at least find it easy to address the root cause of the given situations.
In project management, a fishbone diagram is considered a valuable tool for:
- Improving internal communication between team members
- Understanding and implementing results based on data-driven analysis.
- Encourage team members to identify the root causes and take swift preventive measures.
How to Use a Fishbone Diagram from Project Management

Most small and large companies use fishbone diagrams for project management due to their unique structure and analytical capabilities. If you are also planning to use a fishbone diagram for project management, check out the following essential steps:
Step1Define the problem
Start by defining the problem you want to address. This would be the 'effect' we will place at the head of the fishbone diagram.
Step2Assemble Team
Discuss with the management and find a diverse team to brainstorm on different sets of ideas. This would lead to a more comprehensive analysis.
Step3Identify Categories
Once you have gathered the team members, you can create the 'bones' of the fishbone diagram. This would represent the major categories that influence the potential causes.
Step4Brainstorm Causes & Sub-Causes
Use tools like EdrawMind to conduct brainstorming sessions to identify the potential causes. While brainstorming, encourage your team members to add sub-causes contributing to the problem.
Step5Analyze and Categorize Causes
Once you have outlined all the potential causes, you can analyze and categorize them further. During brainstorming, you will find that some causes are related and can be grouped together under a single category.
Step6Determine Cause-and-Effect Relationships
Try exploring how each cause relates to the effect. You can use arrows to indicate the cause-and-effect relationships between different categories.
Step7Gather Data
From your detailed brainstorming session, try collecting data and evidence to support the identified causes. Remember that this is crucial for making informed decisions and implementing effective solutions.
What are the Different Types of Fishbone Project Management Diagrams
Fishbone diagrams are tailored to specific project management needs. Some require manufacturing categories, while others require additional information related to the domain. The reason for having different types of Fishbone diagrams is to provide flexibility and specificity in problem-solving. Here are three commonly used types:
- Simple Fishbone Diagram:The most common fishbone diagram is the one that is referred to as the Ishikawa diagram. It is primarily used for identifying and analyzing the root causes of a single problem or issue. The diagram focuses on People, Process, Equipment, & Materials. This simple fishbone diagram is the go-to choice in project management for straightforward issues where the team members need a quick analysis.
- 4S Fishbone Diagram:The 4S Fishbone diagram expands upon the simple fishbone diagram as it further includes Suppliers, Systems, Surroundings, and Skills. By adding the additional category, teams get a comprehensive analysis, particularly in situations where external factors, like suppliers or the project's environment (both internal and external), play a significant role in the problem.
- 5M/1E Fishbone Diagram:This is a more dynamic fishbone diagram commonly used by large organizations where they need to find the root cause of a long-impending problem. Unlike the simple fishbone and 4S, this one includes five categories: Manpower, Machinery, Materials, Methods, and Measurements, along with one additional category, Environment (both internal and external). This fishbone diagram for project management focuses on the critical factors affecting process quality and consistency.
Example of Fishbone Diagram in Project Management
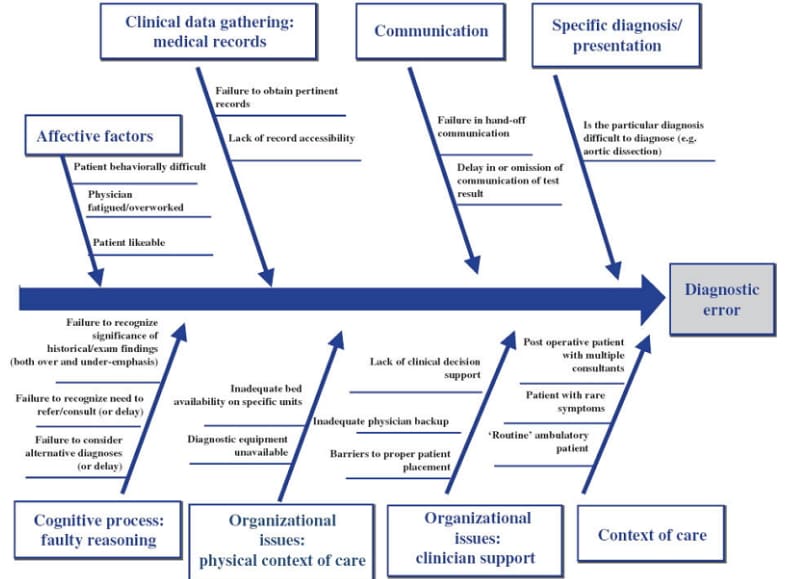
The following fishbone diagram in project management shows that the problem statement is about 'Diagnostic Error.' Upon brainstorming, the team created multiple categories to group the problems. A few of these 'Causes' are Specific Diagnosis, Communication, Clinical Data Gathering, Medical Records, Affective factors, Cognitive Process, Faulty Reasoning, Organizational Issues, Physical Context of Care, Organizational ISsues, Clinical Support, and Context of Care. Upon further dissecting, the project management team has further added different sub-causes to identify the root problem. Such a fishbone diagram for project management helps the teams understand and prioritize the issues that influence the overall problem. You can download this fishbone diagram template from EdrawMind and start customizing.
Tips for Using a Fishbone Diagram
Some of the tips for using a fishbone diagram in project management are:
- Identify the root cause: The first step you need to do is to identify the root cause and ensure that the entire team is on the same page when it comes to clarity and objectives.
- Use tools: Go ahead with fishbone diagram software, like EdrawMind, to create detailed and complex fishbone diagrams. The tool comes with free templates, layouts, themes, and symbols that ease your process of making diverse fishbone diagrams.
- AI-Generated Recommendations: Implement AI-generated texts that suggest potential causes and solutions based on historical project data. Edraw now comes with Edraw AI that helps you generate text based on your queries.
- Gamification: Try turning problem-solving into a productive game with your team members. Engage your team in a creative brainstorming session using mind mapping tools, where they get a mark every time they identify potential causes.
Conclusion
The fishbone diagram in project management is crucial as it helps break down the problem into smaller segments and ensures that everyone in the team suggests some productive analysis that would help generate the result. With the right tips and methods, project management teams can identify and analyze effects and learn about the causes. You can use EdrawMind for your next cause-and-effect session. The built-in AI, templates, and layout options make EdrawMind the best mind-mapping tool for project management.
