


Understanding how insurance companies are structured is key to grasping how they operate efficiently and serve clients effectively. From executive leadership to claims processing and customer service, each department has a specific role that contributes to the company’s overall workflow. This guide breaks down the typical structure of insurance companies, helping you see how different teams interact and work together.
In this article
Examples of Insurance Company Organizational Structure
Insurance companies can adopt different organizational structures to manage their operations effectively. The structure chosen often depends on the size of the company, the range of services offered, and the level of hierarchy they want to maintain. Below are two examples of typical insurance organizational chart structures that illustrate how leadership, departments, and staff roles can be arranged.
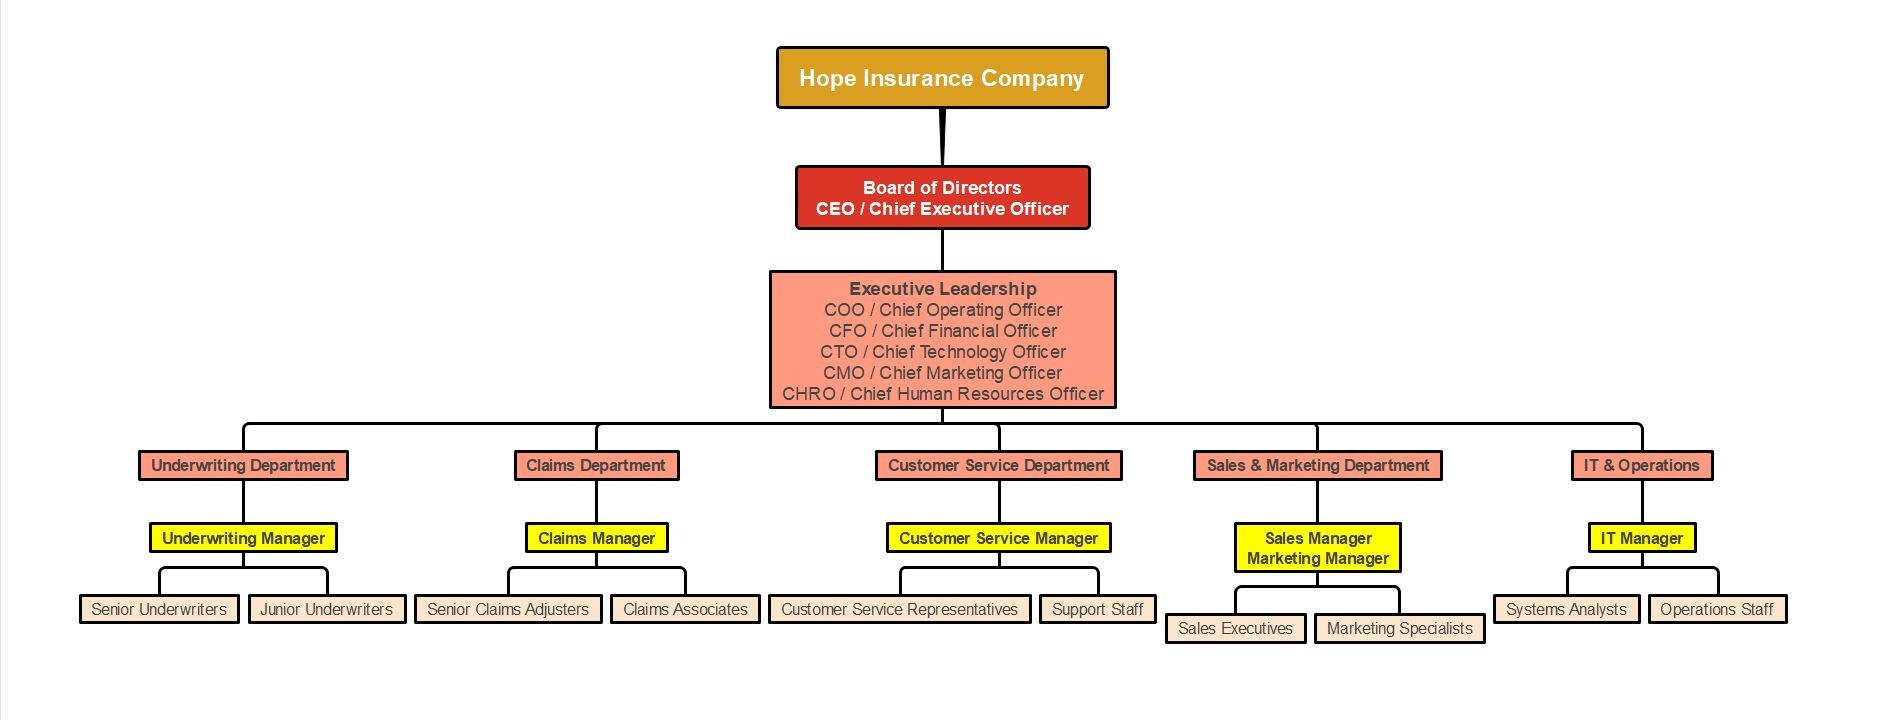
The first example uses a classic hierarchical structure. In this format, the authority flows from the top management down to the various departments, providing a clear and straightforward chain of command. This chart emphasizes clarity and accountability. Each role and department is distinctly separated, making it easy for employees to understand their responsibilities and reporting lines. It is particularly effective in larger organizations where clear supervision and task delegation are critical.
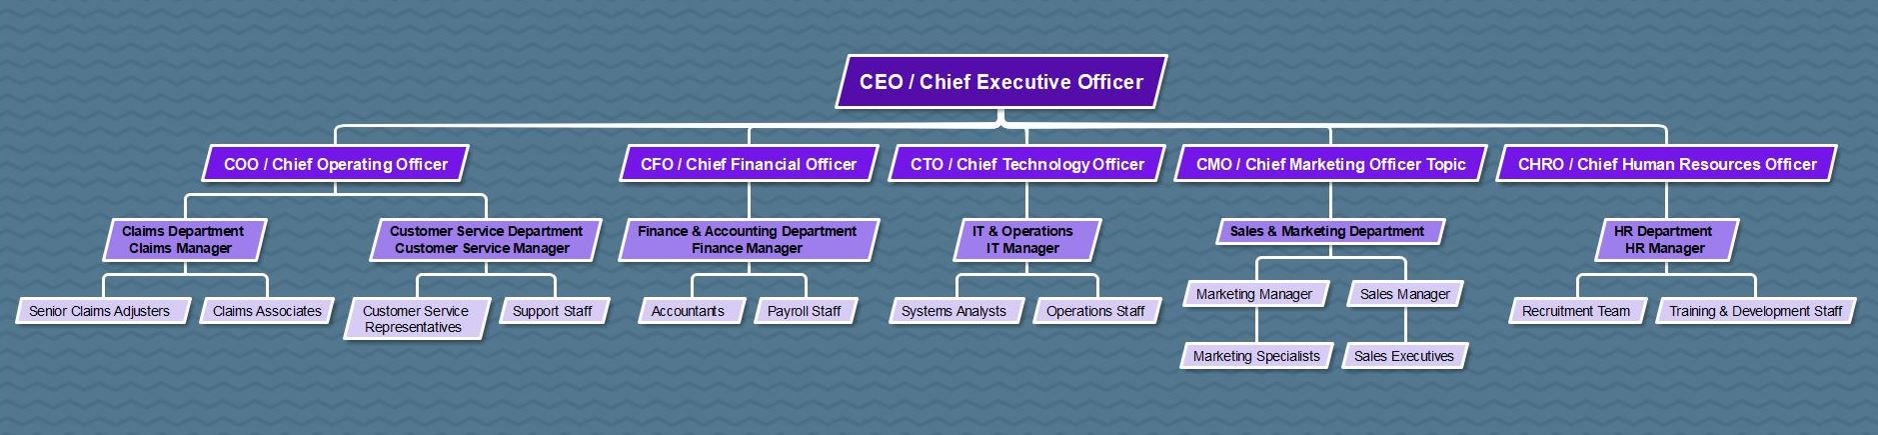
The second example is a functional style chart, which highlights relationships and reporting lines more visually. This format arranges the company in a branching structure, showing how departments and teams connect under top leadership. This chart is particularly useful for visualizing the flow of communication and collaboration across departments. Unlike the traditional hierarchical chart, it emphasizes interconnections rather than just authority. This format can help employees quickly understand who to approach for approvals, collaboration, or reporting.
Both charts serve the same overall purpose: to clarify roles, responsibilities, and reporting lines within the company. By examining both examples, insurance companies can choose a structure that aligns with their size, goals, and operational style. Regardless of the format, the key is to ensure clarity, transparency, and efficiency in managing people and processes.
Advantages and Disadvantages of the Structure
An insurance company’s organizational structure shapes how effectively it operates, communicates, and delivers services. Understanding its strengths and weaknesses helps leaders build a system that supports both efficiency and collaboration.
Advantages
- Clear Roles: Employees understand their responsibilities and reporting lines, reducing confusion and overlap.
- Efficient Decisions: Defined authority speeds up approvals and policy management.
- Better Communication: Clear reporting channels improve coordination between departments.
- Performance Tracking: Managers can easily monitor progress and productivity.
Disadvantages
- Less Flexibility: Too many layers can slow decision-making and adaptation.
- Department Silos: Teams may focus on their own goals instead of the company’s overall mission.
- Bureaucracy Risks: Excessive hierarchy can limit innovation and lower morale.
A structured system keeps operations organized, but it should remain flexible enough to adapt to growth and market changes. The best insurance companies balance hierarchy with teamwork and open communication.
How to Create an Insurance Organizational Chart


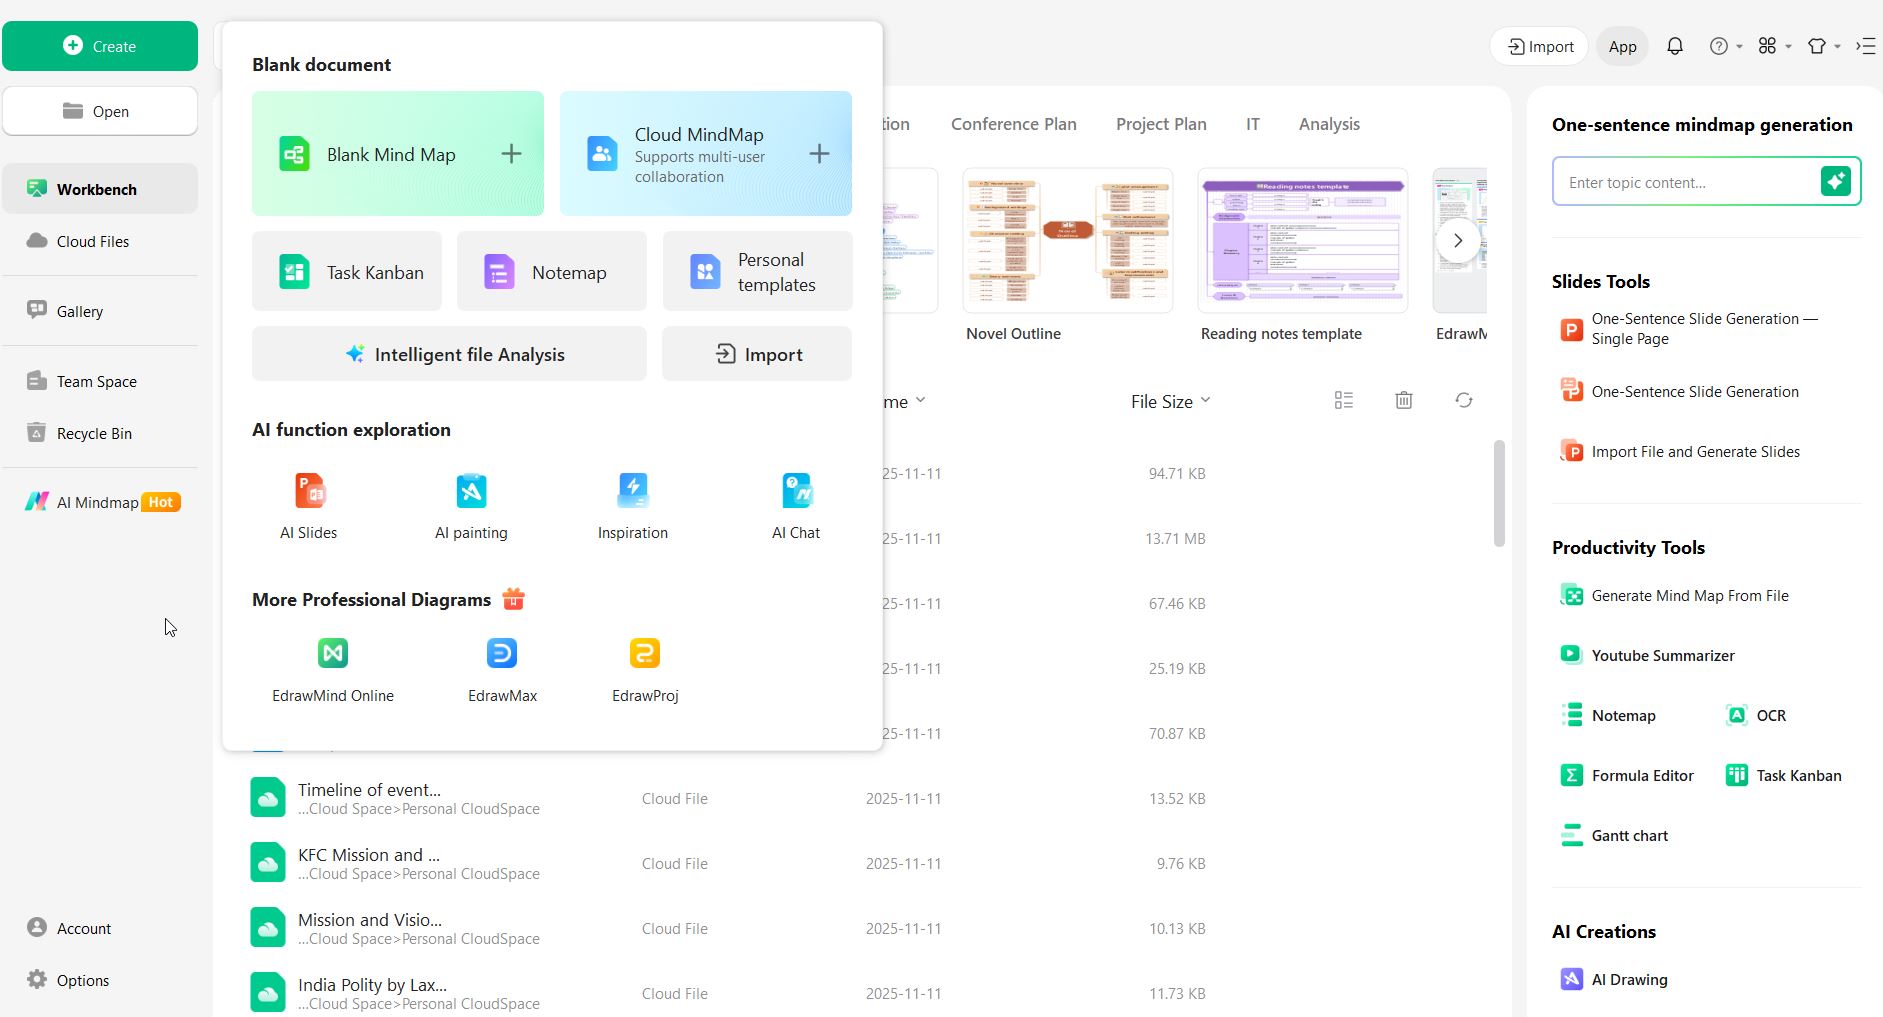
Step 1 Open a template or blank canvas.
Start with an organizational chart template if available, or open a blank canvas to build your chart from scratch.
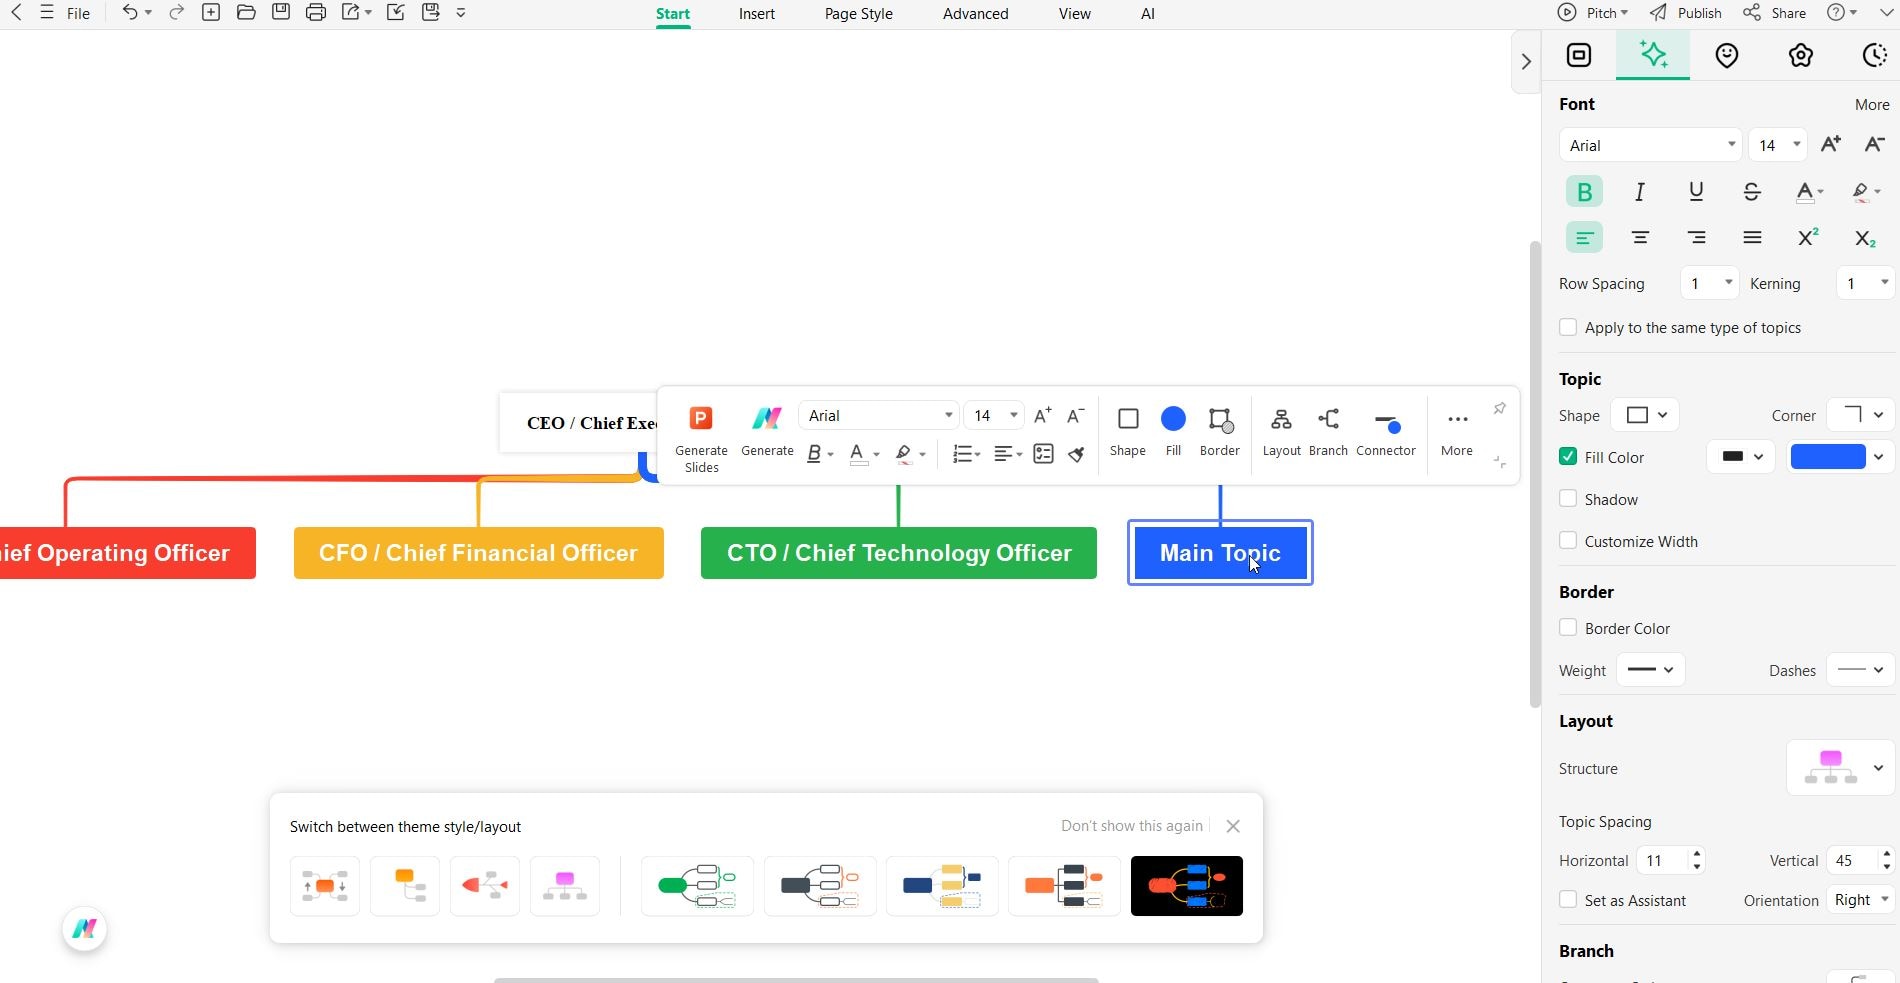
Step 2 Create the main node for leadership.
Add the top node for the highest authority. For example, “CEO / Chief Executive Officer” represents the company’s top leadership.
Step 3 Add department heads as child nodes.
Create child nodes for major departments under the main node. For example, Operations, Finance, Marketing, IT, Human Resources, Claims, and Customer Service.
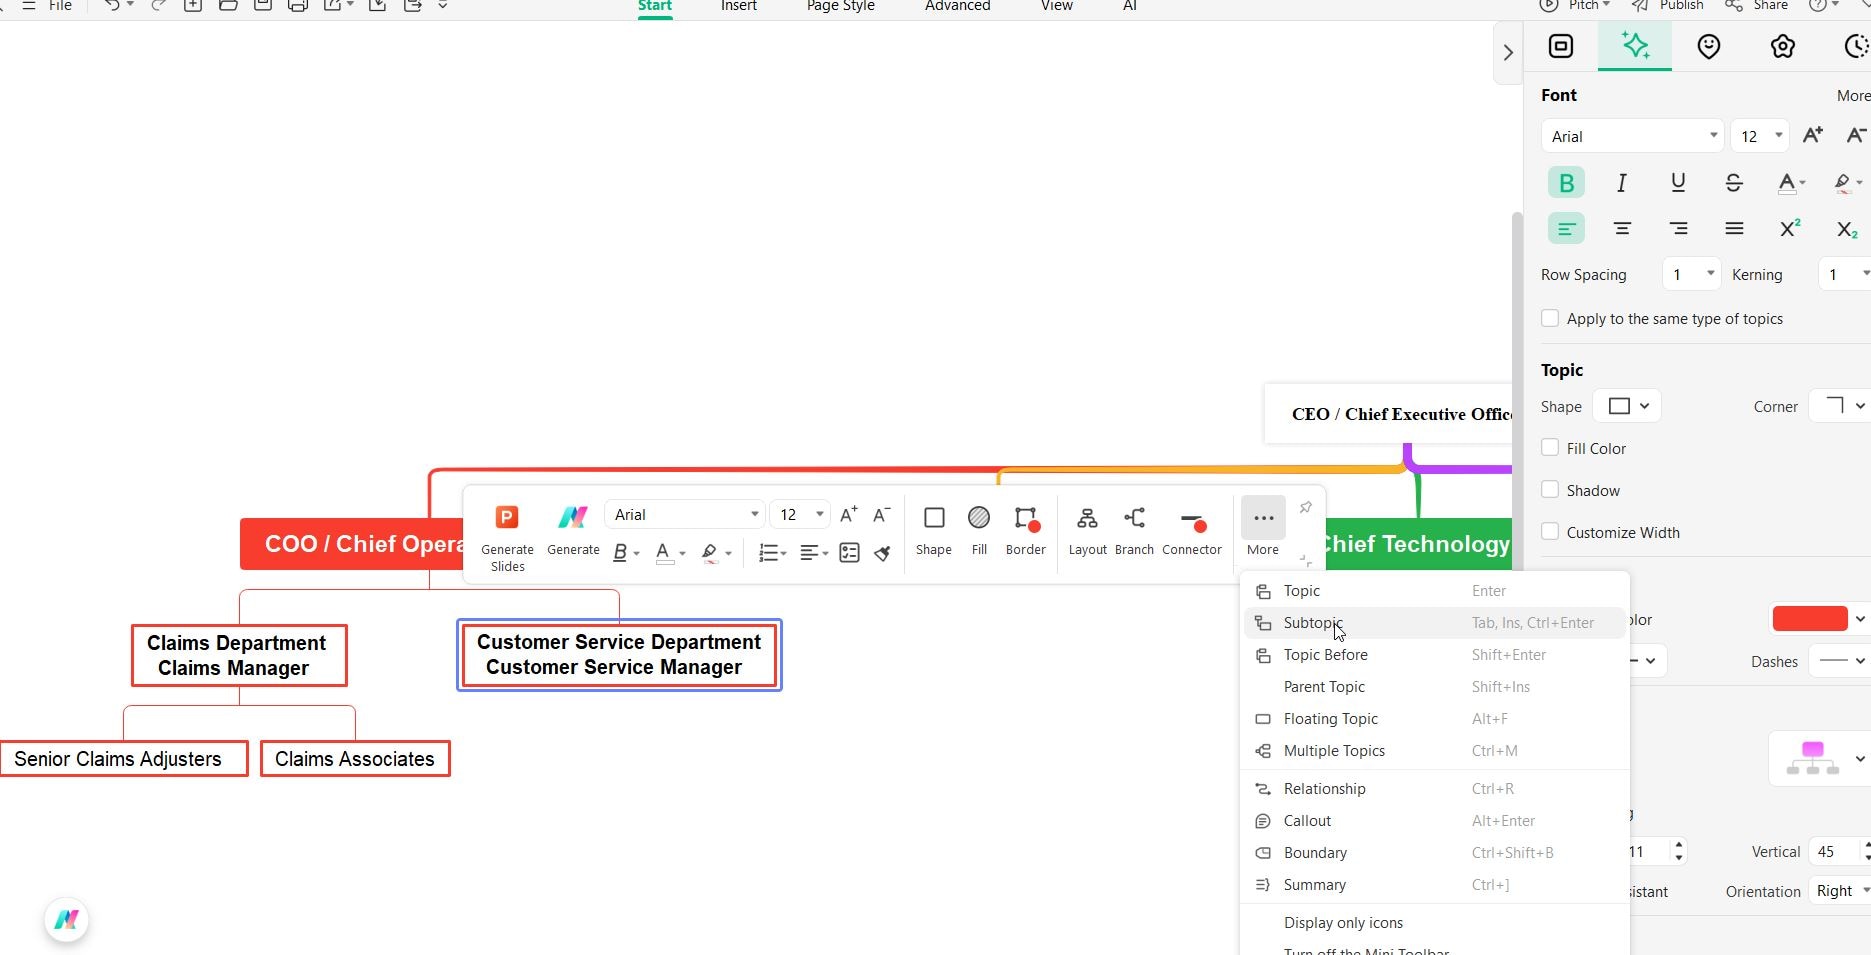
Step 4 Add staff roles under each department.
Under each department node, add sub-nodes for specific roles, such as managers, specialists, and associates. Keep labels short and group related roles together.
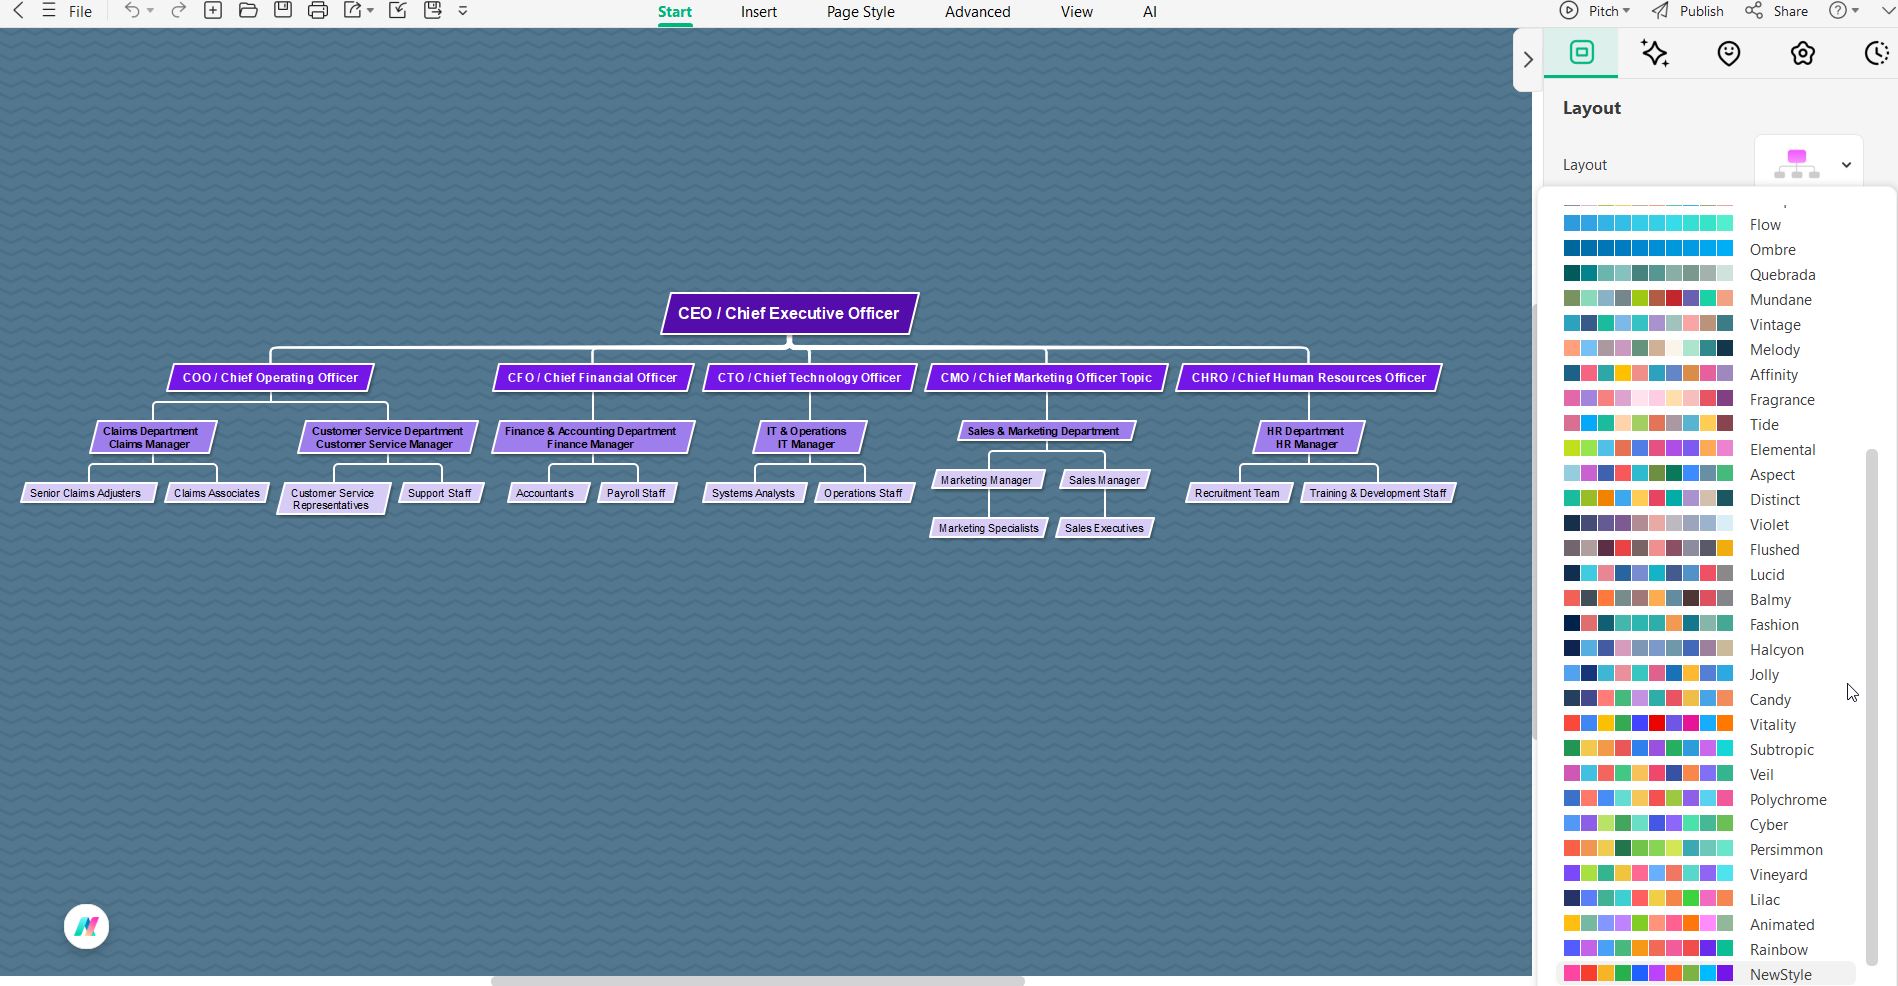
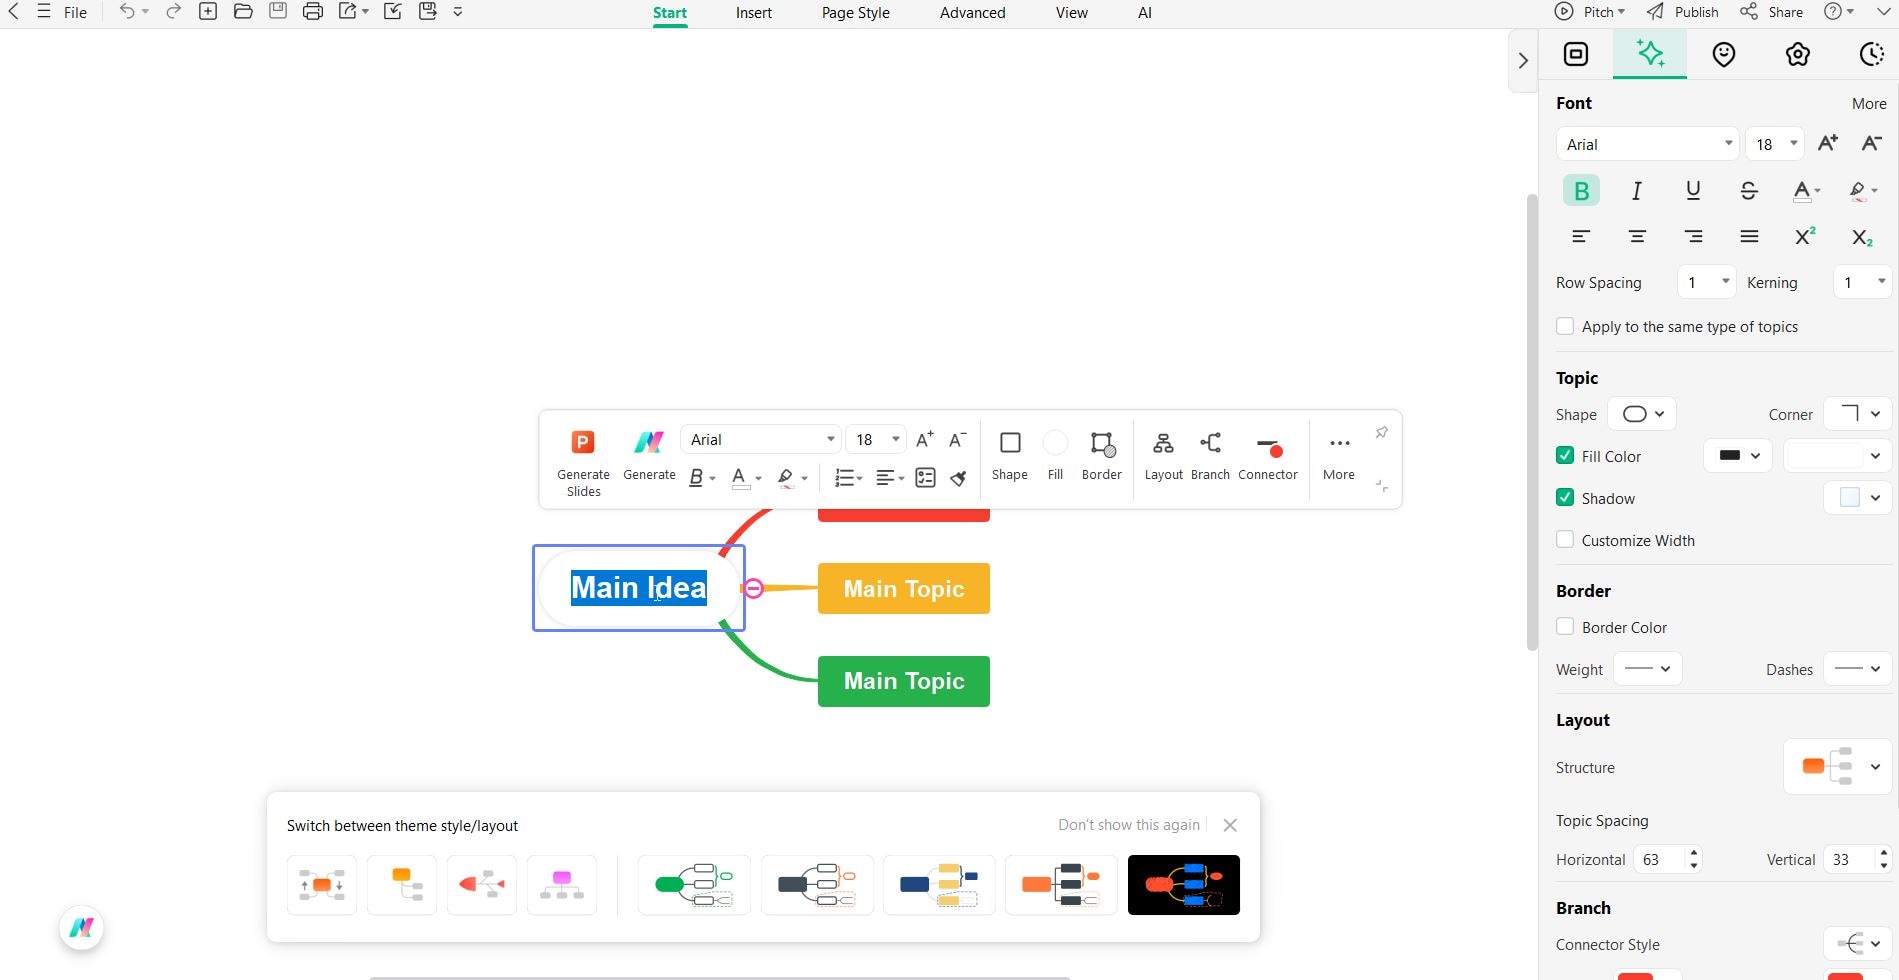
Step 5 Style, review, and share.
Adjust layout, colors, and shapes for clarity. Review the chart for accuracy and update it regularly as staff or responsibilities change. Export it as a PDF, PNG, or other format for sharing.
Quick Tip: Keep titles concise, maintain clear hierarchy, and update the chart whenever changes occur.
Tips for Maintaining an Effective Chart
An organizational chart is only useful if it stays accurate. Follow these tips to keep it effective:
- 1. Update Regularly Revise the chart whenever there are staff changes or new roles to maintain clarity.
- 2. Keep It Simple Use short titles and group related roles to avoid clutter.
- 3. Standardize Formatting Consistent colors, shapes, and fonts improve readability and make the chart easier to follow.
- 4. Add Notes if Needed Include brief descriptions or links to help employees understand roles without overcrowding the chart.
- 5. Share and Communicate Make the chart accessible to all staff and encourage referencing it for collaboration and reporting.
Conclusion
An insurance organizational chart is a powerful tool for clarifying roles, improving communication, and keeping operations running smoothly. Using tools like EdrawMind makes it easy to create, customize, and update charts that reflect real workflows. A well-maintained chart ensures the company stays organized, transparent, and ready to adapt to changes.
FAQs
-
1. How do I create an insurance organizational chart?
Start by listing all key roles and departments, define reporting relationships, and select a layout format. Many tools are available to design organizational charts, but EdrawMind is recommended for its ease of use and flexibility. -
2. How often should the chart be updated?
Update it whenever there are staffing changes, departmental restructuring, or new roles. Regular updates ensure the chart remains an accurate reference for employees and management. -
3. What are common types of organizational charts for insurance companies?
Common types include hierarchical, functional, and matrix structures. Each shows reporting relationships and departmental organization in slightly different ways.
