


Many factors will shape our family dynamics and relationships, including medical conditions, friendships, cultural traditions, and community resources. To better understand these connections, professionals use Ecomaps and Genograms, two powerful visual tools that map out relationships and external influences within a family system.
These diagrams provide a clear, tangible way to analyze connections, promote self-reflection, and deepen understanding of the factors shaping our experiences. Whether you’re a therapist, social worker, or educator, Ecomaps and Genograms are invaluable for gaining insights into family dynamics and guiding the therapeutic process.
However, many confuse Ecomaps and Genograms, assuming they serve the same purpose. While both are visual tools, they have distinct uses and features. In this guide, let's see the key differences between Ecomaps and Genograms, their unique applications, and how to create them effectively.
In this article
Part 1: What is an Ecomap
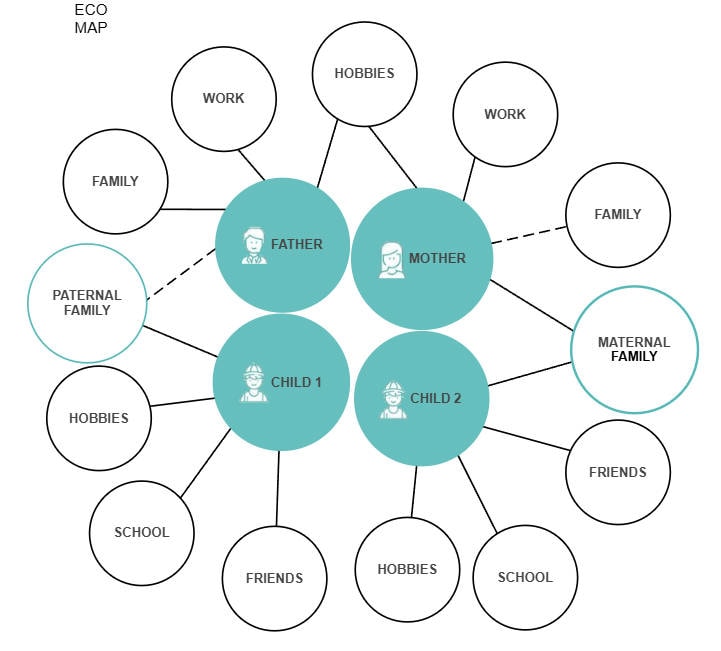
An Ecomap (full as Ecological Map) is a visual tool to map out an individual’s or family’s relationships with their external environment. It illustrates connections to people, organizations, and resources, such as friends, schools, healthcare providers, and community services.
Developed by Dr. Ann Hartman in the 1970s, Ecomaps are widely used in social work, therapy, and education to assess support systems, identify strengths, and uncover potential stressors. By visually representing these relationships, Ecomaps helps professionals and individuals better understand the external influences shaping their lives.
Components of Ecomap
Family Members: At the core of an Ecomap are the family members, represented by universally accepted symbols. These symbols help illustrate the relationships and connections between individuals within the family.
Relationship: Ecomaps use lines and symbols to depict the nature of relationships like Genograms. These lines can show dynamics such as:
- b connections (solid lines)
- Weak connections (dashed lines)
- Conflicts (zigzag lines)
- Supportive relationships (arrows indicating resource flow)
External System & Institutions: What sets Ecomaps apart from Genograms is their focus on external influences. These include:
- Healthcare providers
- Schools
- Community resources
- Religious organizations
- Social services
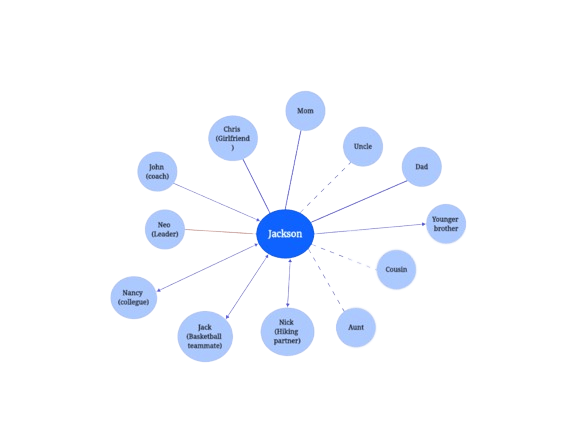
 Ecomap Example provided by EdrawMind Gallery Click to download and use this template.
 *The emmx file needs to be opened in EdrawMind.
If you don't have EdrawMind yet, download EdrawMind free from
 below.
 You also can try EdrawMind Online for free from
 below.
 When will we use Ecomaps:
Ecomaps are versatile tools used in various fields, particularly in social work, to visualize and analyze relationships and external influences. Here are some scenarios where Ecomaps are especially useful:
1. Understanding Family Dynamics
Ecomaps are ideal for:
- Visualizing relationships within a family, including strengths and conflicts.
- Identifying stressors or challenges affecting family members.
- Gaining insights into how internal and external factors shape family interactions.
For example, a social worker might use an Ecomap to understand how a child’s school environment or a parent’s workplace impacts family dynamics.
2. Assessing Support Systems
Ecomaps help professionals:
- Map out support networks, such as extended family, friends, and community resources.
- Evaluate the quality of these support systems (e.g., b, weak, or strained connections).
- Identify gaps in support and develop strategies to strengthen relationships.
This is particularly useful when working with families facing challenges like financial stress, health issues, or social isolation.
3. Planning Interventions
- Designing targeted interventions based on a family’s unique needs.
- Tracking progress over time by updating the Ecomap as relationships evolve.
- Facilitating communication between family members and professionals.
For instance, a therapist might use an Ecomap to guide discussions about improving relationships with external support systems.
Part 2: What is a Genogram
A Genogram is a detailed visual representation of a family’s structure, relationships, and history across multiple generations. Often used in therapy, social work, and medicine, Genograms go beyond traditional family trees by including information about emotional relationships, medical history, and behavioral patterns.
Developed in the 1980s by Dr. Murray Bowen, Genograms help professionals and individuals understand family dynamics, inherited traits, and intergenerational patterns. They are useful for identifying recurring issues, such as genetic conditions, relationship conflicts, or behavioral trends.
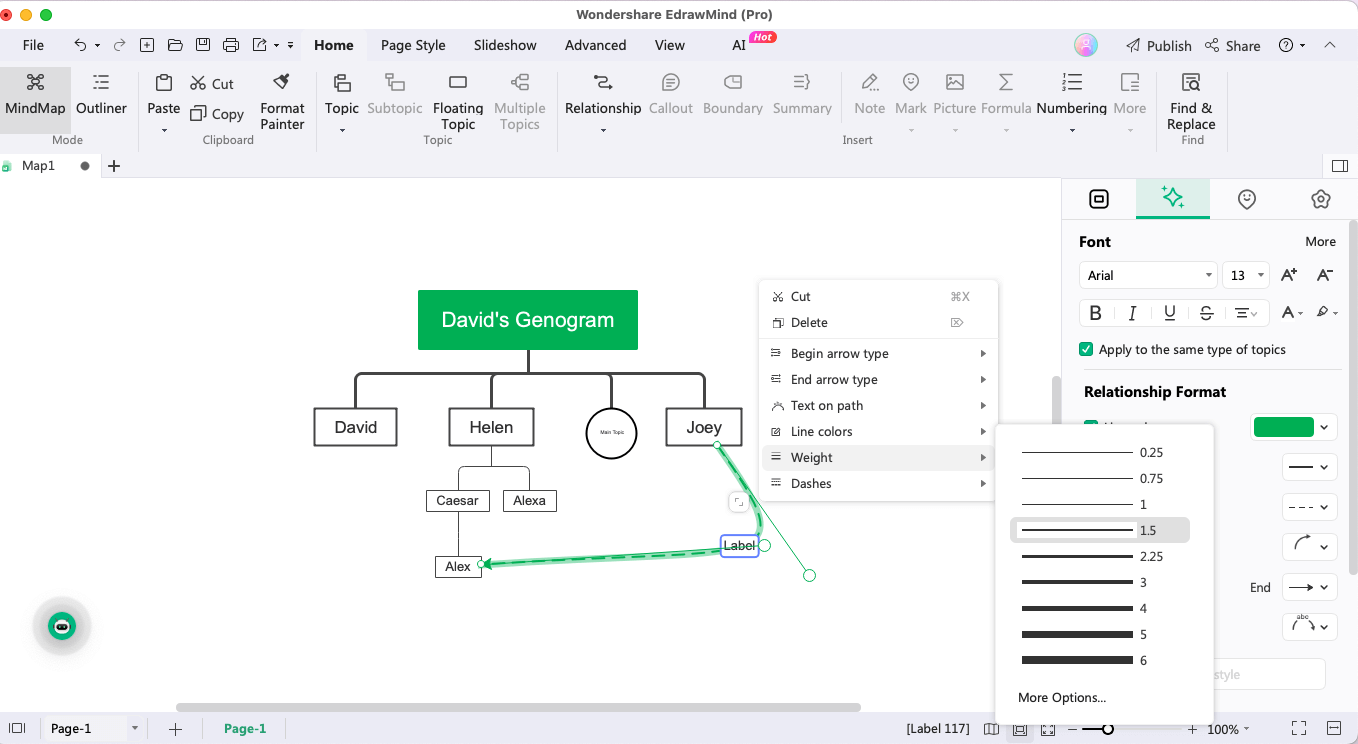
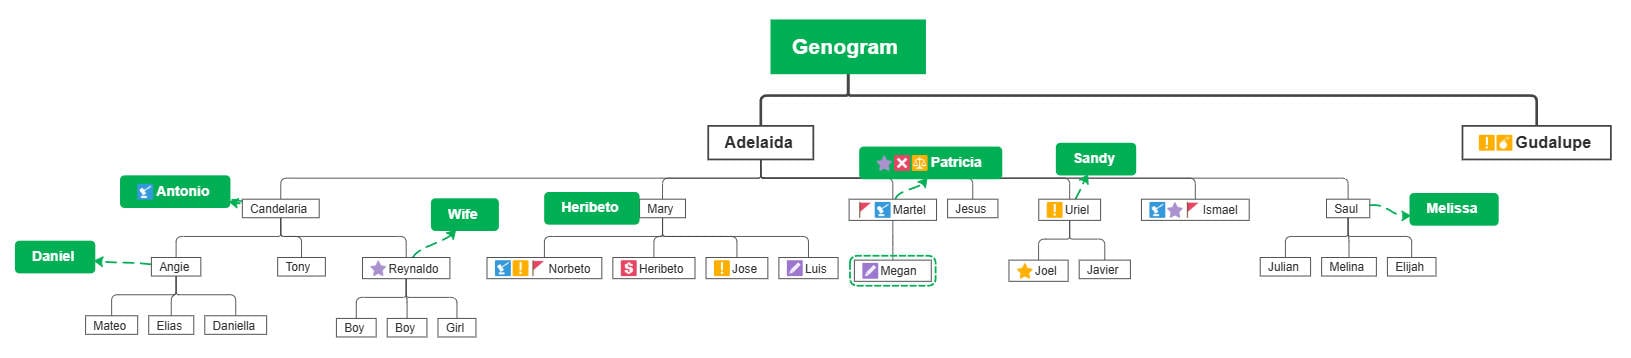 Genogram Example provided by EdrawMind Gallery Click to download and use this template.
 *The emmx file needs to be opened in EdrawMind.
If you don't have EdrawMind yet, download EdrawMind free from
below. You also can try EdrawMind Online for free from
below. Key Features of a Genogram:
- Family Members: Represented by symbols (e.g., squares for males, circles for females).
- Relationships: Lines and symbols depict connections (e.g., marriages, divorces, conflicts).
- Generational Data: Includes information about medical history, occupations, and significant life events.
- Emotional Dynamics: Highlights patterns like closeness, estrangement, or abuse.
Why Use a Genogram?
- Therapists: To explore family dynamics and emotional patterns.
- Medical Professionals: To track genetic conditions and health risks.
- Individuals: To gain insights into their family history and relationships.
Part 3: Key Differences Between Ecomap and Genogram
From a glance, ecomap and genogram look almost similar as they try to cover more or less similar aspects. However, there are several important differences between them, like:
| Parameters | ECOMAP | GENOGRAM |
|---|---|---|
| Purpose & Focus |
It's designed to emphasize the external relationships and influences that swirl around a family. Ecomaps offer a comprehensive view of the social environment, which includes institutes, community organizations, and relationships with friends. |
It's centered on the internal dynamics of a family. its primary focus lies on family structures, health histories, and familial relationships. |
| Components & Symbols |
It utilizes symbols to represent family members, external systems, and relationships. It uses lines to illustrate the nature of the connections. |
It uses specific symbols to represent family, like circles for females and squares for males. It uses lines to denote different types of relationships. |
| Usage |
It's used in social work settings where the primary objective is to understand the external systems that influence the family members. It lets one assess the strengths and challenges one faces in a social context. |
Genograms are extensively used in family therapy and healthcare settings. Genograms provide a visual tool for healthcare professionals to explore intergenerational patterns and family history. |
| Example |
A social worker will use ecomap to understand the support system available to a teenager who is struggling with his marks. A social worker will make an ecomap and include the teenager, family members, and teachers. In the ecomap, the social worker will have lines to connect all of the entities that depict the nature of their relationship. |
A family therapist will use a genogram to explore the origin of recurring behaviors. The genogram will include family members, their relationships, and relevant health history. In the genogram, the therapist will identify a pattern across generations to find the pattern that influences the current family dynamics. |
Part 4: Similarities Between Ecomap and Genogram
Visual Representation
- Ecomap and genogram are both visual illustrating tools. Both of them leverage the power of symbols, lines, and other important visual elements to convey important information about families and relationships.
Family Assessment Tools
- Ecomap and genogram are considered valuable family assessment tools.
- While creating both ecomap and genogram, practitioners gather and organize information about individuals and families. Whether one is exploring external dynamics or internal influences, these tools facilitate a structured approach to family assessment.
Contribution to Holistic Understanding
- Both ecomap and genogram offer insights about a family. Ecomaps help us recognize external influences. At the same time, the genograms delve into the multigenerational aspects of a family.
- Together, ecomap and genogram offer a comprehensive view that considers both external and internal factors that shape an individual’s experiences.
Practical Applications
In different scenarios, social workers and therapists often create both the ecomap and genogram to gain a more comprehensive understanding of individuals and families. Let us explore one case study that encompasses both ecomap and genogram.
Case Study: The Mahajan Family
The Mahajan family sought assistance due to the recurring conflicts among the cousins and communication breakdowns. In this case:
- A social worker would come and create an extensive ecomap to understand different external factors that might be causing a rift between the siblings. They can understand how their different schooling and friends have a serious connection with their behavior.
- At the same time, a therapist will provide insights into intergenerational communication patterns and the history of sibling relationships.
This way, the Mahajan family can understand the internal and ecological influences that are causing the rift between the siblings and how they can improve their communication.
Some of the benefits of combining both ecomap and genograms are:
- Comprehensive Understanding: By combining both external and internal influences, medical practitioners can achieve a more comprehensive or detailed view of the factors that influence an individual.
- Targeted Interventions: When using both ecomap and genograms, one gets a tailored intervention that addresses the being from all fronts, leading to a more effective and targeted support system.
A few examples of successful family communication are:
Academic Success and Family Communication:
Most families put a lot of pressure on academic results. In such cases, a social worker can create an ecomap and genogram to identify the external stressor and how the communication pattern within the family may contribute to the student’s struggles.
Substance Abuse and Family History:
If someone in the family is suffering from substance abuse, social workers and therapists can conduct intervention by creating ecomap and genograms. This way, they can identify the external factors like community influence or family’s internal dynamics that started the substance abuse in the first place. This way, they can easily rectify the problem before it escalates.
Part 5: How to Create an Ecomap or Genogram
Creating an Ecomap or Genogram may seem difficult. But with the right tool, it can be an easy and rewarding process. Whether you’re a social worker, therapist, educator, or simply exploring your family history, here’s a step-by-step guide to help you get started:
Step 1: Download and install EdrawMind
EdrawMind is an excellent choice for creating professional and visually appealing Ecomaps and Genograms. It's an all-in-one map drawing tool that provides:
- Pre-designed templates for Ecomaps and Genograms. So, use a template to skip complex processes.
- Customizable symbols and connectors. Make your map appealing and professional!
- Drag-and-drop functionality for easy editing.
- Export options to share your diagrams in various formats. Images, PowerPoint, and more!


Step 2: Gather information
Before you start, collect all the necessary information. And also, decide which map you plan to make, an Ecomap or Genogram.
Step 3: Start with the Central Figure
- Ecomap: Place the individual or family at the center of the diagram.
- Genogram: Start with the oldest generation and work your way down.
If you're using EdrawMind, there're tons of free and excellent templates for ecomaps and genograms. You can just check the gallery and find a suitable one. Replace the names and adjust the relationships up there.
Step 4: Add Relationships and Connections
Use lines and symbols to represent relationships:
- Solid lines for strong connections.
- Dashed lines for weak or strained relationships.
- Arrows to indicate the flow of resources or energy.
To make a genogram, include details like marriages, divorces, and conflicts using standardized symbols.
Step 5. Customize and refine
- Use colors, icons, and images to make your diagram visually engaging.
- Ensure the layout is clear and easy to follow.
Step 6. Save and share
- Export your Ecomap or Genogram in formats like PDF, PNG, or EdrawMind’s native format for future edits.
- Share it with colleagues, clients, or family members for collaboration or discussion.
Conclusion
The use of ecomap and genogram depends on what exactly we want to identify. Even though there are several differences between them, they both provide a holistic approach to finding the right approach to find solutions. These tools share common grounds when it comes to visual representation, and by integrating ecomap and genogram, one can acknowledge and harness the unique strengths to navigate the intricate relationships. When you plan to create an ecomap and genogram, try using EdrawMind. With this genogram software, you can create both ecomap and genogram in one canvas and can also find relevant connections between the two. EdrawMind is equipped with free templates that help in creating ecomap and genograms with ease.
References:
