Nestlé is a global leader in the food and beverage industry, with a rich legacy that spans over 100 years. Operating in more than 190 countries, it manages an extensive portfolio of well-known brands. The Nestlé organizational chart outlines the company’s leadership and structure, showing how the multinational food and beverage giant organizes its global operations.
The company’s organizational structure is key to overseeing its vast operations, ensuring efficiency, innovation, and alignment across its diverse business units. This structure enables Nestlé to adapt and thrive in a dynamic global market while maintaining its position at the forefront of the industry.
In this article
Overview of Nestlé’s Organizational Structure
Nestlé’s organizational structure is built on a matrix model, which integrates regional and product-based divisions to effectively manage its vast and diverse portfolio. This hybrid approach combines geographical and functional elements, addressing local market needs while maintaining global consistency and operational efficiency.

 below.
  below.
 Headquarters and Global Leadership
Nestlé’s headquarters in Vevey, Switzerland, at the highest level, oversees the company’s strategic direction. The global leadership team, including the CEO and executive board, sets policies and objectives for the entire organization.
Regional Divisions
Nestlé operates in over 190 countries, and its regional offices are key to implementing strategies on a local level. These regional divisions adapt global strategies to suit each market's specific needs, tastes, and regulations.
Regional leaders are empowered to make decisions tailored to their markets, such as local product modifications or partnerships, while ensuring alignment with Nestlé's core values and guidelines.
Collaboration and Flexibility
The matrix structure fosters collaboration between product divisions and regional teams, streamlining operations across the company. For example, product category leaders collaborate with regional teams to adapt products like Maggi and Nescafé to suit local tastes, all while maintaining global consistency.
Benefits of Nestlé’s Organizational Structure
Nestlé’s organizational structure offers several key benefits that contribute to its continued success in the global food and beverage industry.
Effective Management of a Diverse Product Portfolio:
The matrix structure enables Nestlé to manage its extensive product portfolio effectively. By balancing product innovation with consistency, the company ensures that brands like Nescafé, Maggi, and KitKat remain competitive.
Enhanced Adaptability to Local Market Needs:
With regional divisions empowered to adapt to local consumer preferences and regulations, Nestlé can customize its offerings. This adaptability ensures that the company’s products resonate with consumers in more than 190 countries.
Strong Collaboration Across Functional and Product Categories:
Nestlé’s matrix structure fosters collaboration between product divisions and regional teams. This coordination ensures that local teams can meet specific market needs while maintaining the global standards and identity of the Nestlé brand.
Improved Decision-Making and Accountability:
Nestlé’s organizational structure promotes decentralized decision-making, giving regional leaders and product managers the autonomy to make decisions tailored to their markets. At the same time, accountability at all levels ensures that performance is closely monitored.
How to Create an Organizational Chart Easily
An organized, clear visual representation, like Nestlé’s org chart, is essential for effectively managing large-scale operations. An organizational chart enhances clarity by visually mapping out an organization's hierarchy, roles, and relationships. It improves communication, decision-making, and efficiency across all levels.
Wondershare EdrawMind is a versatile and reliable tool for creating professional, detailed organizational charts. With its intuitive interface and customizable features, It simplifies the process of visualizing complex structures, making it ideal for businesses of all sizes.


Steps to Create an Org Chart Using EdrawMind
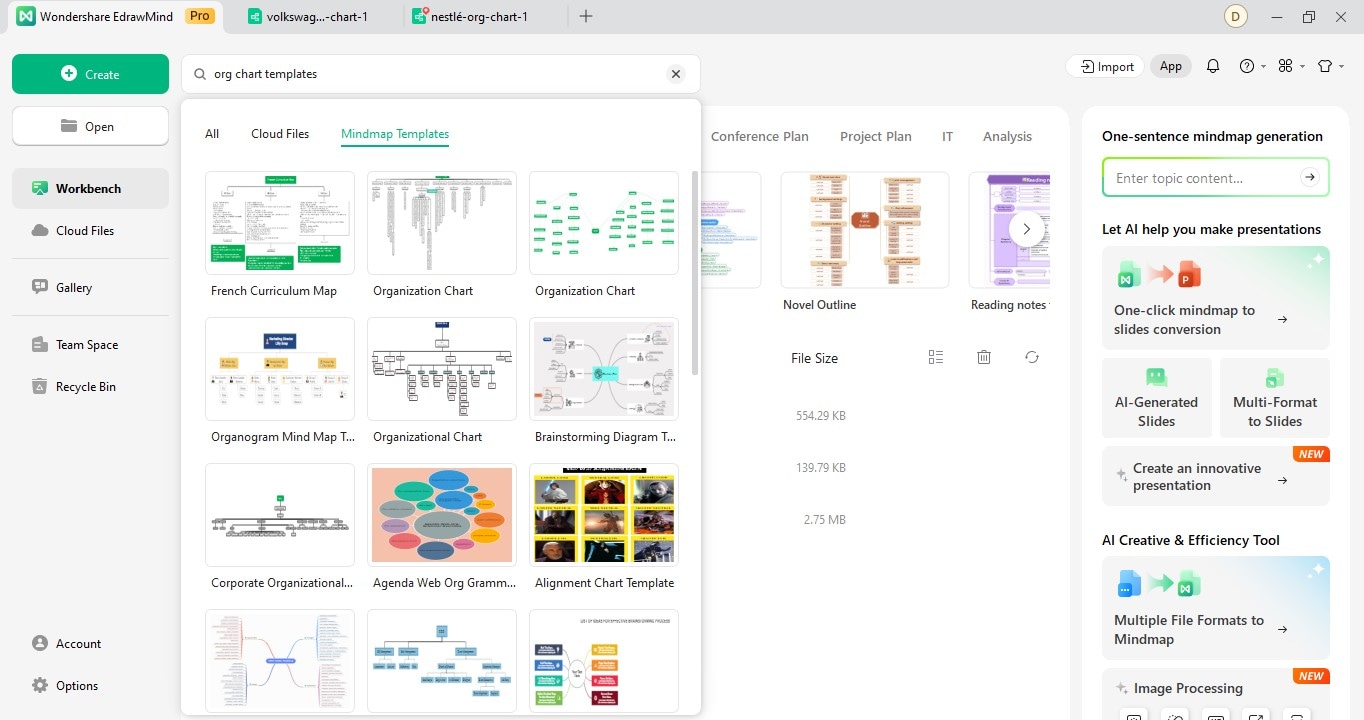
Step 1 Open EdrawMind and Select a Template
Start by launching Wondershare EdrawMind and choosing a template that fits your organization’s structure. EdrawMind offers a variety of templates tailored to different business needs.
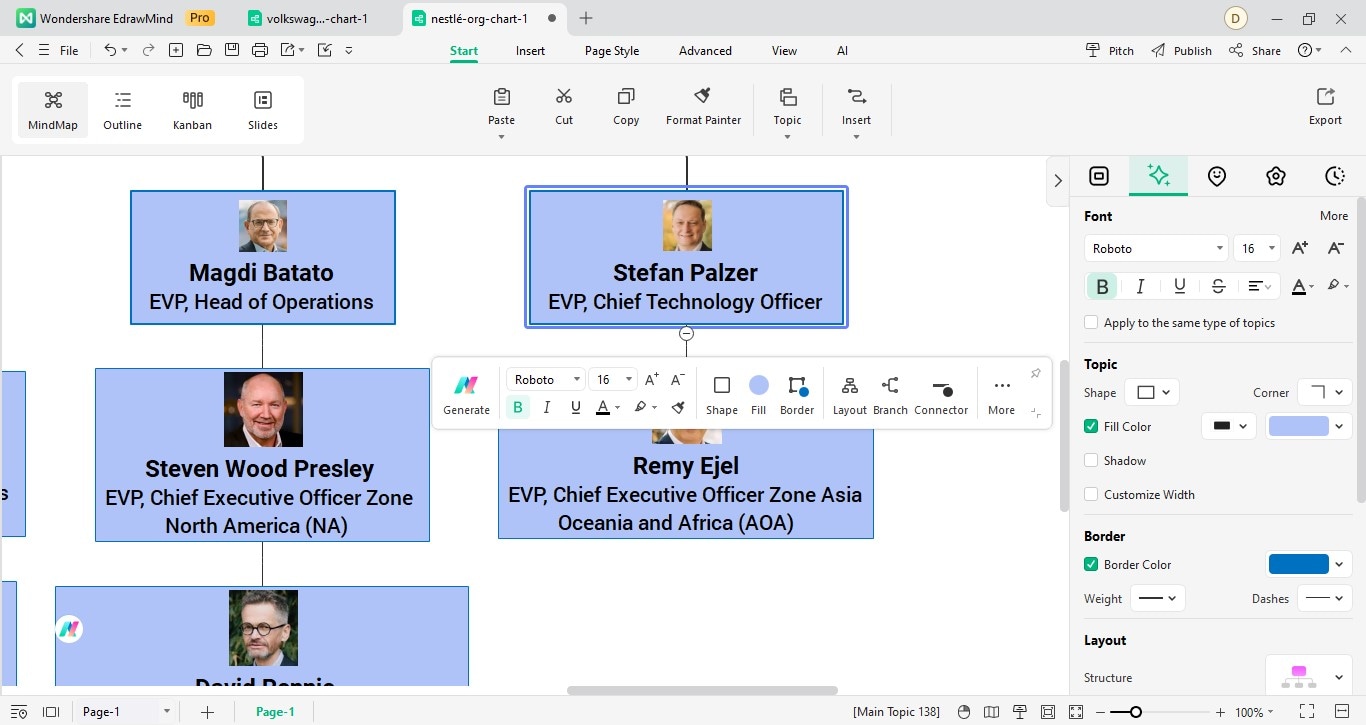
Step 2 Add Key Roles, Departments, and Reporting Relationships
Next, add key roles, departments, and their relationships. Input titles such as CEO, managers, and staff, and then connect them based on the reporting hierarchy.

Step 3Customize the Chart
Customize the chart by adjusting colors, fonts, and icons to match your company’s branding. This personalization ensures your org chart is both professional and visually appealing.
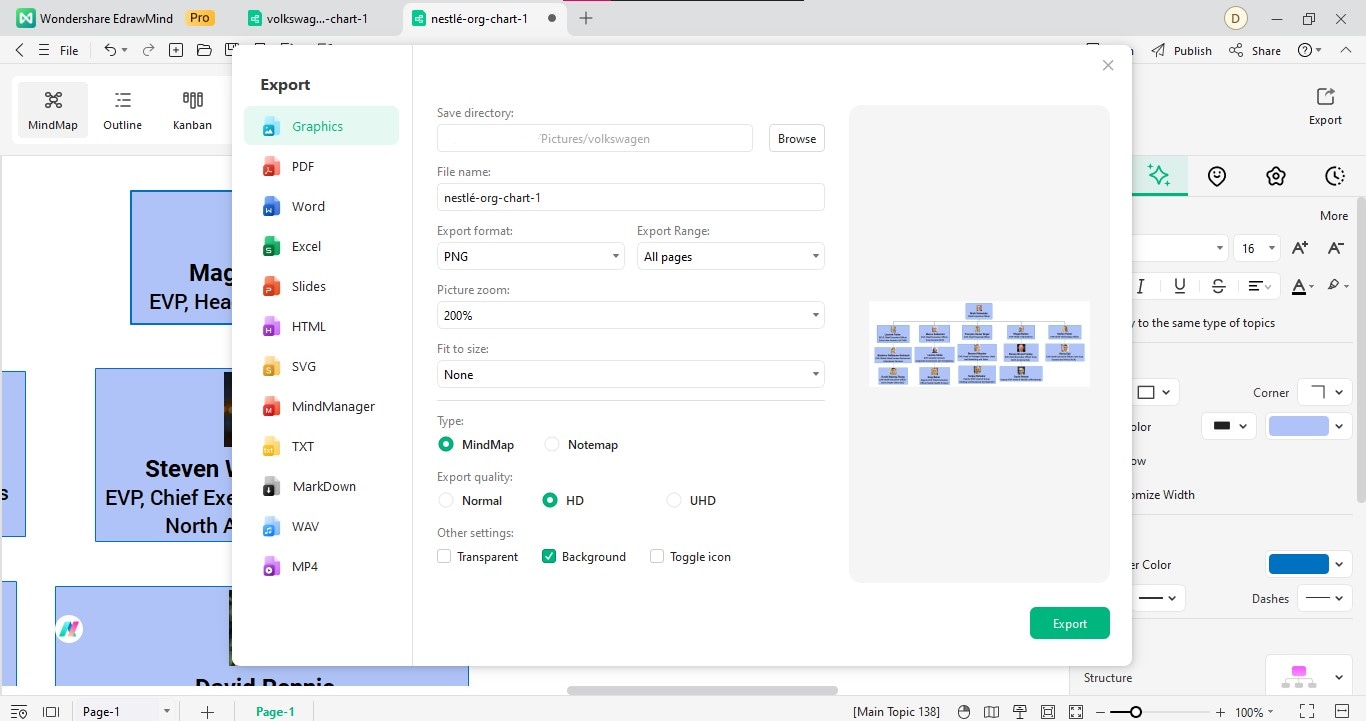
Step 4 Export the Chart
Once you’re satisfied with the chart, export it in your preferred format, such as PDF, image, or another shareable format, making it easy to distribute or integrate into presentations.
Why Choose Wondershare EdrawMind to Create an Organizational Chart
For companies with complex structures like Nestlé, tools like Wondershare EdrawMind simplify the creation and management of organizational charts. Its user-friendly interface and powerful features allow businesses to quickly create accurate, professional charts, enhancing communication and streamlining operations across different departments.
- Drag-and-Drop Editing: You can easily create and modify your org chart using drag-and-drop functionality, which makes the process intuitive and efficient.
- Real-Time Collaboration: Team members can collaborate on org charts in real time, allowing instant updates and feedback.
- Pre-Designed Templates: Choose from various pre-designed templates to suit different business needs, saving time on design and layout.
- Cross-Platform Compatibility: EdrawMind is compatible across multiple platforms, including Windows, Mac, and mobile devices, ensuring easy access from anywhere.
Rating and Testimonials
Wondershare EdrawMind has garnered a 4.6 out of 5 rating on G2, reflecting its strong user satisfaction. Users appreciate its intuitive interface and robust features for creating organizational charts and mind maps.
Jeff R., an Owner/ Developer/ Creator noted, "Very easy, even for a beginner. Highly recommended."
Mugdha S. highlighted, "It has many features which you can choose from when taking out some ideas for your mind mapping. Very detailed outlines."
These testimonials underscore EdrawMind's effectiveness in enhancing efficiency for companies of all sizes.
Conclusion
Nestlé’s continued global leadership in the food and beverage industry is largely due to its robust organizational structure. By integrating regional and product-based divisions through its matrix model, Nestlé effectively manages a diverse portfolio and adapts to local market needs, ensuring operational efficiency and innovation across 190 countries.
Wondershare EdrawMind is the go-to tool for creating effective and visually appealing org charts for businesses looking to replicate this success. Its user-friendly features make it an ideal solution for professionals and companies seeking to streamline organizational management.