


Students often struggle with the same problems because they lack a clear way to trace the causes.
A fishbone diagram offers a simple structure for such analysis. It lets you put a problem in focus and explore various causes.
In this article, I'll share the best Fishbone diagram examples for students. I'll explain how these diagrams work across learning scenarios, so you can shape them to fit your studies.
In this article
What Is a Fishbone Diagram?
A fishbone diagram is sometimes called an Ishikawa or cause-and-effect diagram. It is designed to find the root causes of a problem.
It helps break down messy issues like poor grades, late projects, and exam stress into simple categories.
Purpose
Its primary purpose is structure, so you map every potential reason rather than guessing. This makes it valuable for planning studies, working with classmates, or reviewing what went wrong in a project.
Layout
Like a fish, in this diagram, the head carries the main problem, e.g., a low research paper grade. From the spine, bones expand into areas such as research process, time management, or writing. Each bone has smaller notes, e.g., an unclear thesis or insufficient sources.
Student Applications
- Analyze project setbacks
- Explore exam challenges
- Organize group discussions
- Understand stress patterns in study routines
5 Best Fishbone Diagram Examples for Students
Electrochemistry Fishbone Diagram
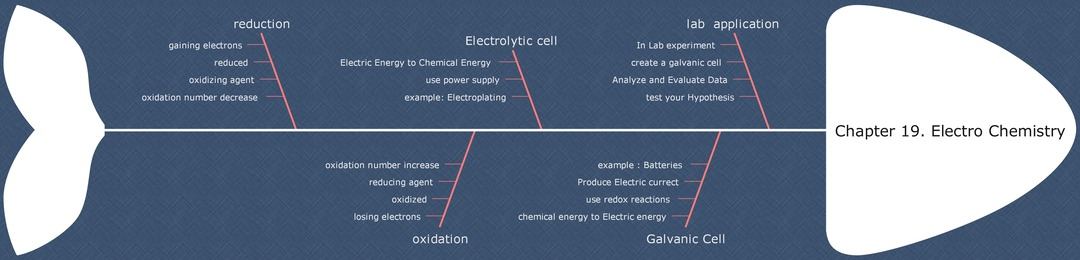
A ready-made chapter summary, the Electrochemistry fishbone puts the topic front and center. It builds clear sections: reduction, oxidation, electrolytic cells, and galvanic cells. Under each section are definitions, reaction details, and small reminders.
The student sees the chapter’s structure at a glance. Each rib signals a key concept; the sub-branches tie those signals into a deeper understanding. That makes details easier to retrieve in exams and in lab work.
Truck Cargo Accident Fishbone Diagram
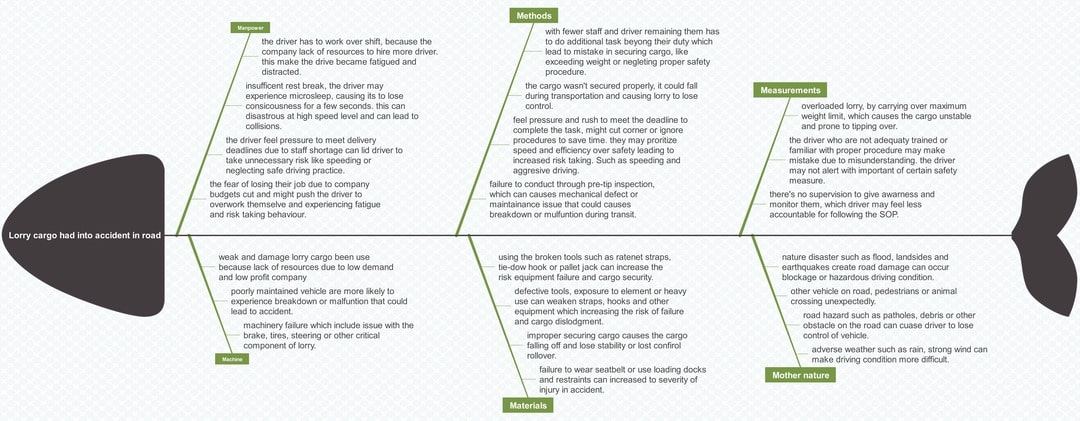
The diagram centers on a Truck Cargo Accident. The main head branches into manpower, materials, methods, and environment.
Each sub-branch contains complete sentences. It lists causes like improper handling, weak packaging, and harsh weather conditions.
For students, it shows how to write full explanations rather than brief points. It suits engineering and logistics learners who must assess risks in detail.
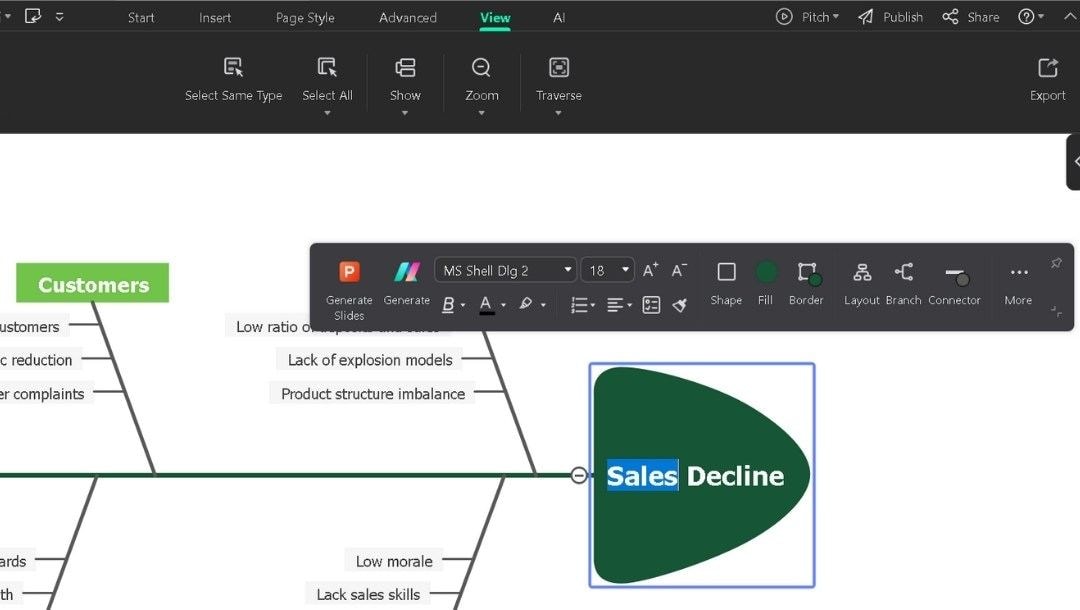
Sales Decline Fishbone Diagram
When exploring business problems, the Sales Decline fishbone diagram example works well.
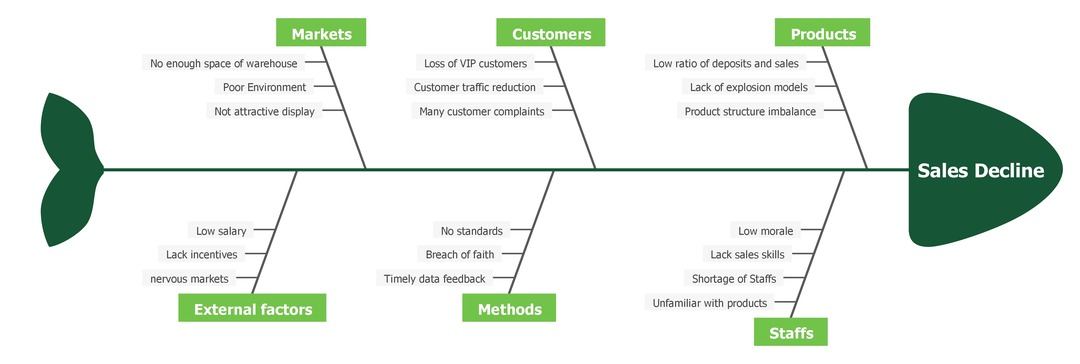
Its head is labeled as Sales Decline. Ribs cover things like markets, customers, products, methods, and staff. Each bone digs into causes such as poor promotion, evolving customer needs, or gaps in product variety.
This format provides order when handling case studies or practice problems. Students can avoid random lists and write more coherent explanations.
Accounting Concepts Fishbone Diagram
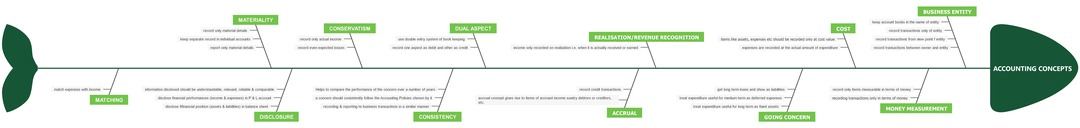
The Accounting Concepts fishbone makes dense topics manageable.
At the head is Accounting Concepts. Branches cover core ideas: dual aspect, accrual, and matching. Each sub-branch contains a brief definition and a short explanation.
Students can compress long chapters into clear visual notes. Seeing connections among principles helps recall for exams.
It is also helpful for presenting material in class or in group study.
UG Mentorship Fishbone Diagram
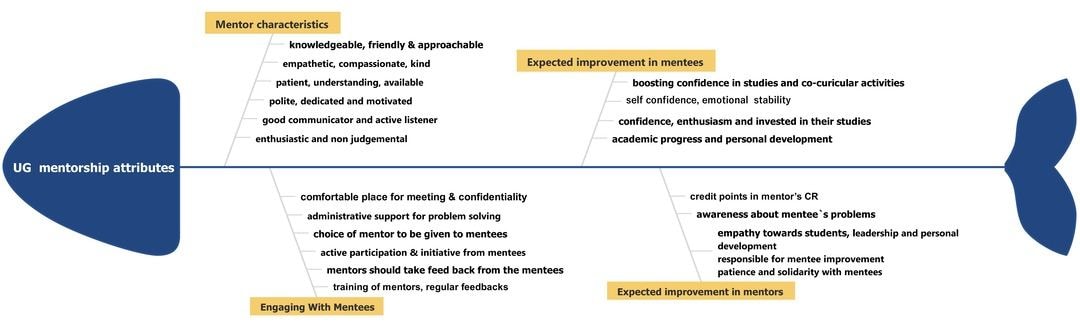
The UG Mentorship fishbone diagram is designed for undergraduate mentorship programs. Mentorship Outcomes form the head, with branches for mentor traits, engagement, and expectations. These extend into qualities, including feedback, motivation, and availability.
Students in education and psychology can use the model to examine peer programs, group work, or campus activities.
The diagram organizes less tangible aspects of mentorship into something measurable and clear. It can uncover reasons a program succeeds for some while failing others. That makes it a practical way to evaluate subjects that aren’t technical.
How to Find and Use Fishbone Diagram Examples
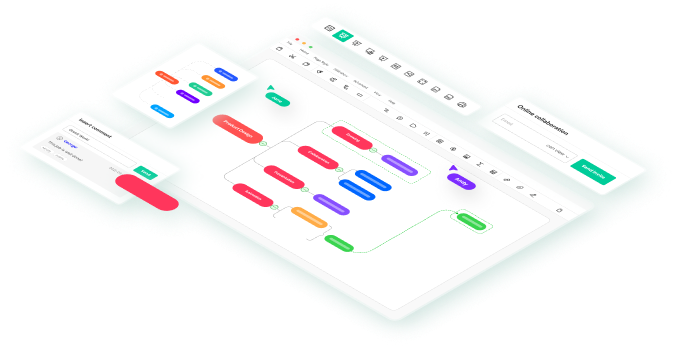
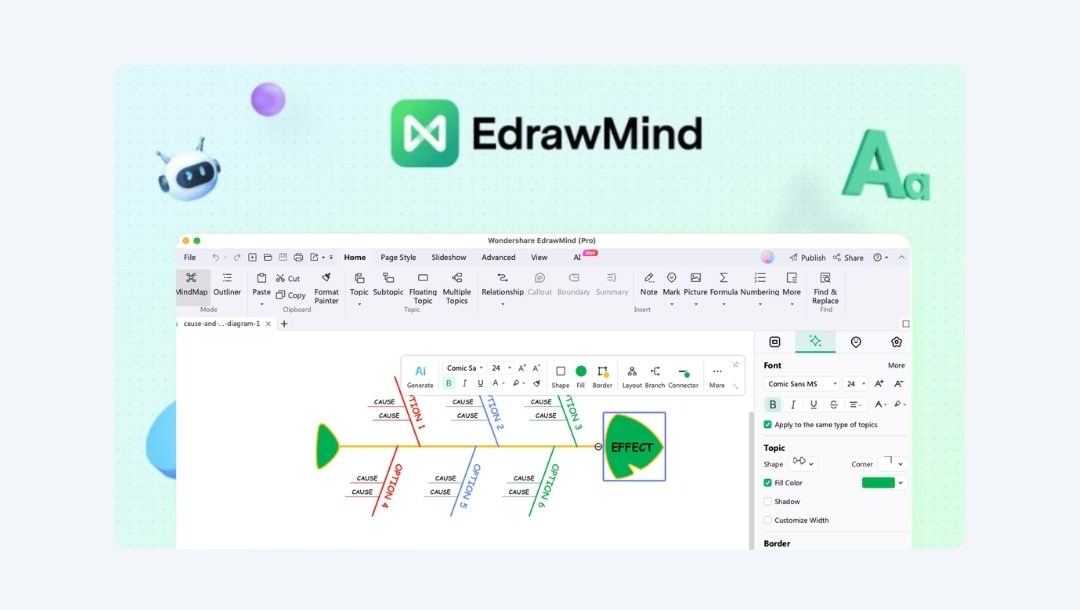
EdrawMind is an advanced fishbone diagram tool especially shaped for students and small teams. It bundles a template gallery, simple editing controls, and export options. You can even move work into slides or documents without rebuilding diagrams.
If you need to draft or share a fishbone diagram quickly, EdrawMind lets you start from a ready layout. You can add causes and evidence, then export the result for a report or group review.


Vast Templates Community
EdrawMind hosts an extensive collection of user-contributed fishbone templates that cover topics students often need: project delays, lab results, literature themes, and case-study analyses.
Each shared template shows category labels and sub-causes you can reuse or adapt. The gallery lists dozens of fishbone layouts that differ in rib count, label style, and space for notes.
How to Use and Edit a Fishbone Template in EdrawMind
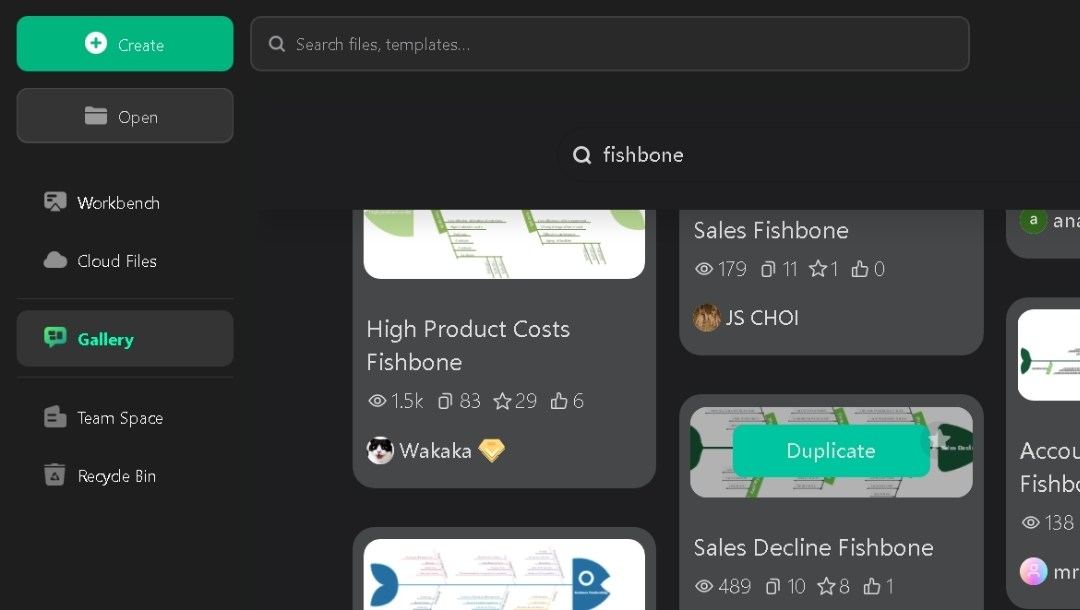
Step 1: Choose a Fishbone Template
- On your Edrawmind Homescreen, search the template gallery for “fishbone” or “Ishikawa”.
- Duplicate the layout that fits your scope (3–6 ribs is common for student tasks).
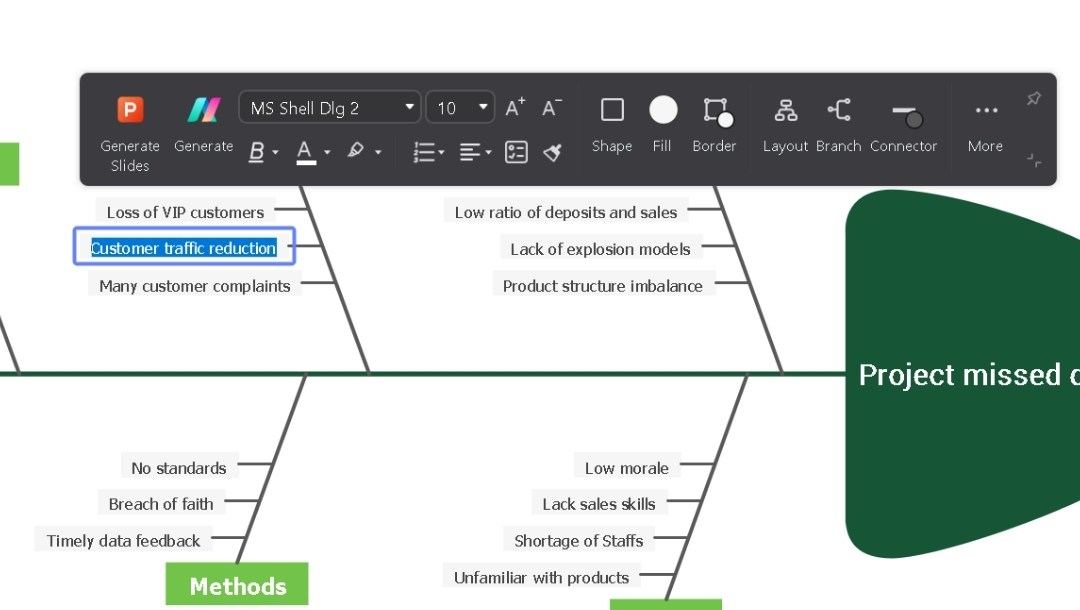
Step 2: Define the Problem at The Head
- Double-click to edit its problem (head); concise outcome, or question, for example, “Low lab accuracy” or “Project missed deadline.”
- Keep it short and quick.
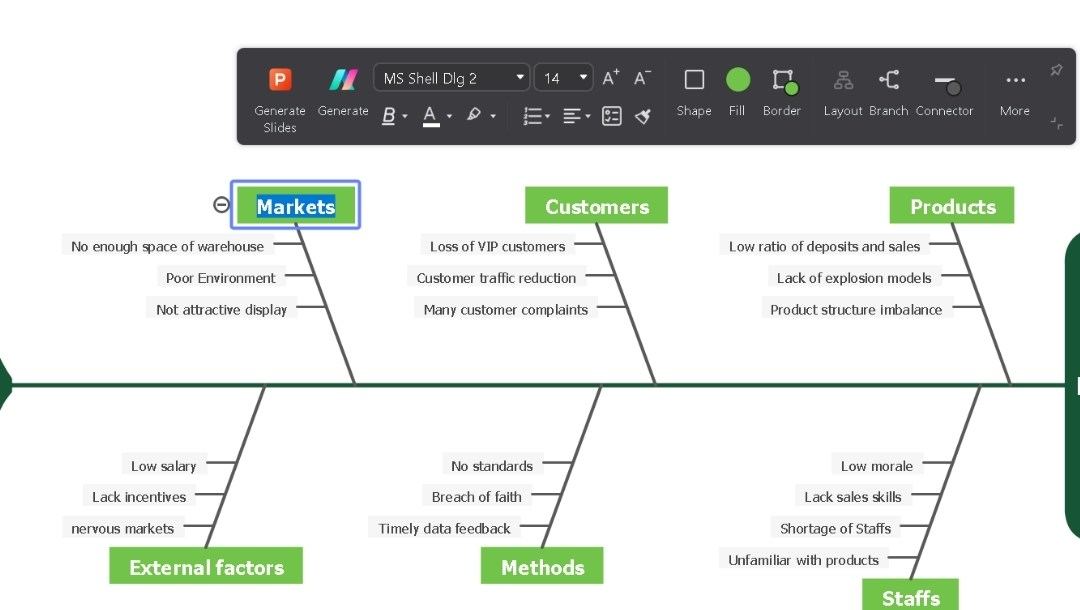
Step 3: Replace Category Labels
- Rename ribs to match your context: people, methods, materials, measurement, environment, or time.
- Limit each category to 5–7 causes.
Step 4: Add Sub-causes and Evidence
- For each branch, add short cause statements and cite a data point or observation beside the cause (e.g., “calibration date: 2024-11-03”).
- That distinction separates assumptions from facts.
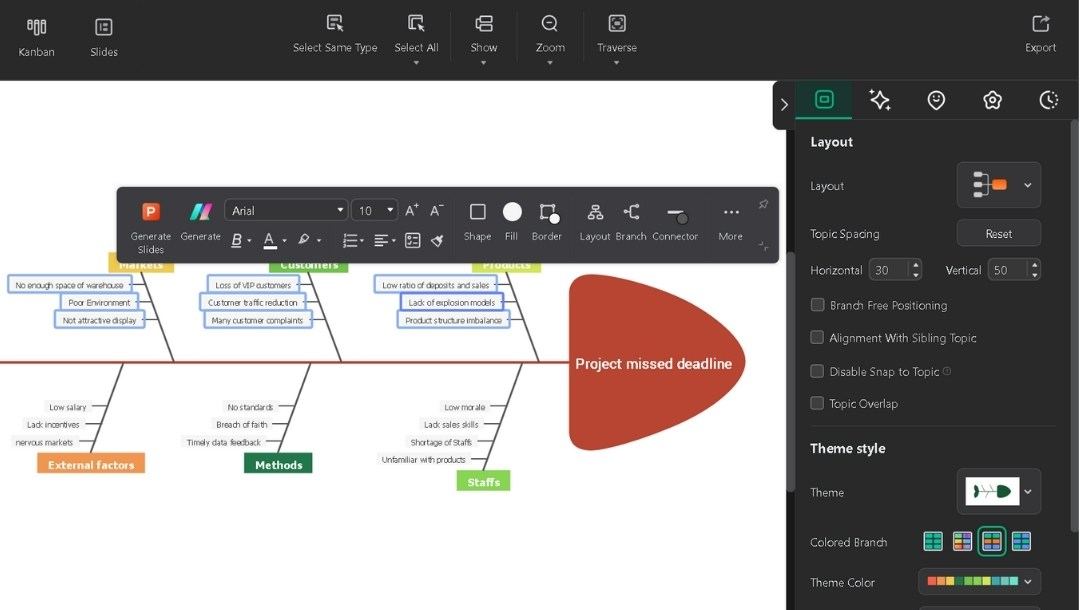
Step 5: Style and Color-code for Meaning
- Color-code everything for better visuals.
- Select any element to modify its style, color, shape, and more.
- For quick theme modification, try the right side panel.
- Use one color for evidence-backed causes and another for hypotheses.
- You can also apply a simple legend so viewers understand your coding.
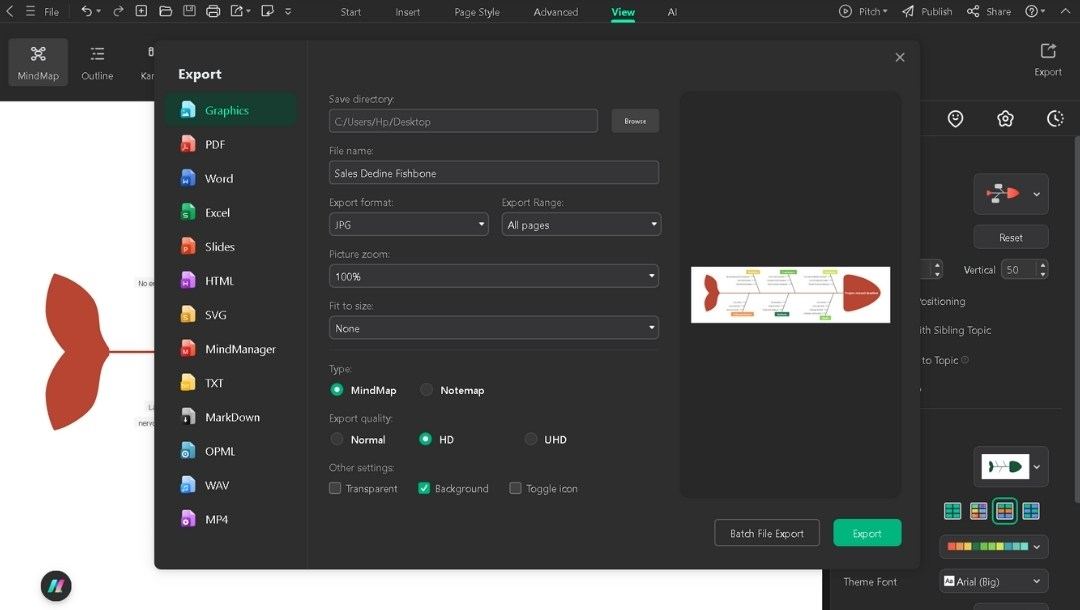
Step 6: Export or Share
- Click the Export icon in the upper panel or go to the File menu to access it.
- Export to PowerPoint, Word, or PDF for submission or copy a share link for group editing.
Why Students Should Use Fishbone Diagrams
Fishbone diagrams give students a simple structure to handle complex topics and tasks.
Breaking Down Complex Topics
Instead of facing dense chapters, students can break them into smaller sections. In biology, diseases can be grouped into causes, symptoms, prevention, and treatments. Each branch holds only the essentials.
Supporting Group Assignments
When working in groups, confusion often comes from unclear roles. Assigning each branch to a member solves this.
In marketing projects, for example, one student handles research, the second manages the budget, and the third addresses promotion. Responsibilities stay visible and balanced.
Preparing for Exams
Revision becomes faster when long notes are condensed into a one-page diagram. A topic like climate change can be split into human activity, natural processes, policies, and energy use. The branches hold quick reminders that cover the whole subject.
Sharpening Research and Writing
Before drafting essays or papers, a fishbone diagram serves as an outline. It prevents missing vital angles and creates a clear foundation for writing.
Enhancing Presentations
In class presentations, it serves as a visual aid. It facilitates the presenter to explain reasoning clearly and helps the audience follow without effort.
Building Critical Thinking
Each diagram encourages students to go beyond surface learning. By mapping causes and effects, they learn to analyze, not just memorize.
Tips for Creating Effective Fishbone Diagrams as a Student
Start With a Clear Problem
Define the issue precisely. Just like missed homework or trouble remembering formulas, a focused example sets direction. Broad phrases, such as 'struggling with school,' may only create confusion.
Organize Into Categories
Sort causes into themes, study habits, time management, resources, communication, or research process. This structure keeps the analysis balanced and complete.
Keep It Visual
Write short phrases, not sentences. Add sub-branches for details. Use colors or symbols to highlight urgency and make scanning easier.
Collaborate When Needed
In group work, let everyone add causes under different branches. Then, agree on the top issues to focus on. Revisit the diagram to keep it updated throughout the project. Use tools like EdrawMind for live collaboration.
Connect to Action
For each major cause, suggest a fix. Place “create a study schedule” under “poor time management”. It makes the diagram both diagnostic and practical.
Apply Widely
Use the diagram for exam prep, research, or daily study routines. It maps causes, reveals patterns, and points to clear next steps.
Final Words
Memorization has limits, but fishbone diagrams open the door to fundamental analysis. By laying out causes and effects, students reveal links that strengthen answers in tests, reports, and talks.
You've seen examples here from fields as different as chemistry, healthcare, mentorship, and sales, proving the method’s reach.
With one page, you replace stacks of notes and gain a map for both study and discussion.
EdrawMind helps by offering templates ready to adjust to any project. Once tailored, export them into Word, PowerPoint, or PDF.
What you get is a clear, functional diagram for study, group sharing, or class presentations.
