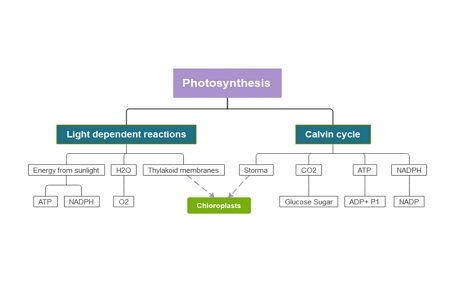
What is a photosynthesis concept map?
A strong photosynthesis map links inputs, locations, reactions, and outputs with labeled relationships. Current concept-map results consistently center on sunlight, chlorophyll/chloroplasts, water, carbon dioxide, oxygen, ATP/NADPH, and sugar-related outputs.
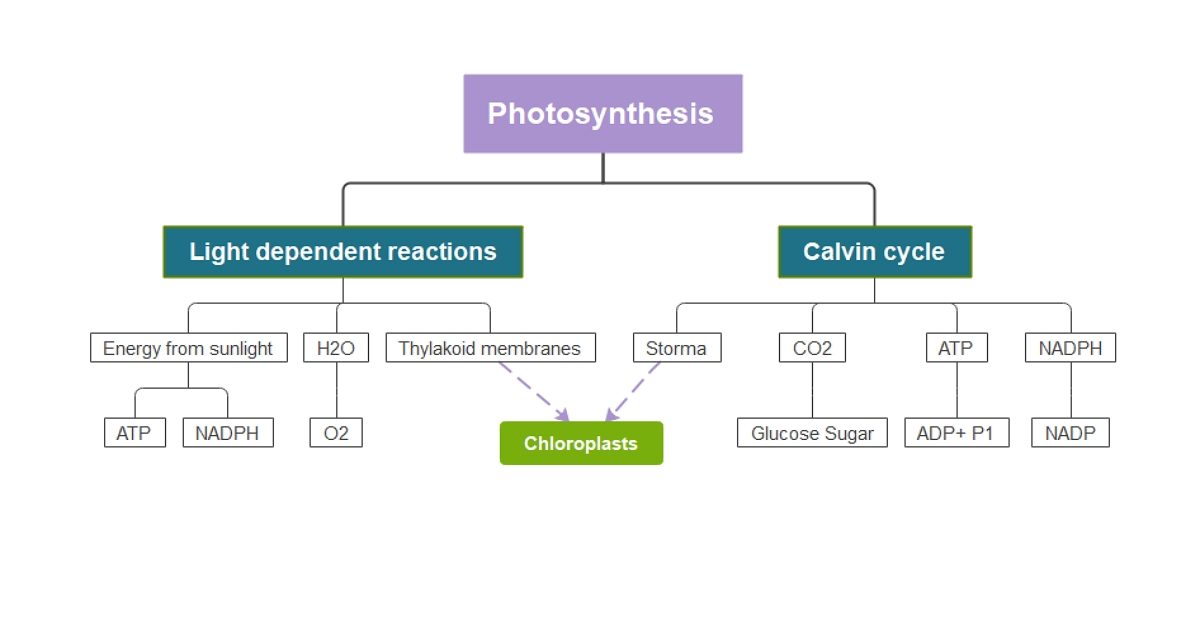
Scientific anchor: OpenStax separates photosynthesis into light-dependent reactions in the thylakoid membrane and the Calvin cycle in the stroma. The light reactions use water and release oxygen while producing ATP and NADPH; the Calvin cycle uses that chemical energy to fix carbon dioxide into G3P, a precursor for carbohydrates.
Photosynthesis is how green plants and particular organisms take in light energy and transform it into chemical energy. As photosynthesis occurs in green plants, they capture light energy and convert carbon dioxide and water into oxygen and other energy-rich organic compounds. This process usually happens in the leaves of the plant.
Just by reading how photosynthesis takes place, you can conclude that it is a complicated one. But you can learn it at ease with the help of a photosynthesis concept map. A concept map is a visual illustration of information arranged hierarchically. Concept mapping aims to break down a specific concept or idea into pieces of information and show their relationship through a diagram. This learning strategy is used by most students and has dramatically improved their school performance.
What are the steps of photosynthesis?
Terminology note: avoid teaching the Calvin cycle as a “dark reaction” that happens only at night. OpenStax notes that this label is misleading: the cycle does not use light directly, but it depends on products of the light-dependent reactions and several enzymes are light-activated.
Best study use: add linking phrases such as “absorbs,” “occurs in,” “produces,” “releases,” and “powers” so each branch reads as a scientific relationship rather than a list of terms.
The leaf's stomata absorb the carbon dioxide, and the water enters through the leaf's root hair cells. Together with the absorbed light from the sun, carbon dioxide and water are then converted to oxygen and glucose. The oxygen is released through the leaf's stomata, and the glucose is distributed around the plant.
The Pomodoro Technique worksheets will assist you in time management by allowing you to take brief, regular breaks. Worksheets based on the Pomodoro Technique can also help you learn to effectively estimate how much effort and time academic assignments will take.
Benefits of using a photosynthesis concept map
Concept maps are proven not just as a learning strategy but also as a teaching strategy. This fact supports the claim of many researchers that concept maps are highly beneficial. If you are still in doubt about how a photosynthesis concept map can help you, here are some benefits that you should know.
- It breaks the process of photosynthesis into minor information so that you can understand it better.
- It lets you see the bigger picture of how photosynthesis takes place.
- It develops your logical and critical thinking.
- It enables you to organize the process of photosynthesis visually.
Photosynthesis concept map templates
Concept maps can be in flowcharts, charts, diagrams, timelines, etc. A box or any shape represents a piece of information and is called a node. A line or arrow then connects these nodes to show their relation to each other. You can use online software to construct your concept map. Here are some templates where you can take ideas.
Example 1
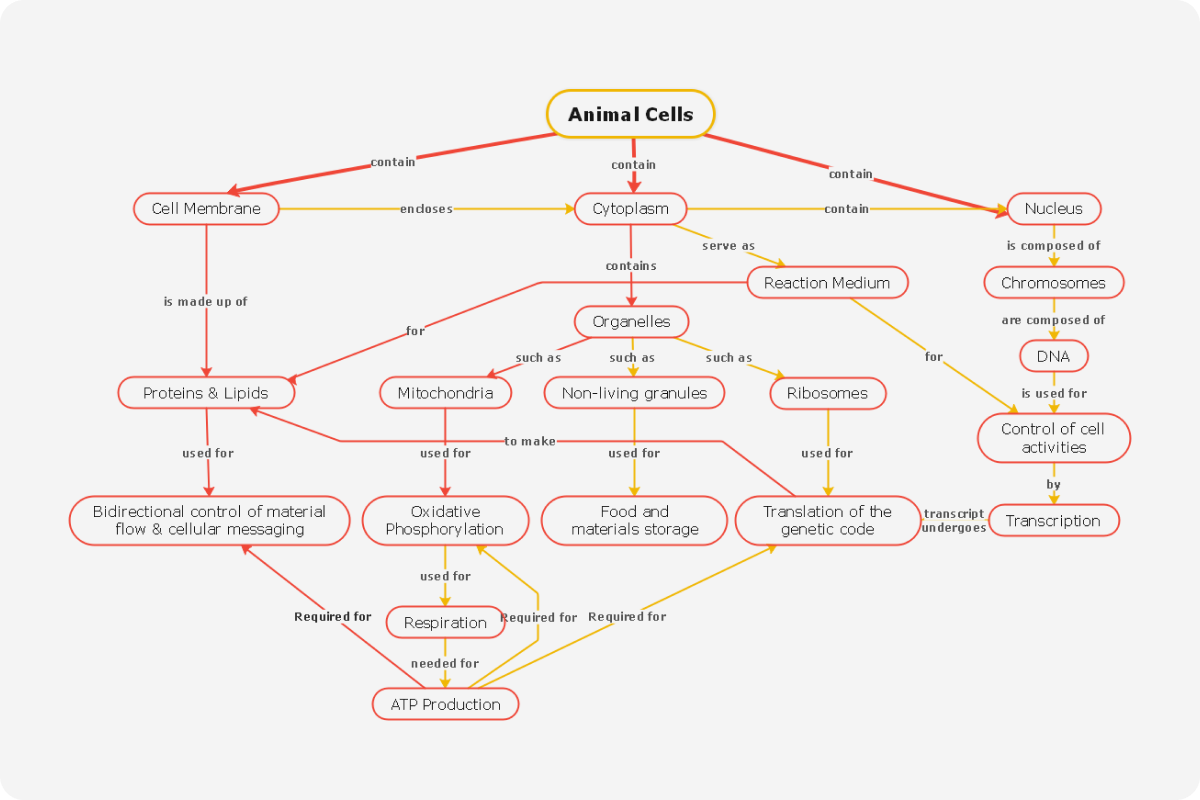
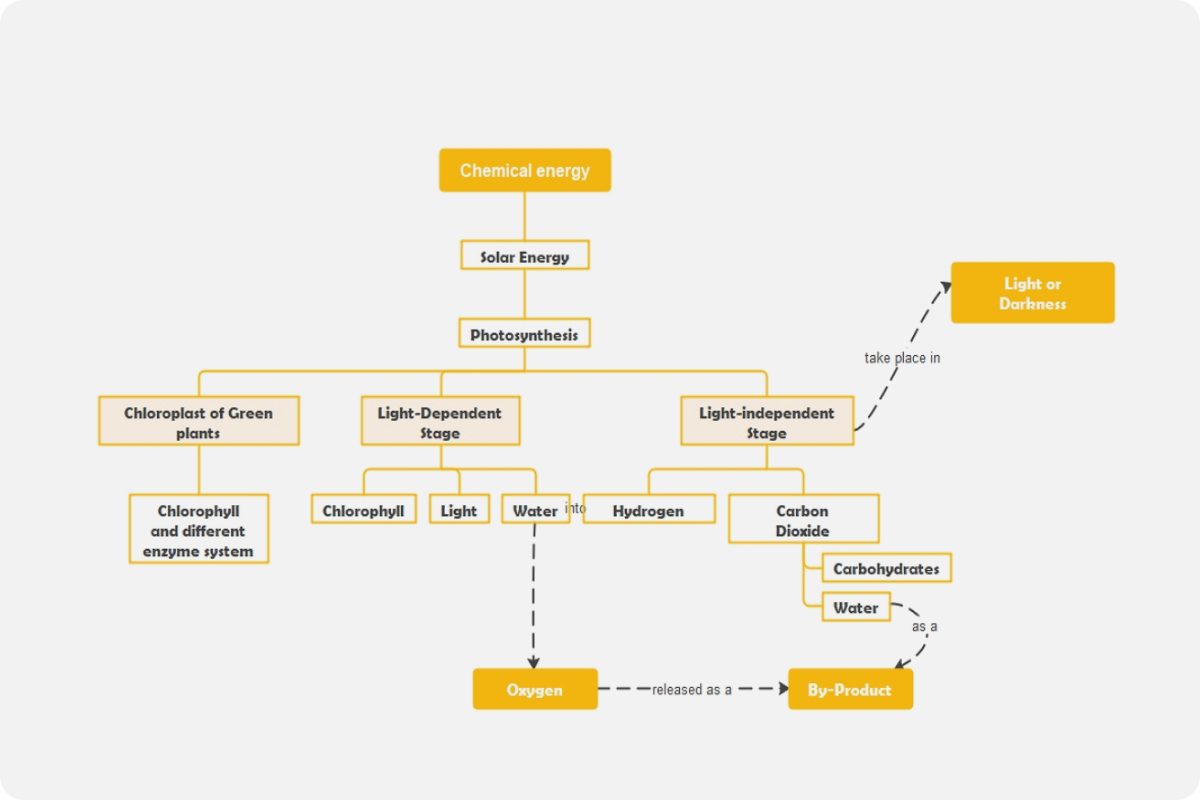
The first example shows the usual design of a concept map. Shapes represent the nodes, and they are connected with lines with arrowheads. Phrases are also beside the lines to help users better understand each relationship.
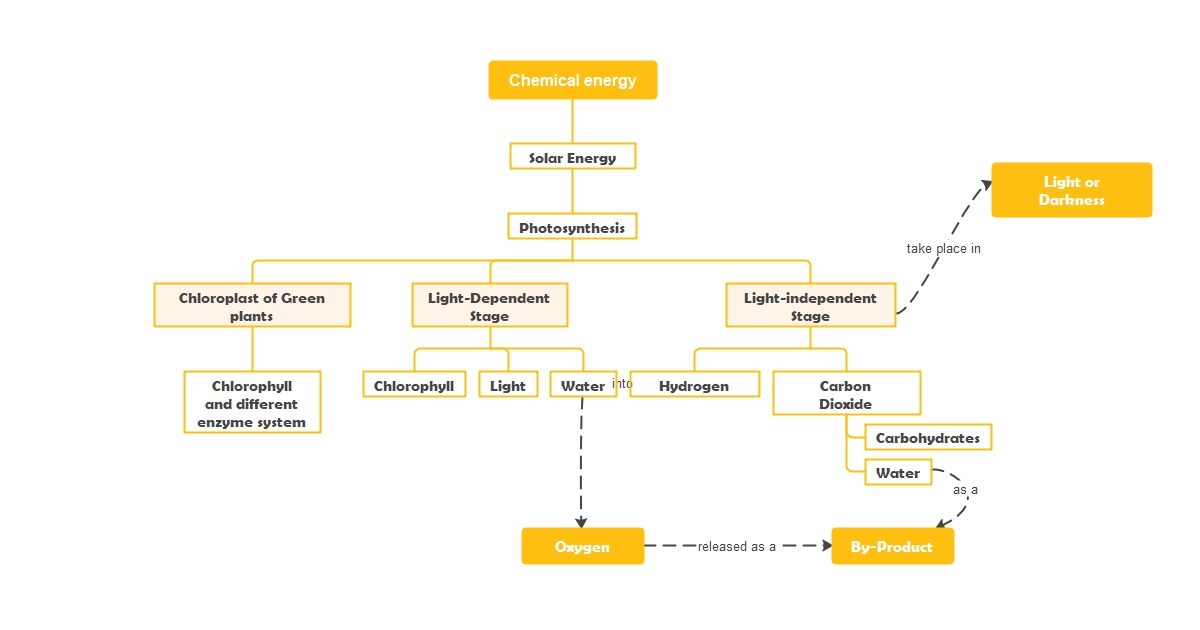
Example 2
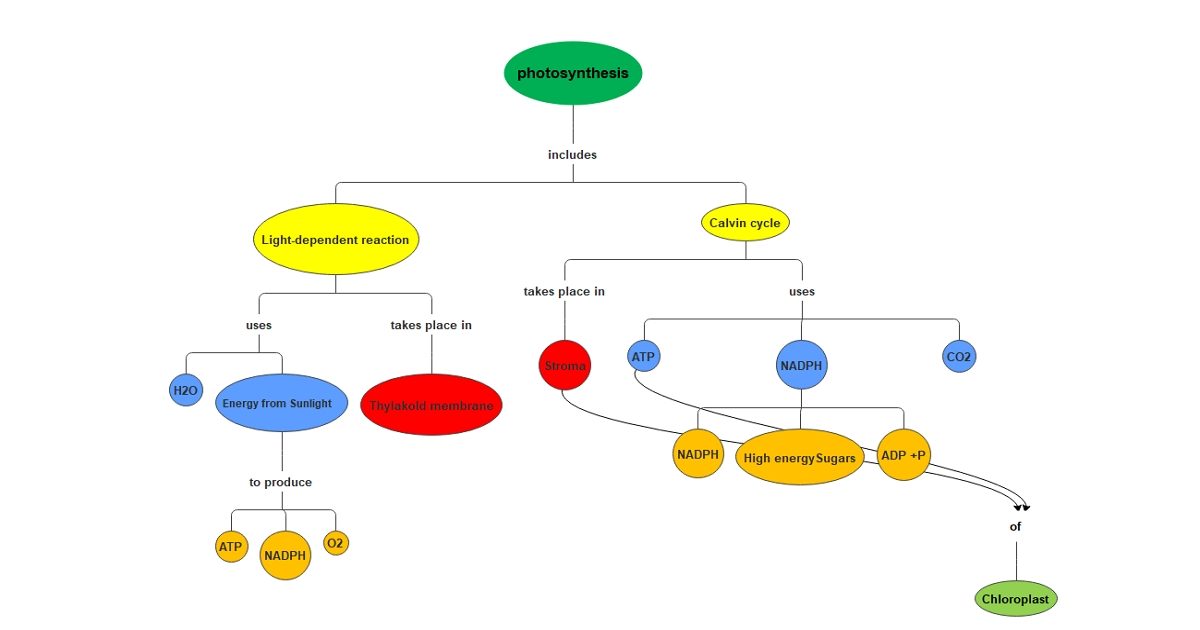
Example 3
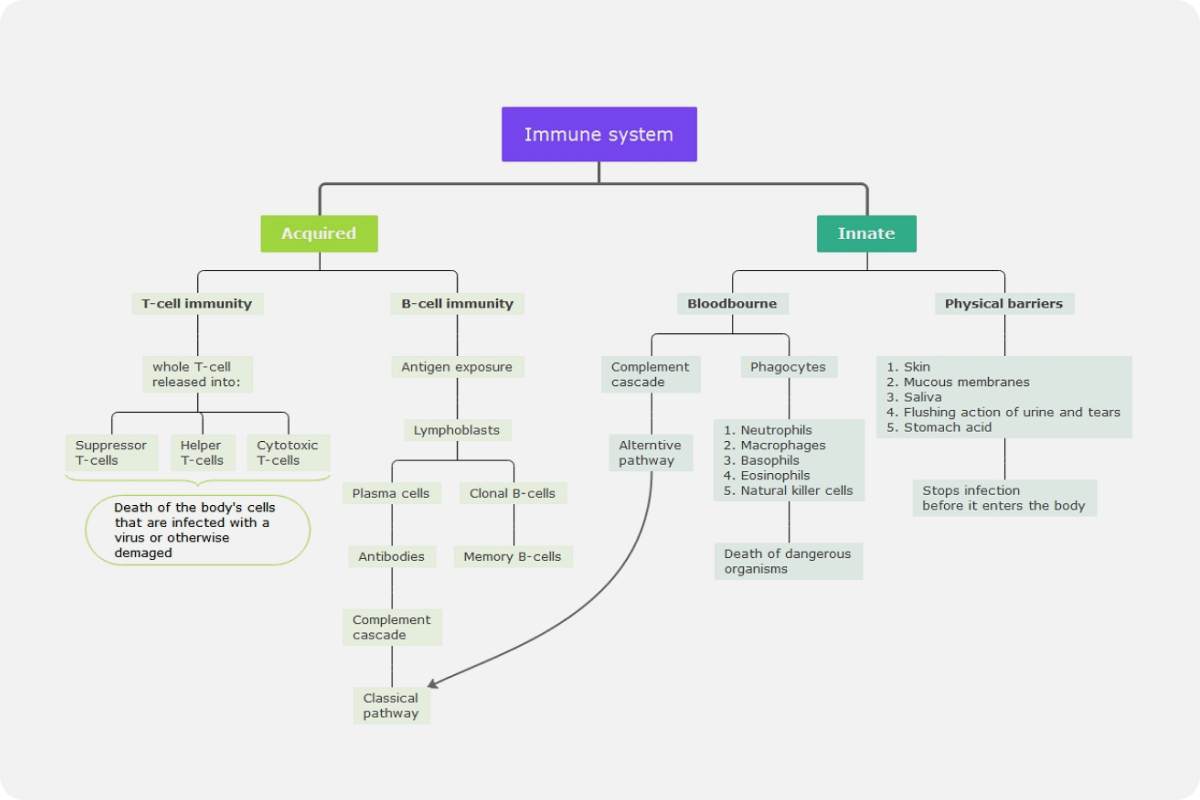
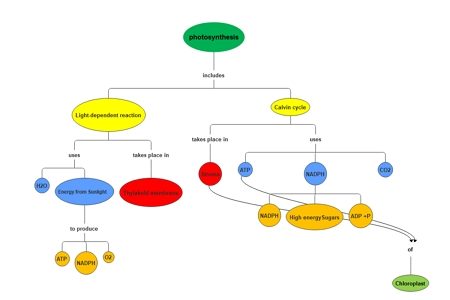
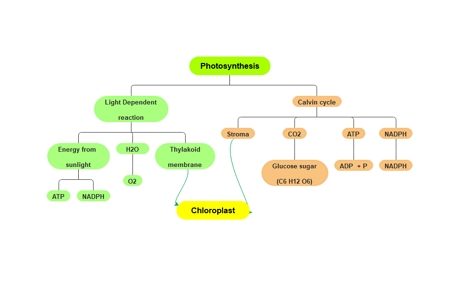
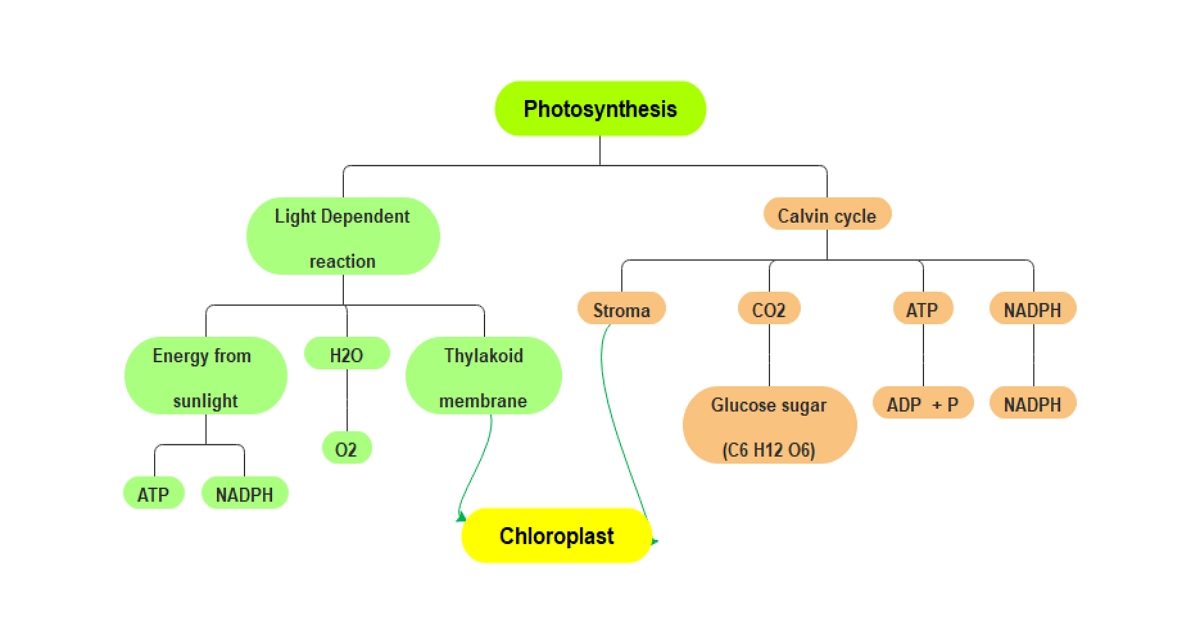
The third template below is just like the two previous ones design-wise. They only vary on the number of nodes each author made. You can see that these templates make learning photosynthesis very interesting. The diagram is a hierarchical pattern and uses several colors to classify every related element. Despite using complicated terms and formulas, you can see that it is strategically organized to avoid confusion.
Why EdrawMind?
EdrawMind is a full-featured collaborative mind mapping and brainstorming tool. It is convenient and helpful for you to use EdrawMind to sort out your thoughts, visualize ideas, take notes, plan projects and more importantly, find solutions to problems.
Users are allowed to insert different kinds of objects into topics and mind maps in EdrawMind, including relationship line, boundary, callout, summary, mark, clip art, picture, hyperlink, attachment, note, comment, and tag. EdrawMind offers you a simple way to create mind maps on Windows, macOS, and Linux. Download the desktop version and try the free online version now!