An organizational chart is important for businesses, organizations, or companies. It gives the employees or members a clear representation of the hierarchy within their group. It shows you an overview of relationships among staff. This way, everyone is informed of whom they should report to or give commands to.
Technology has made it so much easier to create an org chart. You can find many ways to create one today. However, one of the most reliable and popular ways to craft these org charts is through PowerPoint. This article will explore how to use PowerPoints to create organizational charts.

In This Article
Understanding Organizational Charts
An organizational chart is a visual representation of how an organization works. It serves as an overview of the company's roles, positions, and connections. Organizational charts help employees understand their responsibilities. The charts also help with establishing reporting lines and communication channels.
1. Usual Roles in an Organizational Chart
Typically, an organizational chart includes the critical roles within the organization. These roles can vary depending on the size and nature of the company. Some common positions include:
- Chief Executive Officer (CEO):The CEO is the highest-ranking individual in the organization. He is responsible for making significant decisions and setting the strategic direction.
- Department Heads/Managers:These individuals oversee specific departments or functional areas. These may include Finance, Human Resources, Marketing, and Operations.
- Team Leaders/Supervisors:Team leaders or supervisors manage teams or employees.
- Staff Members:These employees work within the organization. They carry out various tasks and responsibilities based on their roles and positions.
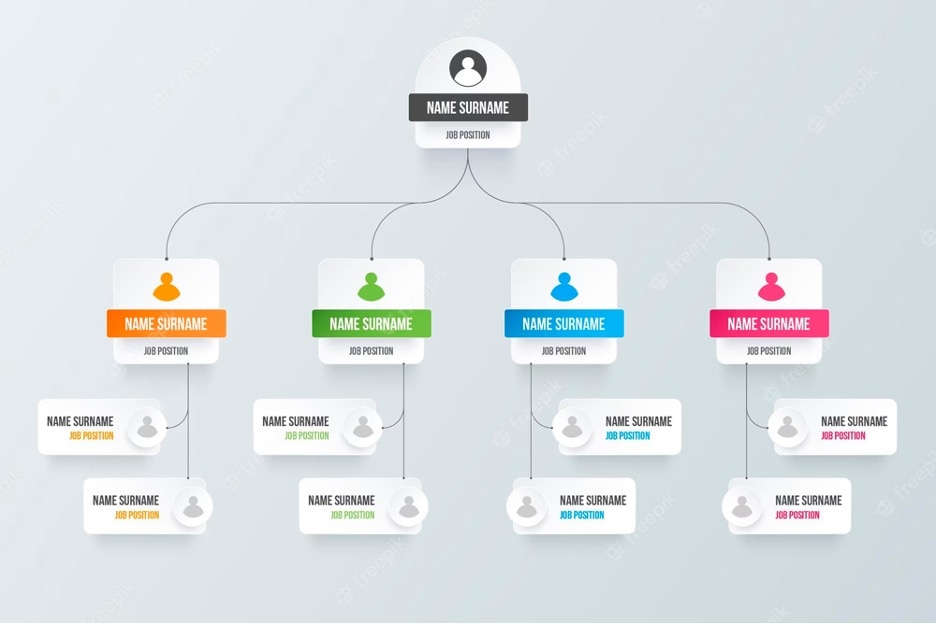
2. What To Consider When Creating Org Charts
When writing an organizational chart, you need to consider several points. It's important to represent the reporting relationships accurately. The flow of authority within the organization should also be displayed. It will help if you use straightforward job titles and descriptions to ensure everything is clear.
3. Types of Organizational Chart
There are different types of organizational charts, each serving a specific purpose. Some common types include:
- Hierarchical Organizational Chart:This is the most traditional form, depicting the organization's structure in a top-down approach. The CEO is at the top. Various departments and positions branch out below.
- Matrix Organizational Chart:Employees are grouped in a matrix structure based on function and product/project. This type of chart highlights cross-functional teams and their relationships.
- Flat Organizational Chart:This chart eliminates multiple layers of management. It emphasizes a more decentralized approach. It promotes a collaborative work environment and enables faster decision-making.
Creating a Functional Organizational Chart With PowerPoint
Microsoft PowerPoint is a versatile tool that goes beyond presentations. Yes, it is known for its ability to captivate audiences. However, people can also use PowerPoint for various purposes. For example, it can create organizational charts. It has a user-friendly interface and extensive design features. It's also compatible with other Microsoft Office applications. This makes PowerPoint ideal for creating functional and appealing organizational charts.
1. Creating an Organizational Chart With PowerPoint
To create an organizational chart in PowerPoint, follow these simple steps:
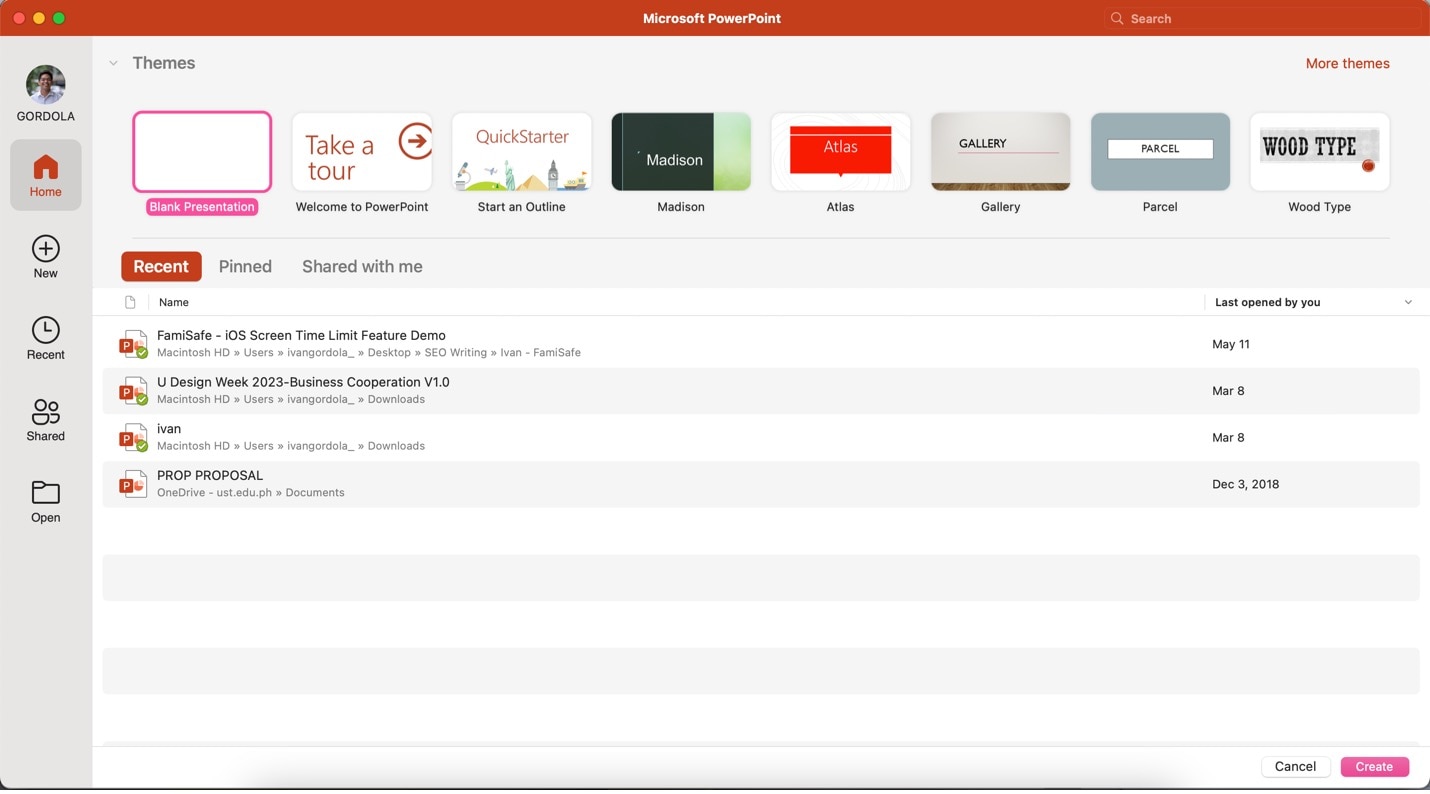
Step 1: Open Microsoft PowerPoint and create a new presentation.
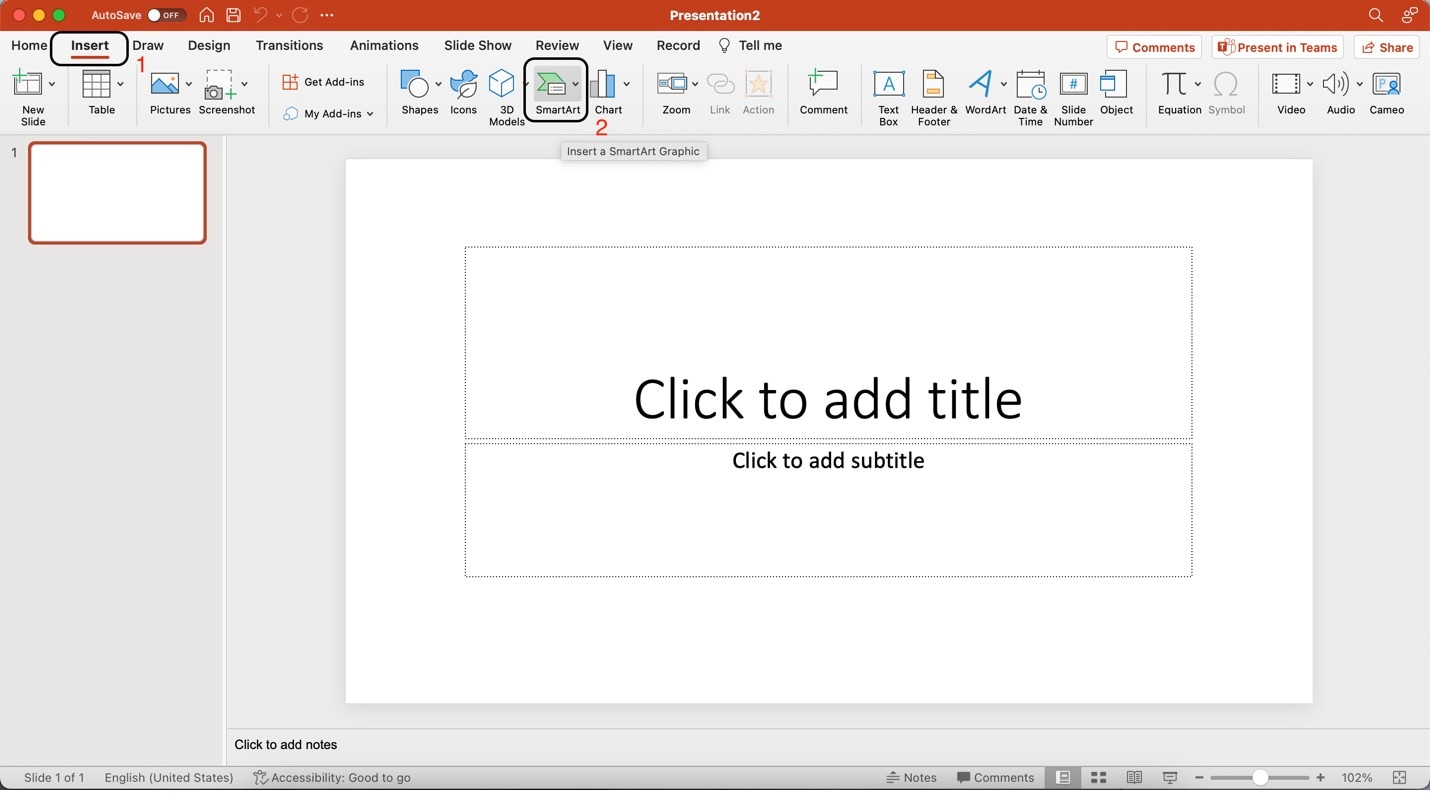
Step 2: Click the Insert tab at the top of the PowerPoint window and navigate to the SmartArt option.
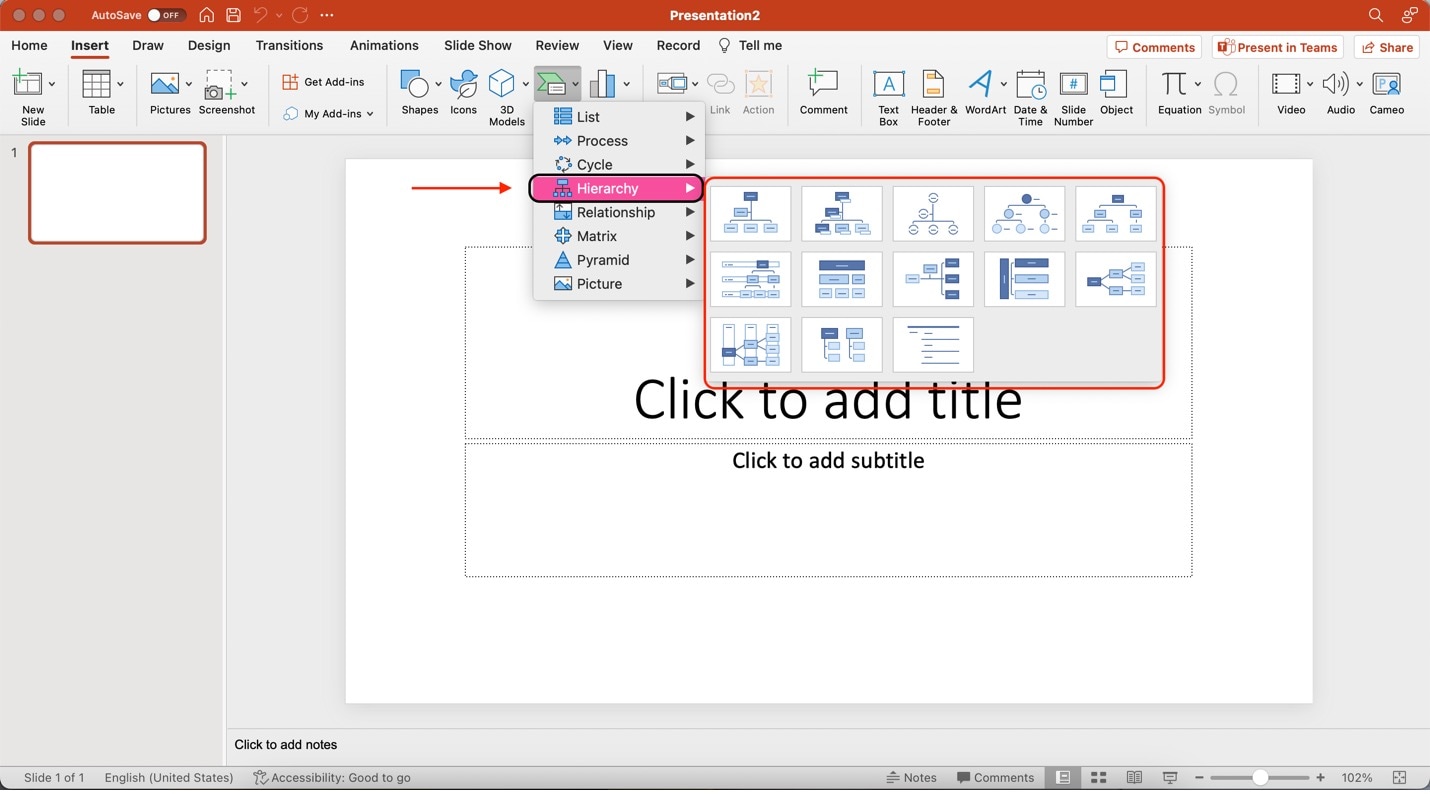
Step 3: Choose the Hierarchy category in the SmartArt menu. You will see various organizational chart layouts. Please select the desired organizational chart layout by clicking on it. It should be displayed on your slide afterward.
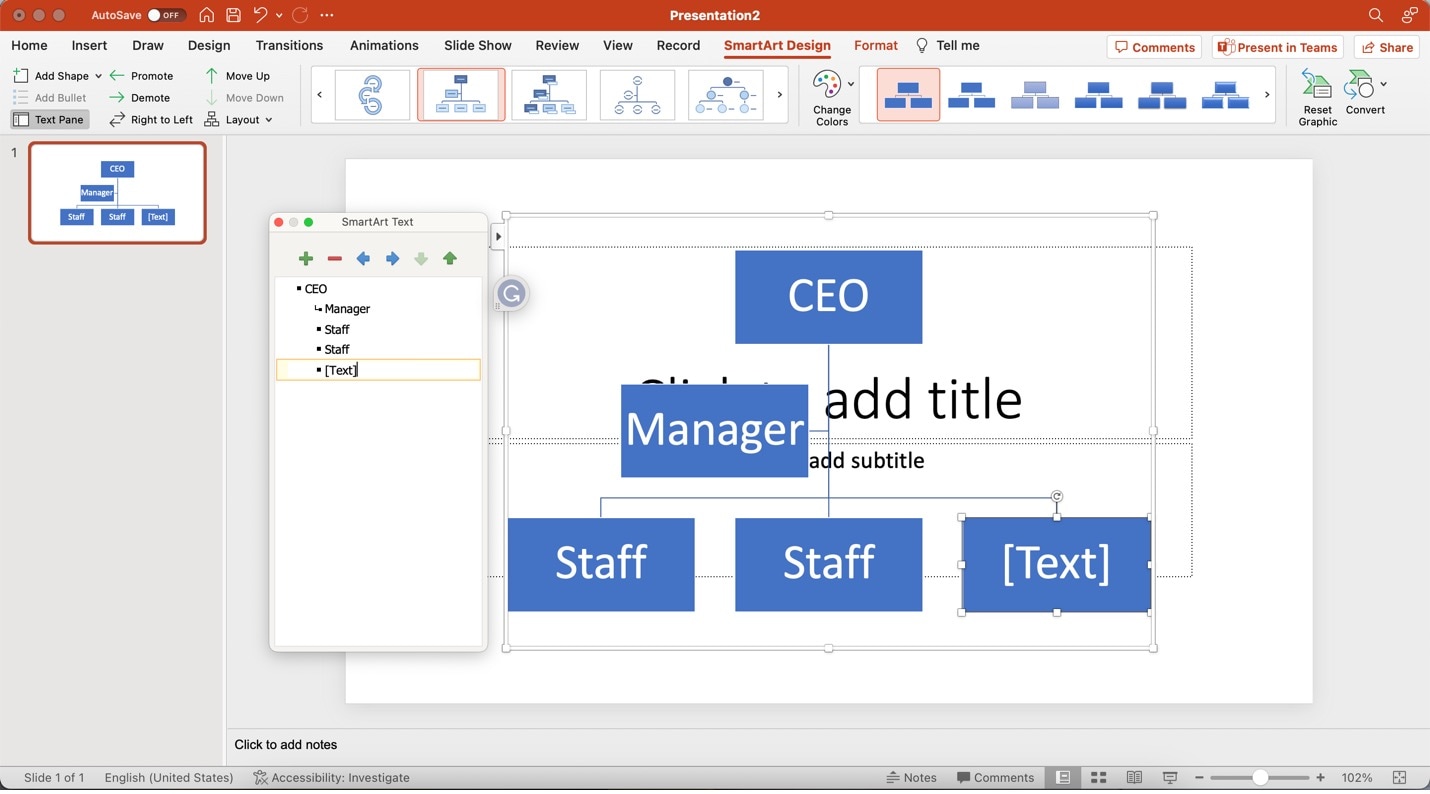
Step 4: Once you have chosen a chart, edit the text using the SmartArt Text box. This window appears when you click on the chart. Edit the [Text] fields accordingly.
2. Tips To Make Organizational Charts in PowerPoint
Exploring and using a new application can be challenging. It's difficult to think of ways to help you make the most of PowerPoint, especially if you're new to the application. This section will discuss some tips that you can use to create org charts in PowerPoint.
- Using Shapes/Symbols: Customize your organizational chart using shapes and symbols. These can be used to represent different positions and roles. You can modify their size, color, and style to enhance them. You can connect the forms using lines or arrows to show reporting relationships.
- Using Pre-Made Templates:PowerPoint offers a wide range of pre-made templates designed to create charts. These templates provide a professional and polished look that saves time and effort. Browse through the templates in the “SmartArt” menu. You can also explore online resources for additional templates.
- Maximizing the Use of Media Elements:Incorporating media elements like photos and videos can enhance your organizational chart. You can add pictures of key personnel to their respective positions. The photos will make it's easier for employees to identify team members. Also, adding other elements can help establish the culture and values of the organization.
- Having the Editable File Ready at All Times: Organizations can change over time. That is why it's essential to keep the master file of your organizational chart ready. The chart also ensures that everyone on your team is flexible and can adapt to changes quickly. Creating an org chart from scratch every time something changes can be counterproductive.
Creating effective organization charts will be a breeze by making the most of these tips. After all, an organizational chart that's hard to comprehend will render it useless.
Introducing Wondershare EdrawMind: An Alternative & Powerful Org Charting Tool
Wondershare EdrawMind is a powerful mind-mapping tool with many charting features. It's designed to help you create beautiful yet functional charts for any purpose. One of these purposes may be to create organizational charts. You may find that PowerPoint applications are hard to navigate and use to make these charts. So, EdrawMind is here to ease up your work.

It hosts some key features, including:
- Pre-made Templates: EdrawMind offers a wide selection of beautifully designed templates. They allow you to kickstart your organizational chart effortlessly. Explore the MindMap Gallery to discover templates curated by other business owners.
- Drag-and-Drop Interface: EdrawMind's intuitive interface helps you enhance your organizational charts with media. Effortlessly customize and arrange elements with a simple drag-and-drop motion.
- Unlimited Canvas: EdrawMind provides a virtually limitless canvas for your organizational timeline. This space allows you to create detailed and comprehensive organizational charts.
- Zoom and Pan: Your business expands over time, making your organizational chart more extensive. Then, navigating and viewing the entire chart can become challenging. EdrawMind's Zoom and Pan feature lets you zoom in and out and pan across the canvas. This makes exploring and examining your complete organizational chart effortless.
- Import and Export Options: EdrawMind offers seamless import and export capabilities. You can import data and resources to enrich your timeline. You can also export your completed org charts to PowerPoint or other formats.
Here's a quick table to help you understand why EdrawMind is more suitable for org charts than PowerPoints:
| Wondershare EdrawMind | PowerPoint Applications |
|
|
1. How To Create Org Charts With EdrawMind
Creating organization charts is simple with EdrawMind. To start building your stunning charts, follow the steps below:
Step 1: Install and download EdrawMind from the official website.
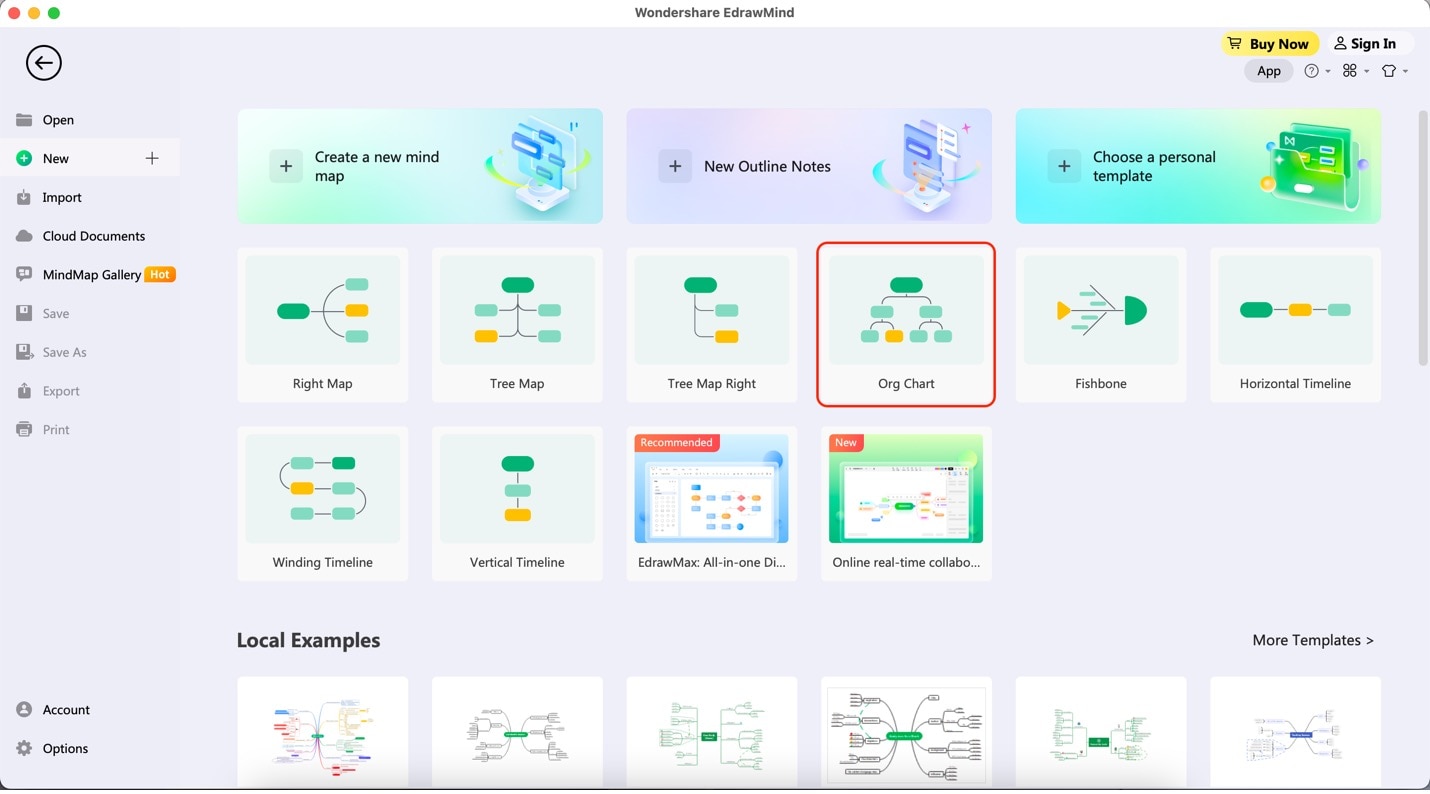
Step 2: Launch the application. On the app's homepage, click Org Chart.
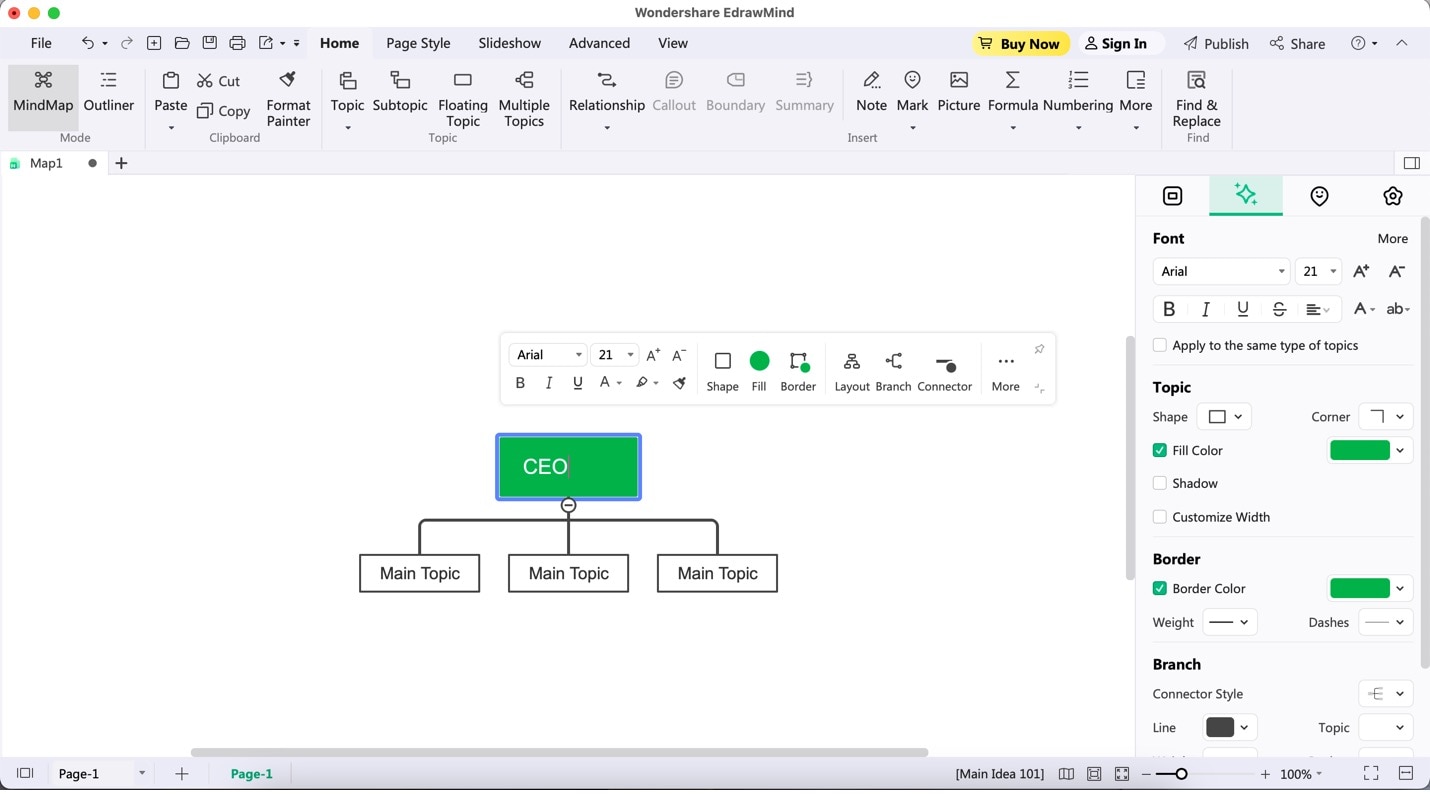
Step 3: Begin editing the text boxes of your chart by double-clicking on them until the text cursor appears and the original text is highlighted.
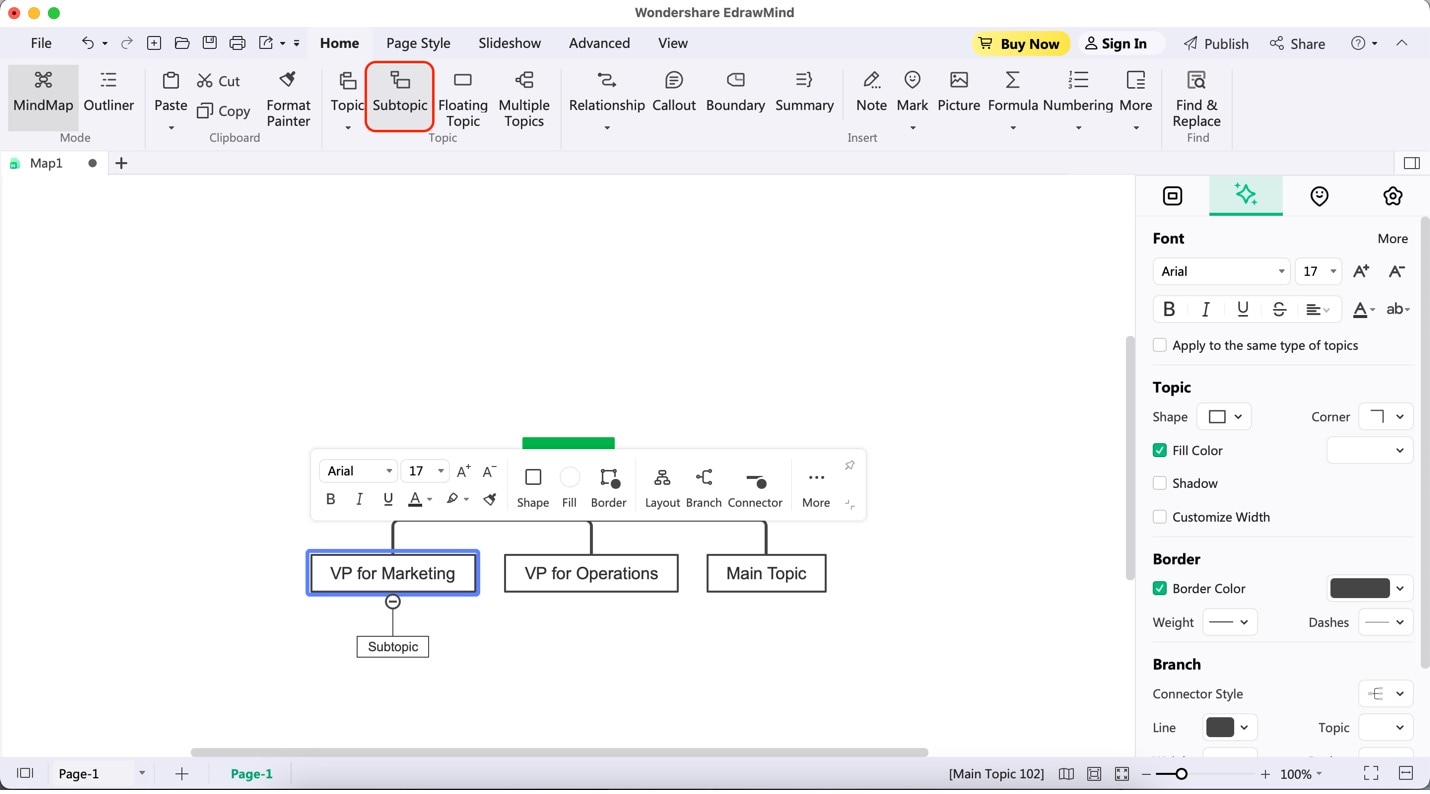
Step 4: Add more relationships to your chart by clicking on a box and then clicking Subtopic found on the upper toolbar.
2. Exporting EdrawMind Org Charts To PowerPoint
After creating your org chart, you may need to transfer them to Microsoft PowerPoint. Follow these two easy steps below to learn how to export them:
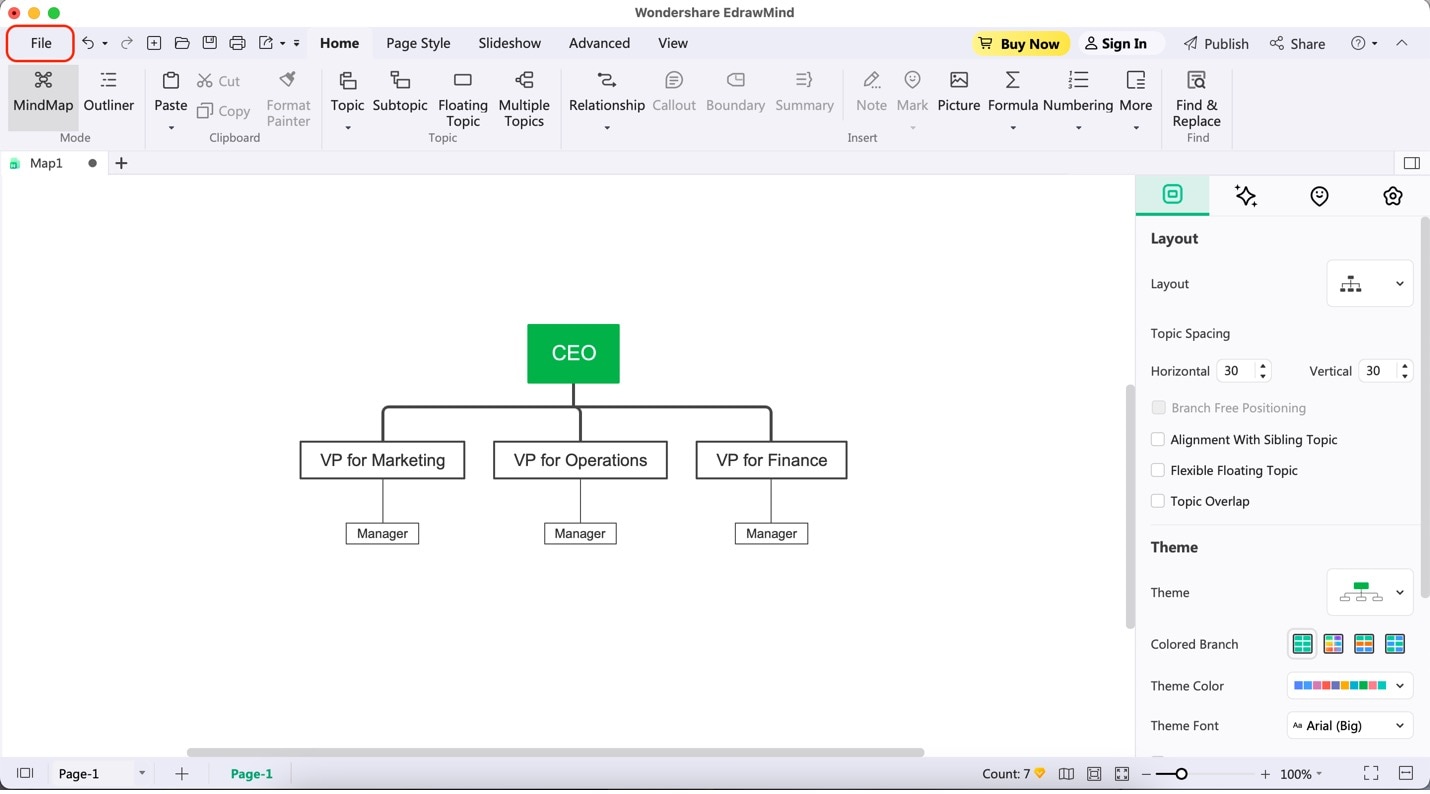
Step 1: When finished with your org chart, click File on the leftmost side of the upper toolbar.
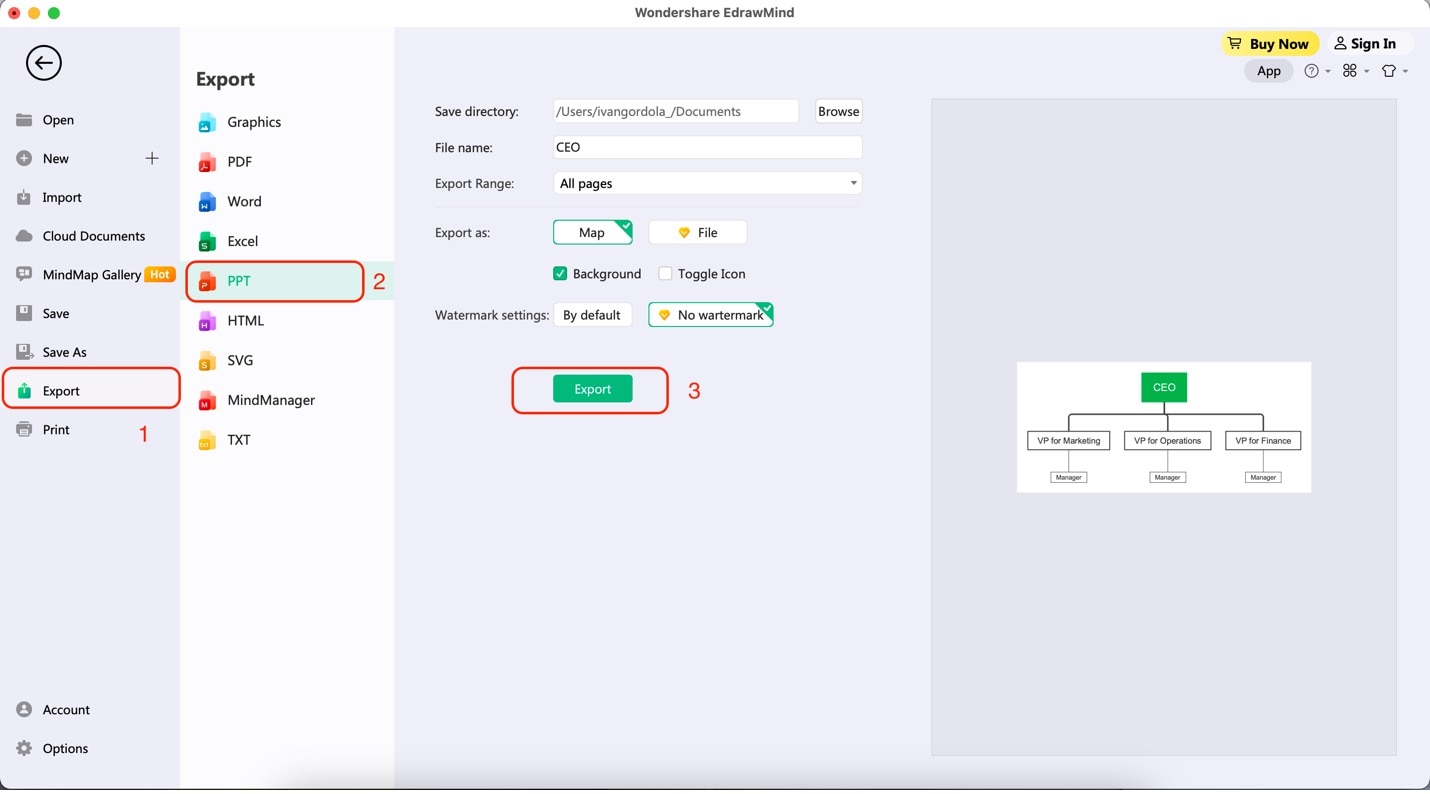
Step 2: On the appearing page, click Export. Then, click PPT. Edit the details of your export file and click the second Export button.
Conclusion
Organizational charts are incredible tools. They help visualize the inner workings of an organization. In turn, this empowers seamless communication and informed decision-making. This made PowerPoint a trusted companion for chart creation. However, an even more powerful and delightful alternative is EdrawMind.
EdrawMind offers an array of features and an intuitive interface. This results in a sophisticated yet user-friendly solution to craft organizational charts. This way, your org charts genuinely shine in functionality and aesthetics. Unleash the full potential of your organizational visualization with EdrawMind. Elevate your charting experience to new heights.


