The water cycle, also known as the hydrological cycle, is a captivating journey that encompasses the transformation of water through various phases—evaporation, condensation, precipitation, and more. This intricate dance between the atmosphere, oceans, land, and living organisms sustains life as we know it.
To enhance our understanding, we will navigate through a detailed water cycle concept map, a visual representation that distills the complexities of this natural phenomenon into a comprehensive and accessible format. This concept map serves as a guide, unraveling the interconnected pathways of water through the environment and providing a perspective on the dynamic processes that shape our planet's hydrologic balance.
In this article
The Concept of the Water Cycle and Its Dynamics
The water cycle, scientifically known as the hydrological cycle, is a continuous and dynamic process that describes the movement and transformation of water on Earth. It is a vital mechanism that ensures the planet's water is recycled and distributed across various reservoirs, maintaining a delicate balance essential for sustaining life.
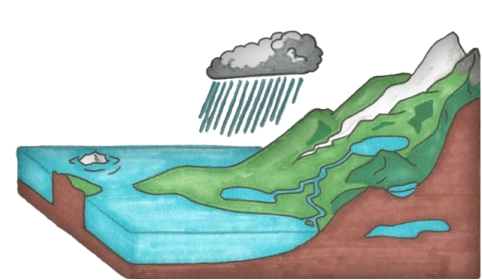
The cycle begins with evaporation, where heat from the sun causes water from oceans, lakes, and rivers to transition from liquid to vapor in the atmosphere. This vapor then undergoes condensation, forming clouds as it cools. The next phase is precipitation, wherein water droplets in clouds combine and fall to the Earth as rain, snow, sleet, or hail.
Upon reaching the Earth's surface, the water takes different paths. Some of it infiltrates the ground, becoming groundwater, while the rest flows over the land, forming rivers and eventually reaching oceans, thus completing the cycle. Along the way, plants absorb water through a process called transpiration, contributing to the overall complexity of the water cycle.
This continuous circulation of water, involving evaporation, condensation, precipitation, and collection, plays a crucial role in regulating Earth's climate, shaping landscapes, and supporting ecosystems. The water cycle is a testament to the interconnectedness of Earth's systems and the resilience of nature's intricate processes.
Guidelines for Creating Water Cycle Concept Map
Building on our understanding of the water cycle, let's delve into a powerful tool that aids in visualizing and comprehending this intricate process—the concept map. EdrawMind, a versatile and user-friendly mind-mapping tool, is an excellent platform for creating a comprehensive water cycle concept map.

?Related topics
Creating a Water Cycle Concept Map with EdrawMind:
Step 1:Start with a Central Idea
Begin by placing the central idea, "Water Cycle," at the center of your canvas. This is the focal point from which you'll branch out into key components.
Step 2:Identify Key Phases
Branch out from the central idea to highlight the key phases of the water cycle—evaporation, condensation, precipitation, and collection. Connect these elements to the central idea with clear lines to represent the flow of the cycle.
Step 3:Add Subtopics
Under each key phase, incorporate subtopics to elaborate on specific details. For example, under "Evaporation," include subtopics like "Heat from the Sun" and "Water Turns to Vapor."
Step 4:Incorporate Visual Elements
EdrawMind allows you to enhance your concept map with visuals. Integrate icons or images to represent each phase and visually engage the map.
Step 5:Connect Processes
Use connecting lines to illustrate the sequence of processes. For instance, connect "Evaporation" to "Condensation" to visually demonstrate the flow from one phase to the next.
Step 6:Include Annotations
Add brief annotations or descriptions to provide additional context for each element. This helps in understanding the significance of each phase within the water cycle concept map.
Step 7:Utilize Colors and Formatting
EdrawMind offers customization options such as color-coding and formatting. Use colors to distinguish between different phases, making your concept map visually appealing.
Step 8:Review and Refine
Periodically review your concept map to ensure clarity and coherence. EdrawMind allows for easy adjustments, enabling you to refine your map as needed.
Template for Water Cycle Concept Map
EdrawMind offers an extensive gallery of pre-designed templates that can significantly expedite the creation of a visually appealing and informative water cycle concept map. These templates cater to various learning levels, making them suitable for students, educators, or anyone seeking a comprehensive understanding of the water cycle concept map.
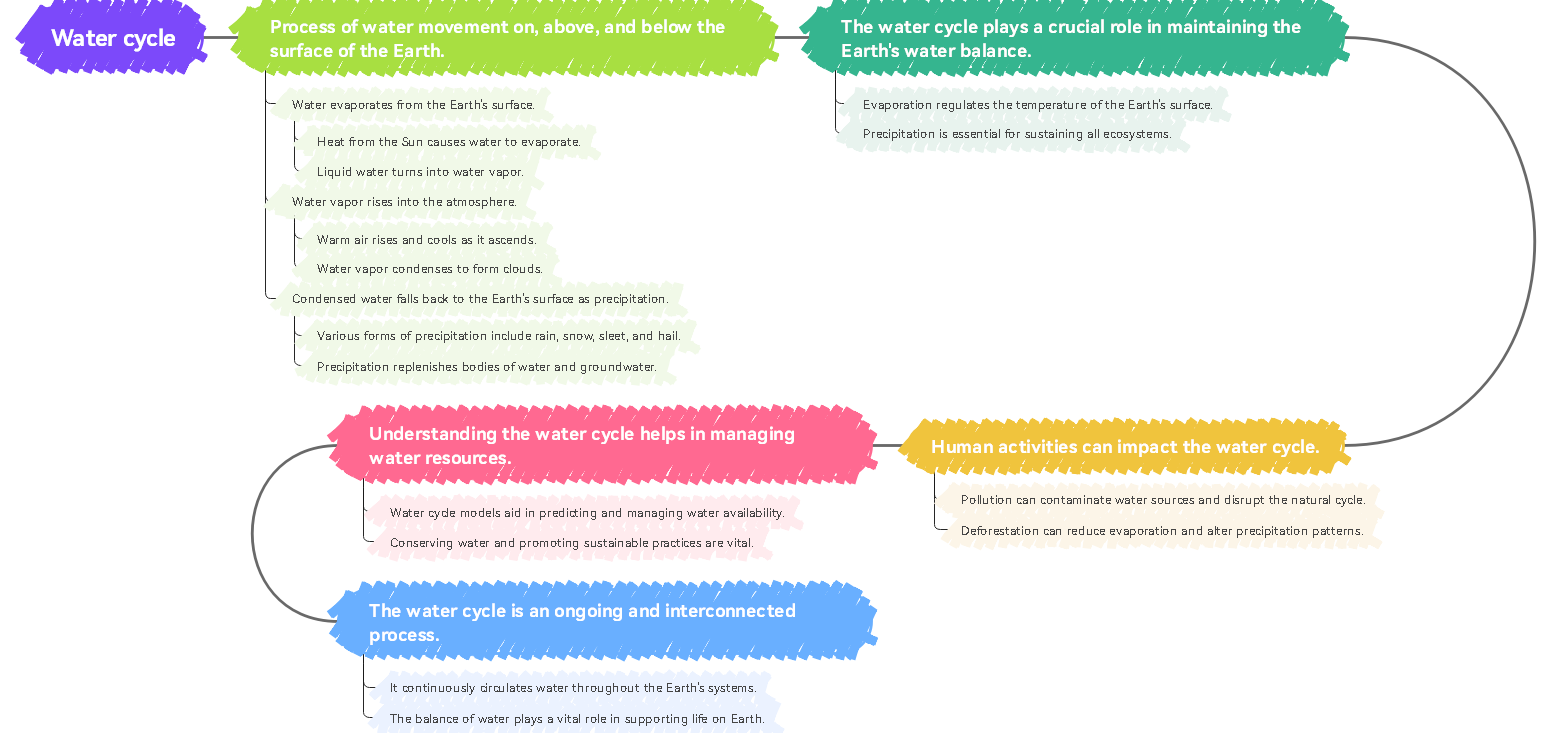
1. Winding Timeline Template
 below.
  below.
 The Winding Timeline Template for the Water Cycle Concept Map in EdrawMind's gallery offers a concise and visually engaging representation of the water cycle's intricate processes. The timeline unfolds the continuous movement of water on, above, and below Earth's surface in a winding fashion. Starting with the evaporation phase, the timeline navigates through key stages.
It involves atmospheric ascent, condensation forming clouds, and precipitation in various forms.
The interconnected phases emphasize the cyclical nature of water movement. Beyond the basic cycle, the template delves into the significance of the water cycle in regulating Earth's temperature and sustaining ecosystems while also addressing human impacts and the importance of water resource management.
2. Left Tree Map Template
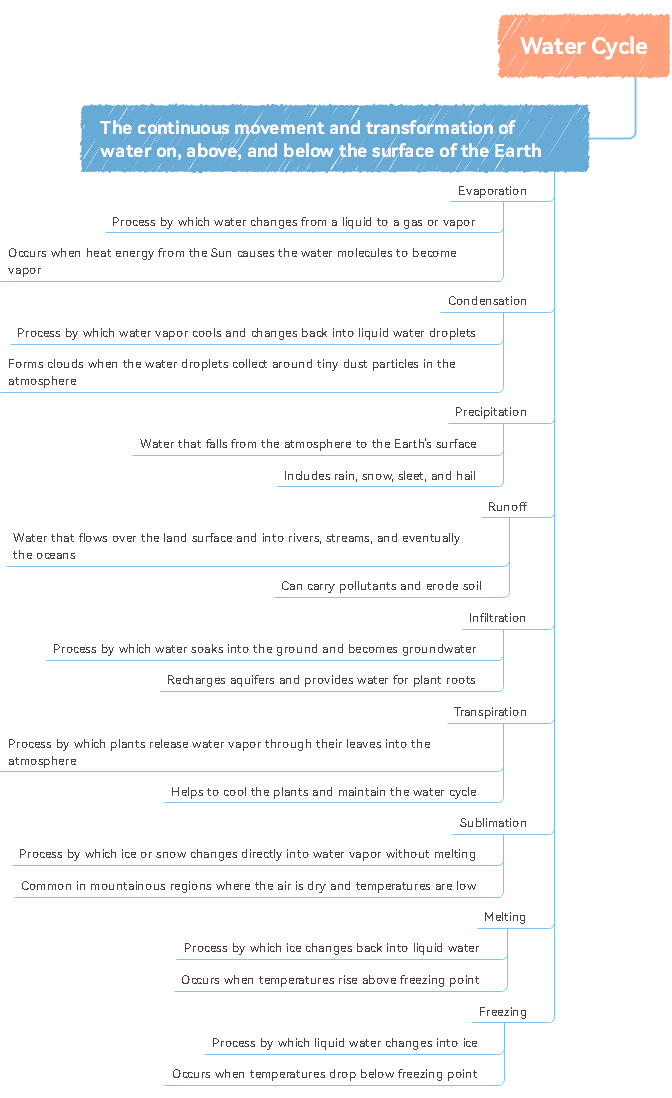
The Left Tree Template for the Water Cycle Concept Map in EdrawMind's collection provides a structured visualization of water's continuous movement and transformation across Earth's various realms. The map branches into essential phases such as condensation, precipitation, runoff, infiltration, transpiration, sublimation, melting, and freezing.
Each subtopic unveils specific details, from the formation of clouds during condensation to the diverse forms of precipitation like rain and snow. The Left Tree Map illustrates the interconnectivity of these processes, showcasing the flow of water over land and its absorption into the ground. Furthermore, it highlights the ecological role of transpiration in cooling plants.
3. Bubble Map Template
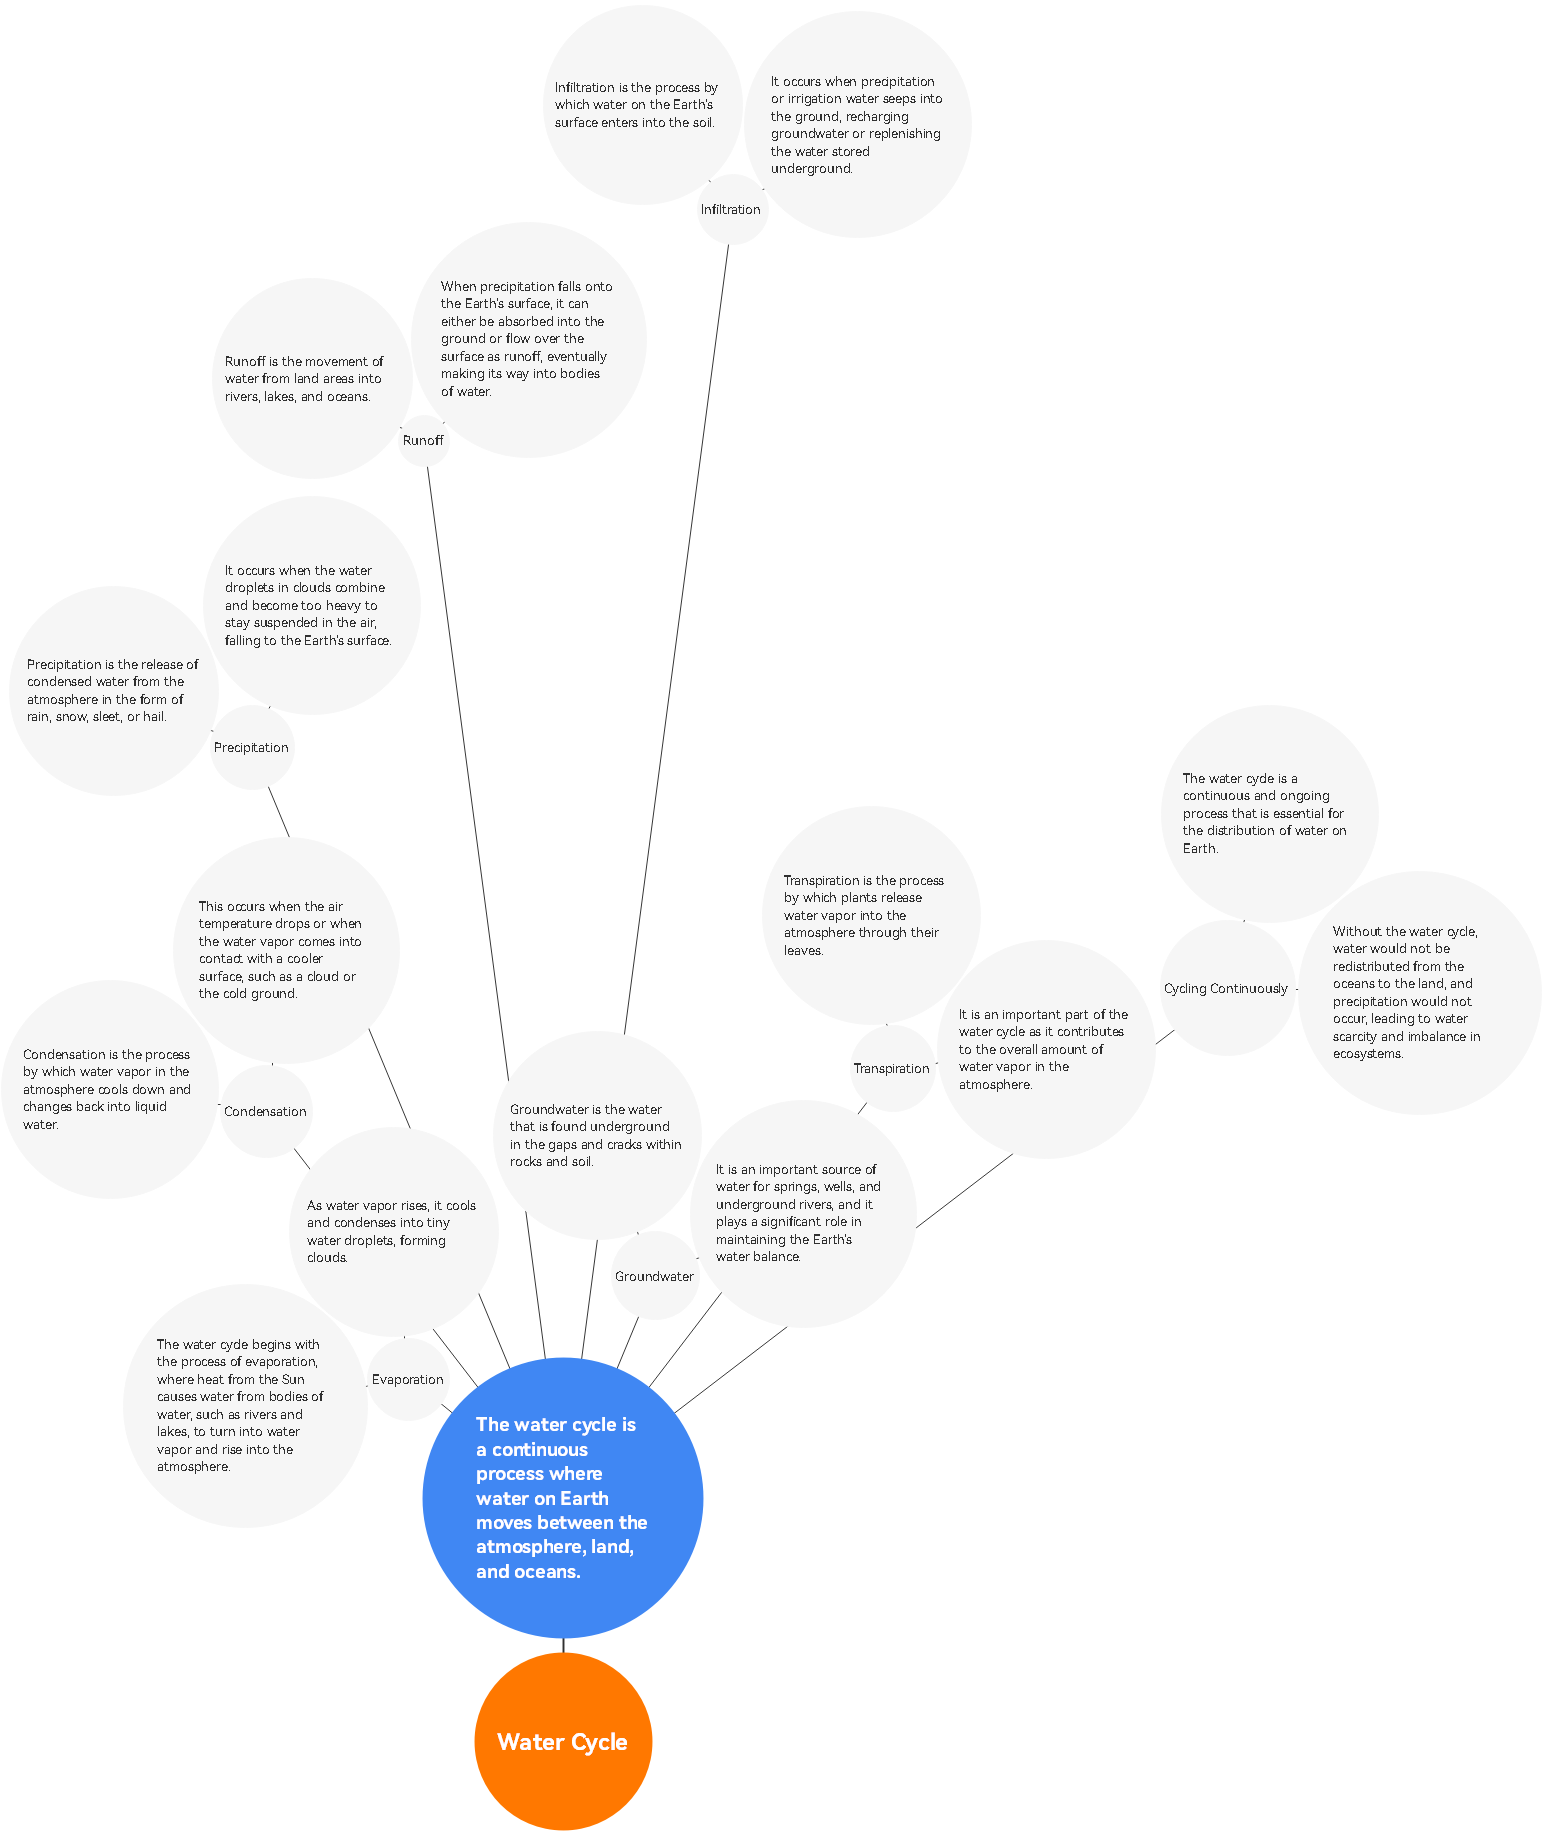
The Bubble Map template for the Water Cycle Concept Map in EdrawMind encapsulates the intricate journey of water as it cycles through the atmosphere, land, and oceans in a continuous and essential process. Starting with evaporation, where heat from the sun transforms water into vapor, each phase is encapsulated within distinct bubbles.
Condensation follows as vapor cools and forms clouds, leading to precipitation and the release of condensed water in various forms. The map extends to illustrate runoff, the movement of water over land, and infiltration, the process of water entering the soil. The map concludes with transpiration, the release of water vapor by plants, emphasizing the significance of this process.
?️♀️Discover the endless possibilities with our Concept Map Templates! Crafted for clarity and fostering creative thinking, these templates are perfect for everything from project planning to study notes. ?Download for free and elevate your mind maps with creativity!
Conclusion
The water cycle is a captivating and vital process that sustains life on Earth, orchestrating the movement of water across our planet's diverse landscapes. To comprehend this intricate phenomenon and effectively communicate its complexities, EdrawMind emerges as an invaluable ally.
With its user-friendly interface and an array of meticulously designed templates like the Winding Timeline and Bubble Map, EdrawMind enables users to craft visually engaging water cycle concept maps effortlessly. These templates not only break down the sequential phases of evaporation, condensation, precipitation, and more but also explore the broader environmental impacts and human influences on this essential cycle.