


In the fascinating realm of Earth science, the concept of subsystems serves as a key framework for understanding the intricate interactions that shape our planet's dynamic processes. This exploration delves into Earth Subsystem Concept Maps, offering a comprehensive overview that unveils the interconnected web of geological, atmospheric, hydrological, and biospheric components.
Embarking on this intellectual voyage, we navigate through the layers of Earth's subsystems, unraveling the complexities that define our planet's environmental equilibrium. From the rhythmic dance of climate patterns to the geological forces shaping the landscape, each concept map acts as a visual guide, fostering a holistic understanding of Earth's subsystems.
In this article
Grasping the Earth Subsystem Concept Map
An Earth subsystem concept map visually illustrates the interconnected components and relationships within specific Earth systems. Earth systems encompass various natural processes and phenomena that interact with each other to maintain the planet's dynamic equilibrium. The concept map serves as a tool to organize and communicate the complex relationships and feedback loops among these subsystems.
In essence, the map highlights how different components of the Earth, such as air, water, land, and living organisms, interact and influence one another. It provides a holistic view of the Earth's intricate web of systems, emphasizing the interconnectedness that characterizes our planet. Through visual representation, the concept map aids in understanding the information within and between Earth subsystems.
By employing symbols, labels, and connecting lines, an Earth subsystem concept map offers a comprehensive overview of the Earth's processes and enables scientists, educators, and learners to grasp the intricate relationships that govern our planet's functioning. These maps play a crucial role in Earth system science education, research, and communication, fostering a deeper comprehension of the planet's complexity.
Introducing EdrawMind
EdrawMind is a versatile and user-friendly mind-mapping tool that allows individuals to visually organize and represent their ideas, concepts, and relationships. As a dynamic platform, it enables users to create concept maps effortlessly, making it an excellent resource for educational purposes, scientific communication, and a comprehensive understanding of complex systems such as Earth subsystems.
Explaining Earth Subsystem with Concept Map
When created using tools like EdrawMind, an Earth subsystem concept map is a powerful visual aid to comprehend the intricate relationships within our planet's various systems. Let's delve into the key components and how they interact:
 below.
  below.
 - Atmosphere
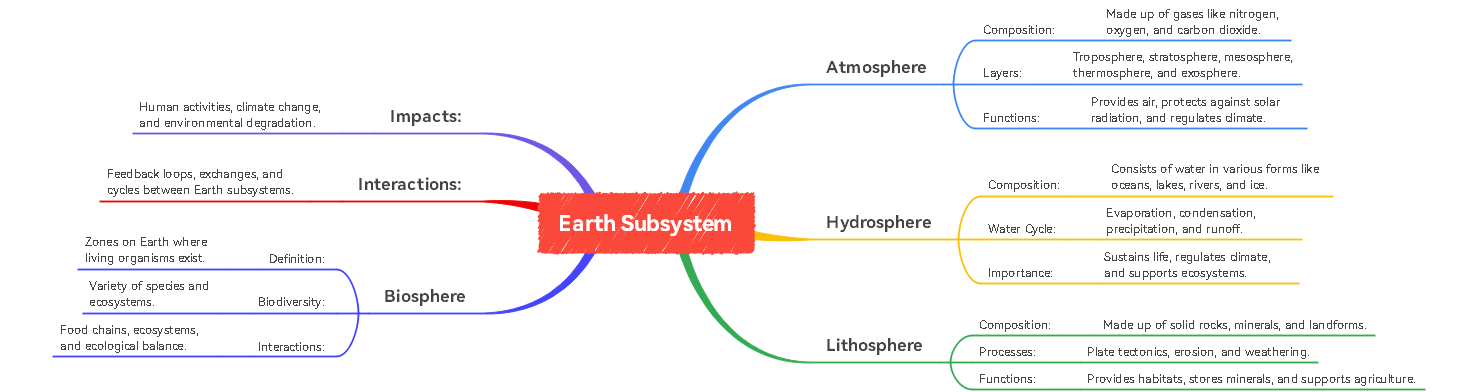
The map can start by depicting the Atmosphere as a central element. Branches can extend to represent components like gases, weather patterns, and climate zones.
- Hydrosphere
Extending from the Atmosphere, connecting lines can signify the crucial relationship between the Atmosphere and the hydrosphere. This section may encompass oceans, rivers, and the water cycle.
- Lithosphere
A branch extending from the central concept can portray the lithosphere, incorporating landforms, geological processes, and the Earth's crust.
- Biosphere
Another vital extension can highlight the biosphere, showcasing the interconnected web of life, ecosystems, and biodiversity.
- Interconnections
The concept map can use arrows and symbols to emphasize the interconnections between these subsystems. For instance, the influence of the Atmosphere on climate patterns or the impact of human activities on the biosphere.
- Human Impact
An additional layer can portray the human impact on Earth's subsystems, depicting deforestation, pollution, and resource exploitation.
By leveraging EdrawMind's features, such as customizable templates, color-coded branches, and collaborative functionalities, users can create dynamic and informative Earth subsystem concept maps.
Creating an Earth Subsystem Concept Map with EdrawMind
EdrawMind simplifies creating an Earth subsystem concept map by offering a range of templates catering to different visualizations. Let's explore how the Bubble Map and Right Fishbone templates can effectively represent the interconnected components of Earth subsystems.
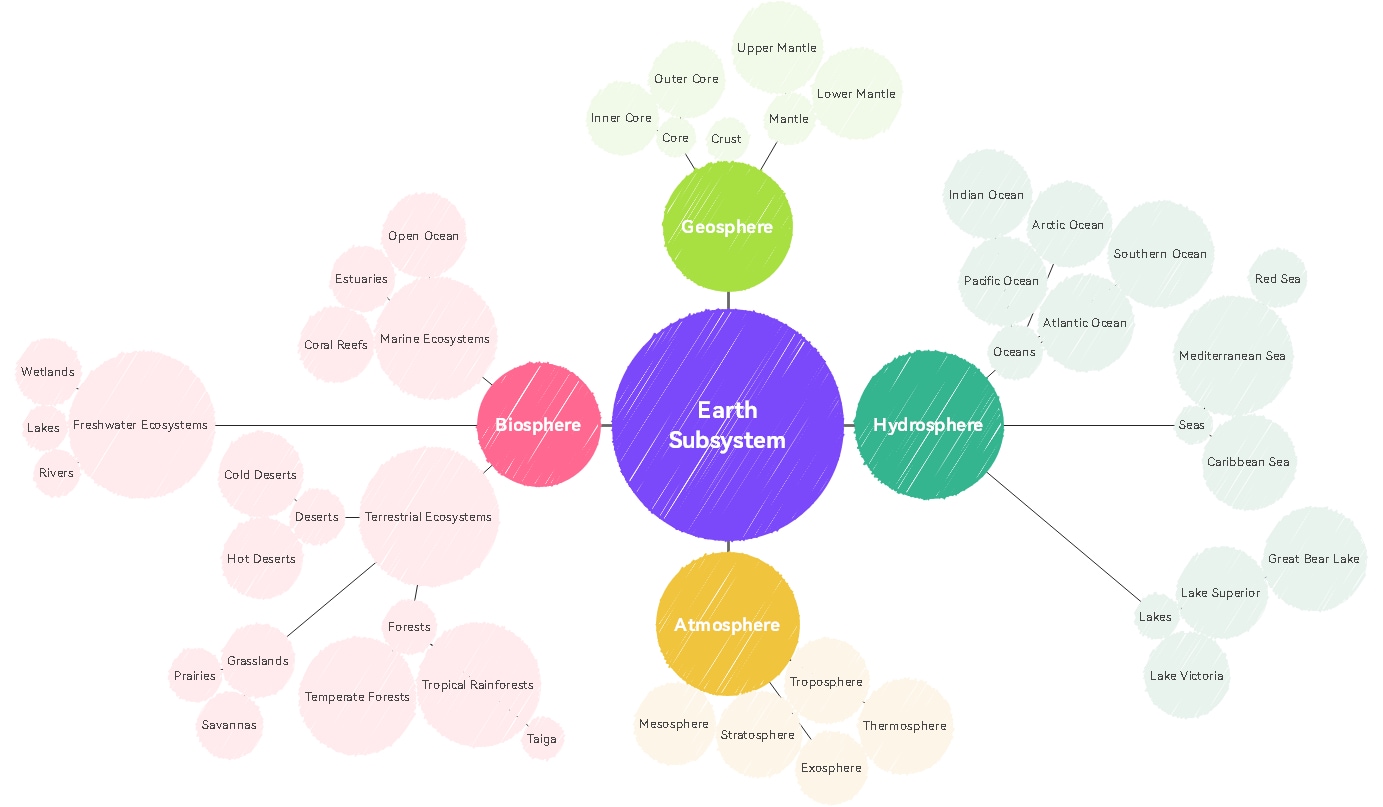
1. Bubble Map Template
Introduction
Start by selecting the Bubble Map template within EdrawMind. This template is ideal for breaking down complex topics into distinct components.
Main Concept Bubble
Begin with a central bubble representing Earth subsystems. Label it appropriately to convey the overarching theme.
Subsystem Bubbles
Create individual bubbles from the central concept to represent key subsystems like Atmosphere, Hydrosphere, Lithosphere, and Biosphere.
Connecting Lines
Use connecting lines to establish relationships between these subsystems. For example, lines connecting the Atmosphere and Hydrosphere can signify the water cycle.
Subcategories
Further, extends bubbles from each subsystem to represent subcategories. Under Atmosphere, include branches for gases, weather patterns, and climate zones.
Icons and Colors
Enhance visual clarity by incorporating icons or colors for each subsystem. This aids in distinguishing components and fostering a more engaging map.
☘️Explore creative Concept Map Templates with EdrawMind! Learn to craft stunning visuals effortlessly, whether you're a beginner or pro. Click now for seamless concept mapping!
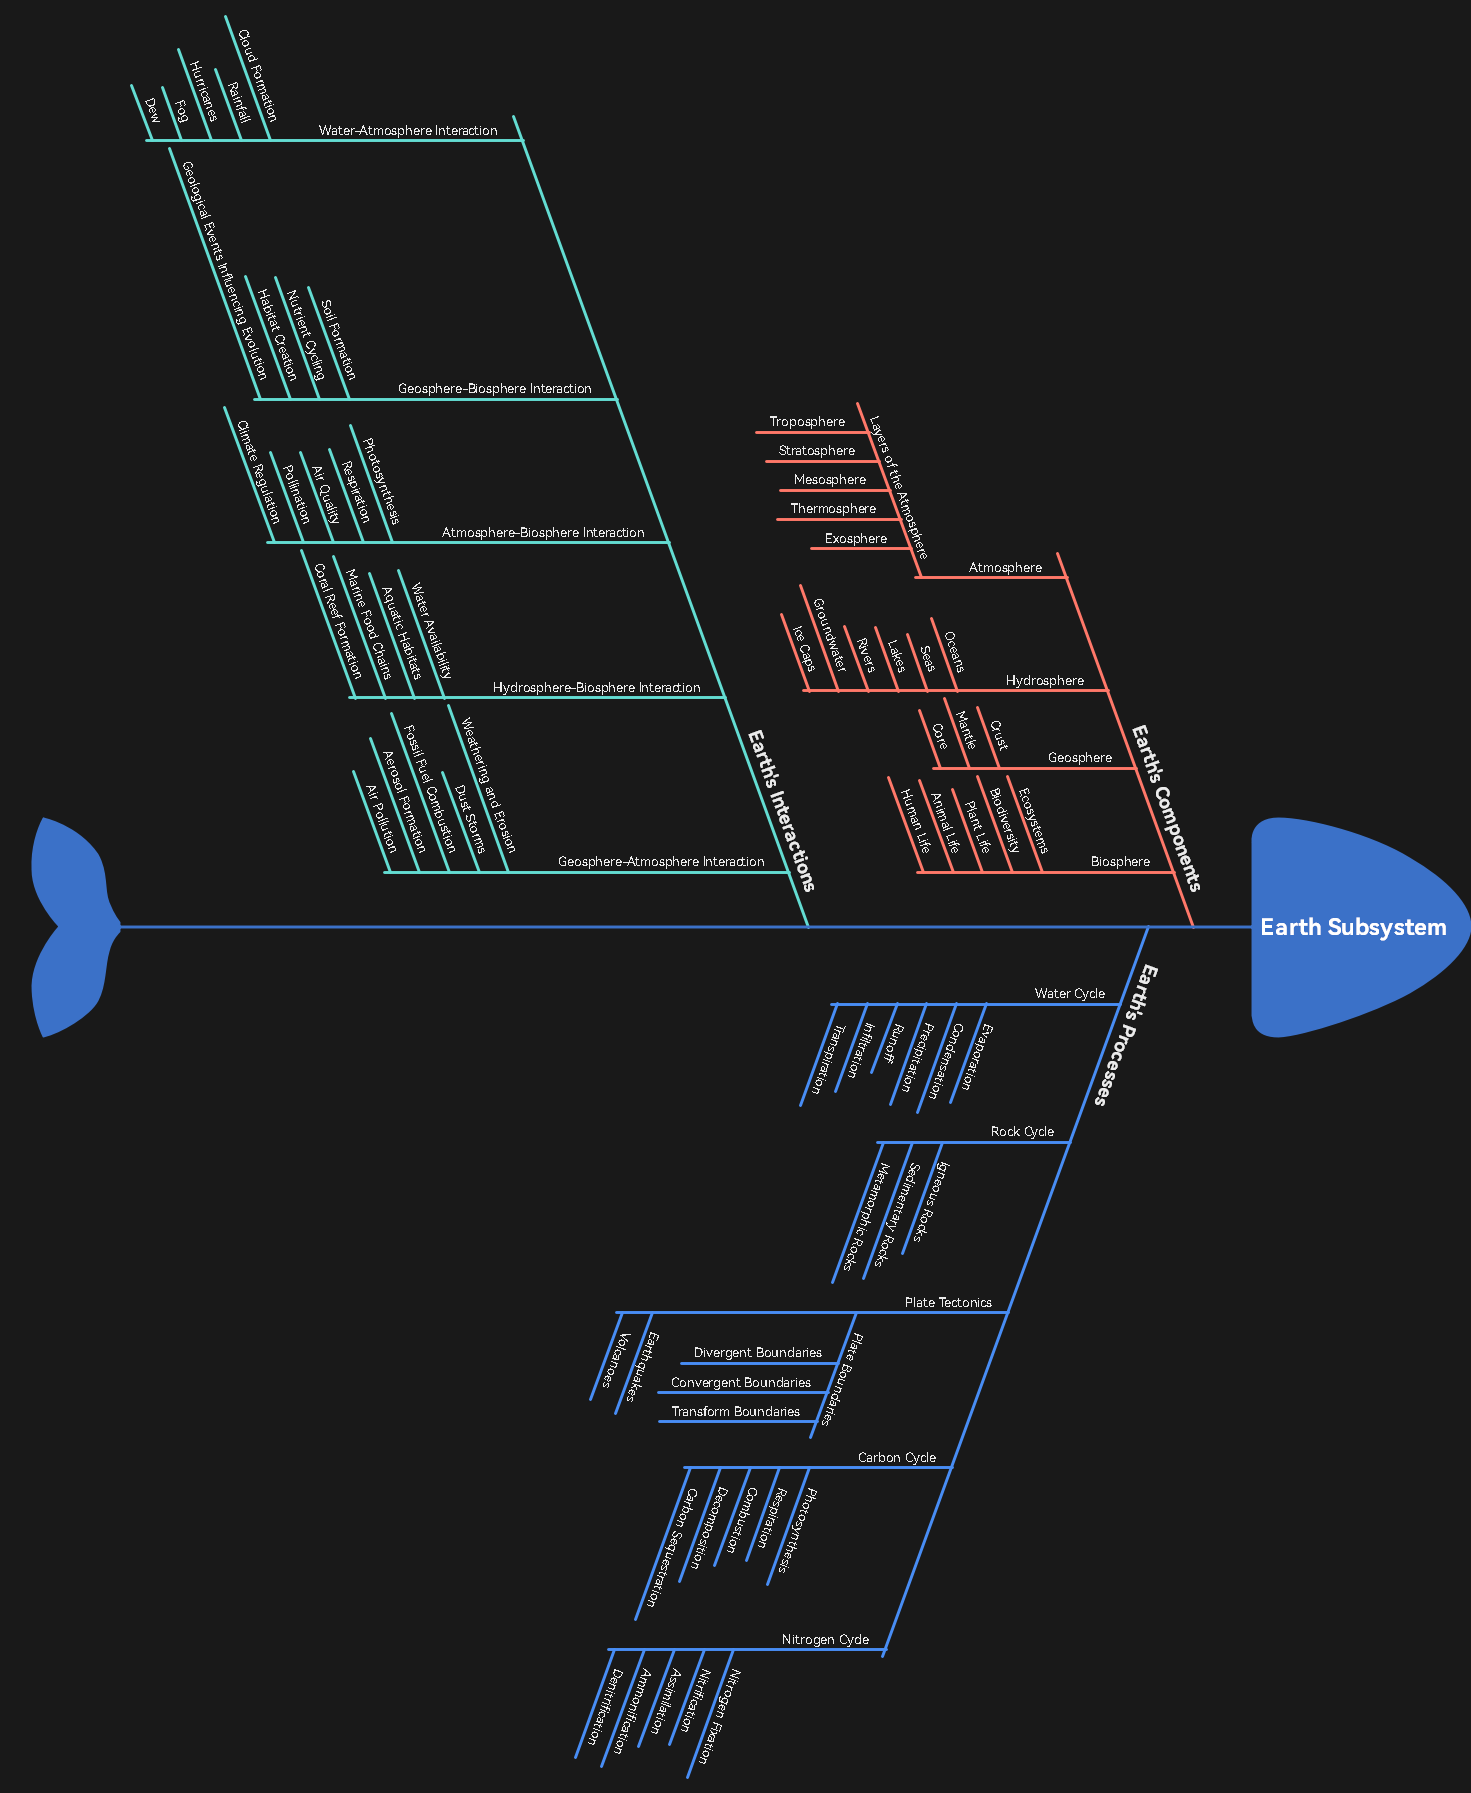
2. Right Fishbone Template
Introduction
Alternatively, opt for the Right Fishbone template. This template effectively showcases cause-and-effect relationships, making it suitable for illustrating Earth subsystem dynamics.
Main Bone
Begin with the main bone representing Earth subsystems. Label it prominently.
Secondary Bones
Extend secondary bones from the main bone to represent the major subsystems like Atmosphere, Hydrosphere, Lithosphere, and Biosphere.
Cause-and-Effect Branches
Utilize branches extending from each secondary bone to depict cause-and-effect relationships. For instance, bone showcases branches from the Atmosphere for weather patterns and climate zones.
Earth Processes Branch
Create a specific branch to highlight the Earth subsystems with its processes. This could include branches for the water cycle, rock cycle, plate tectonics, carbon cycle, and nitrogen cycle.
Icons and Labels
Incorporate icons or labels along the branches to provide additional information and context.
EdrawMind's templates empower users to customize their Earth subsystem concept maps efficiently. Whether opting for the Bubble Map for a straightforward representation or the Right Fishbone for a cause-and-effect visualization, the platform's intuitive interface and design options facilitate the creation of visually compelling and informative concept maps.
Conclusion
The Earth subsystem concept map is a visual representation that elucidates the interconnected components and relationships within Earth systems, highlighting the interdependence of the Atmosphere, hydrosphere, lithosphere, and biosphere. This concept becomes more accessible through tools like EdrawMind, which offers different templates. These templates provide a dynamic canvas for users to illustrate and comprehend the intricate dynamics of Earth's subsystems.
By choosing EdrawMind, individuals gain a powerful tool to visually communicate and understand the complexities of our planet's systems. As we reflect on the significance of EdrawMind in enhancing education, research, and communication, it becomes clear that this tool has contributed to a deeper comprehension of Earth's subsystems, fostering clarity and creativity in exploring our planet's interconnected components.
