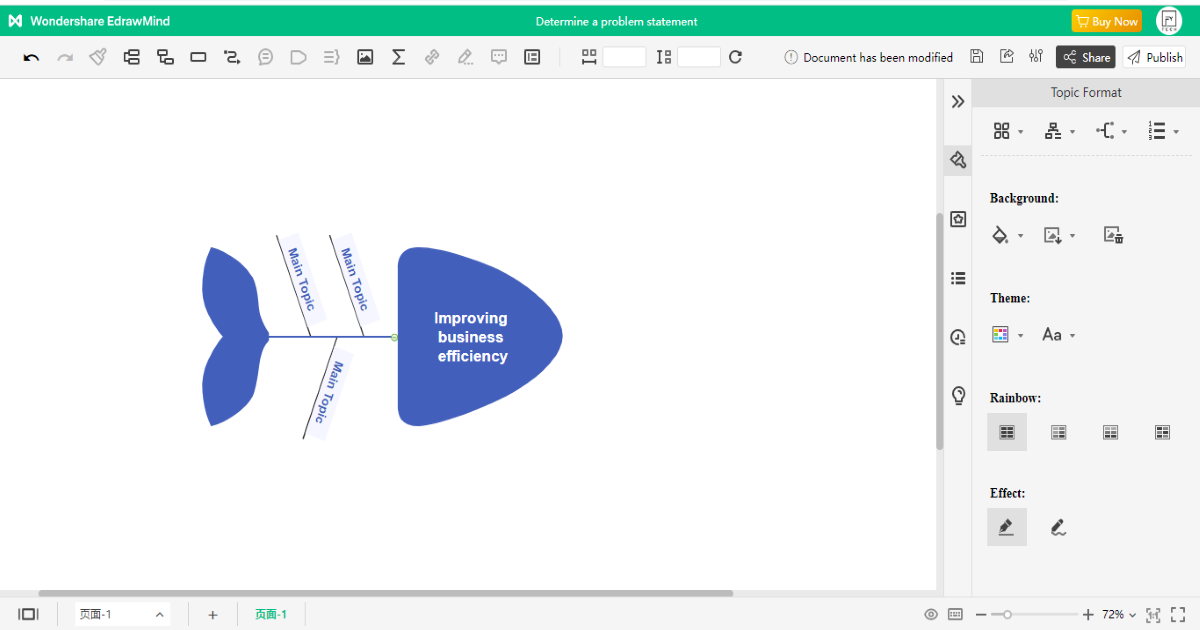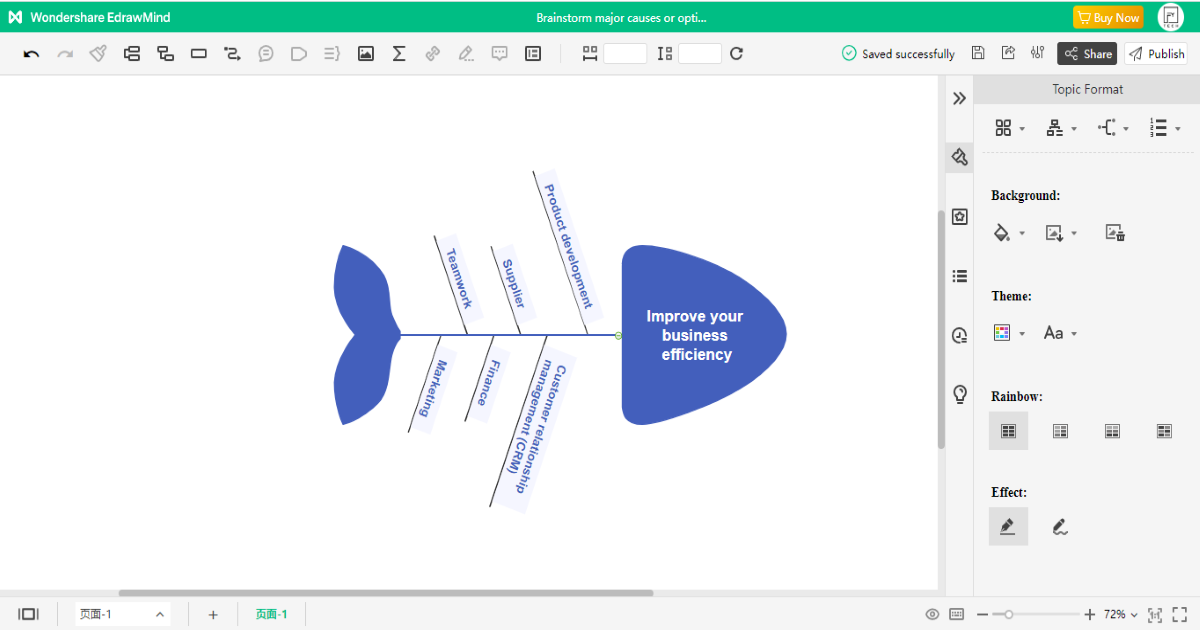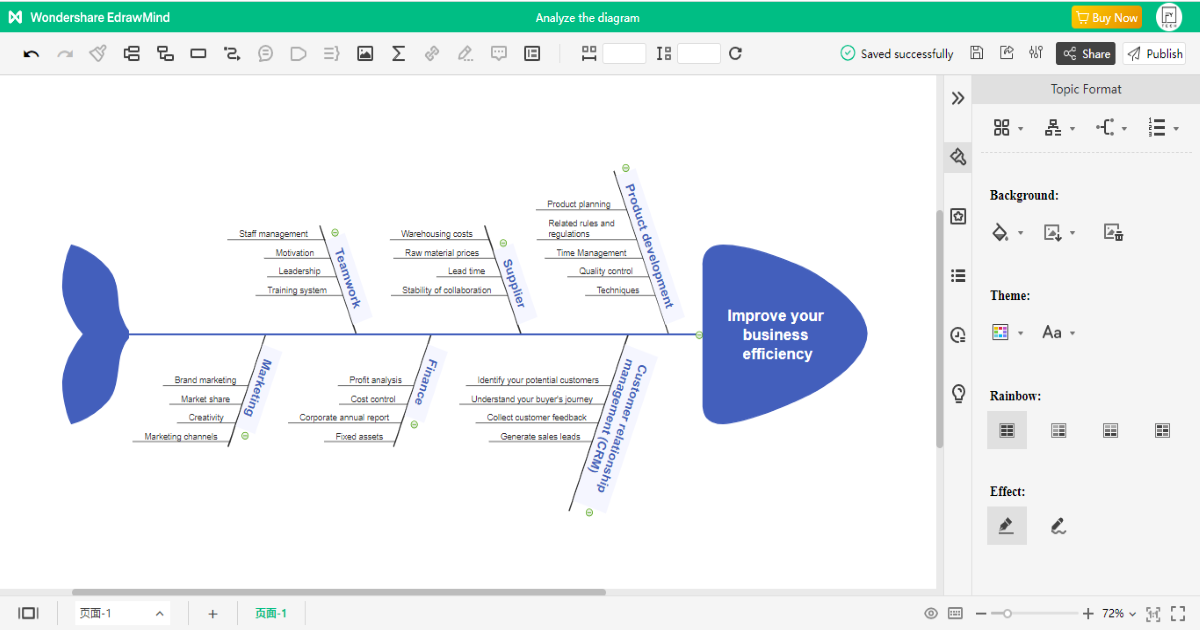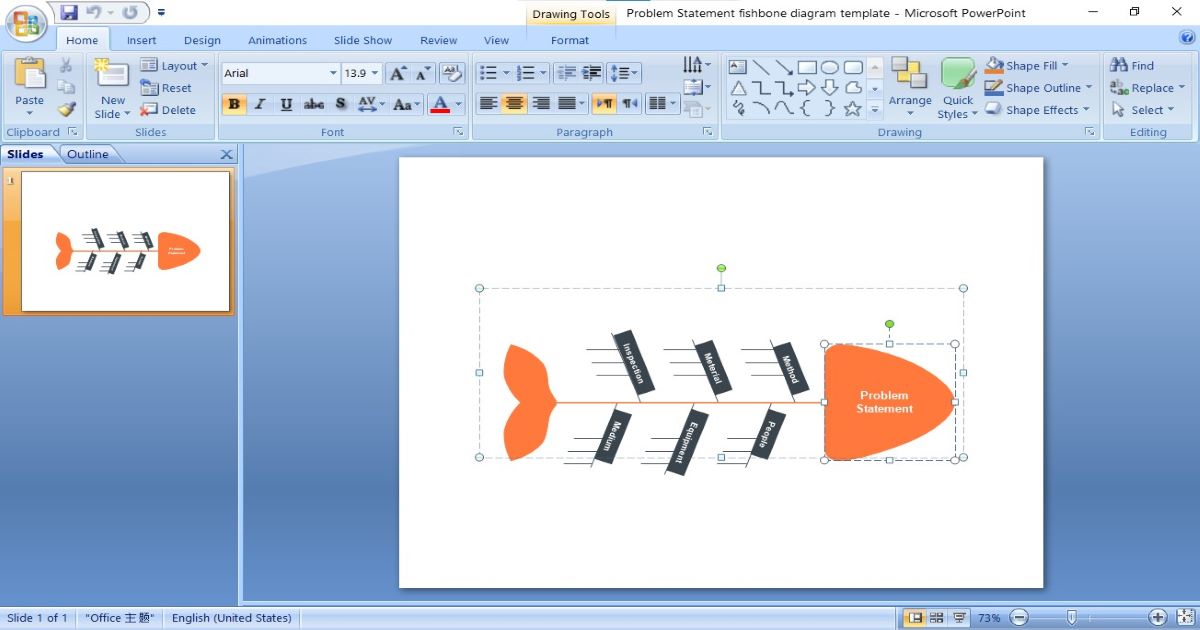
About the Fishbone Diagram Template
A fishbone diagram—also called an Ishikawa diagram or cause-and-effect diagram—organizes possible causes of a clearly defined problem into categories. It is especially useful for structured brainstorming when several people or process factors may contribute to the same effect.
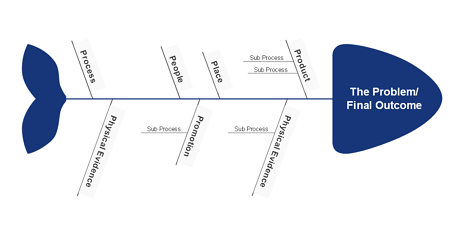
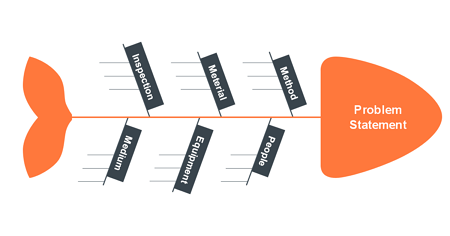
Use this editable Fishbone Diagram Template to place the problem at the fish head, group potential causes on the major bones, and add more specific sub-causes as the analysis develops. The diagram helps a team see where to investigate next, but the branches represent hypotheses to verify; a fishbone diagram by itself does not prove that a listed factor is the root cause.
For manufacturing, teams often start with the 6M categories—people/manpower, machine, method, material, measurement, and environment/Mother Nature. Service, healthcare, marketing, and project teams can rename the categories to match their process instead of forcing every problem into the 6M structure.
Source note: The American Society for Quality describes fishbone diagrams as a quality tool for sorting many possible causes into useful categories and recommends continuing the analysis to determine which causes should be addressed ASQ.
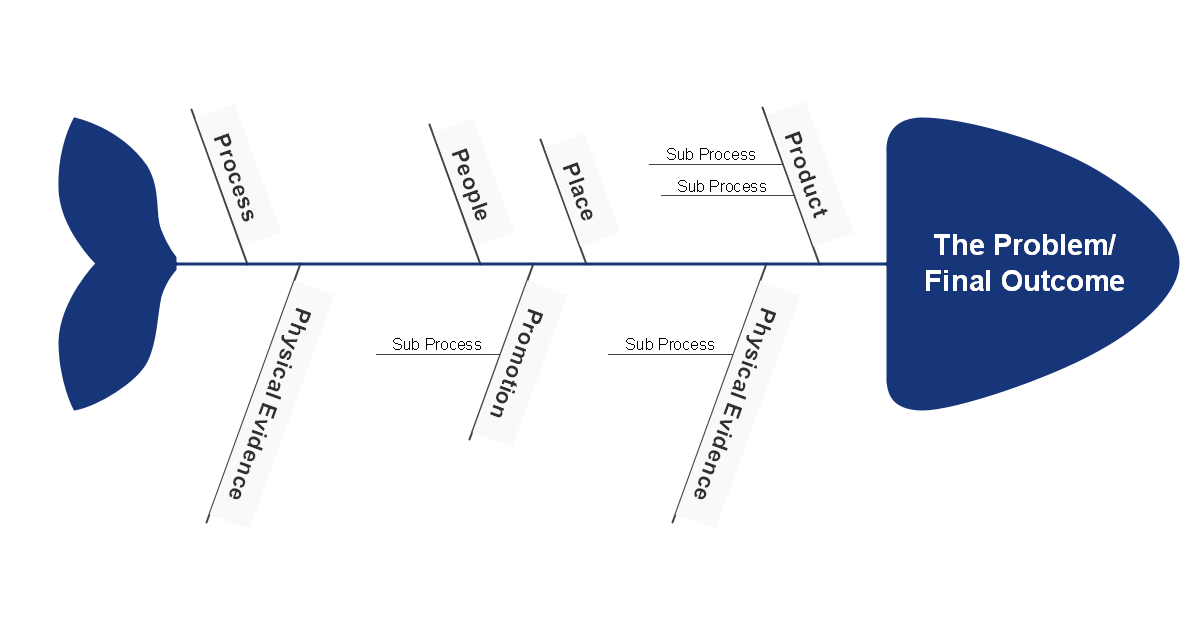
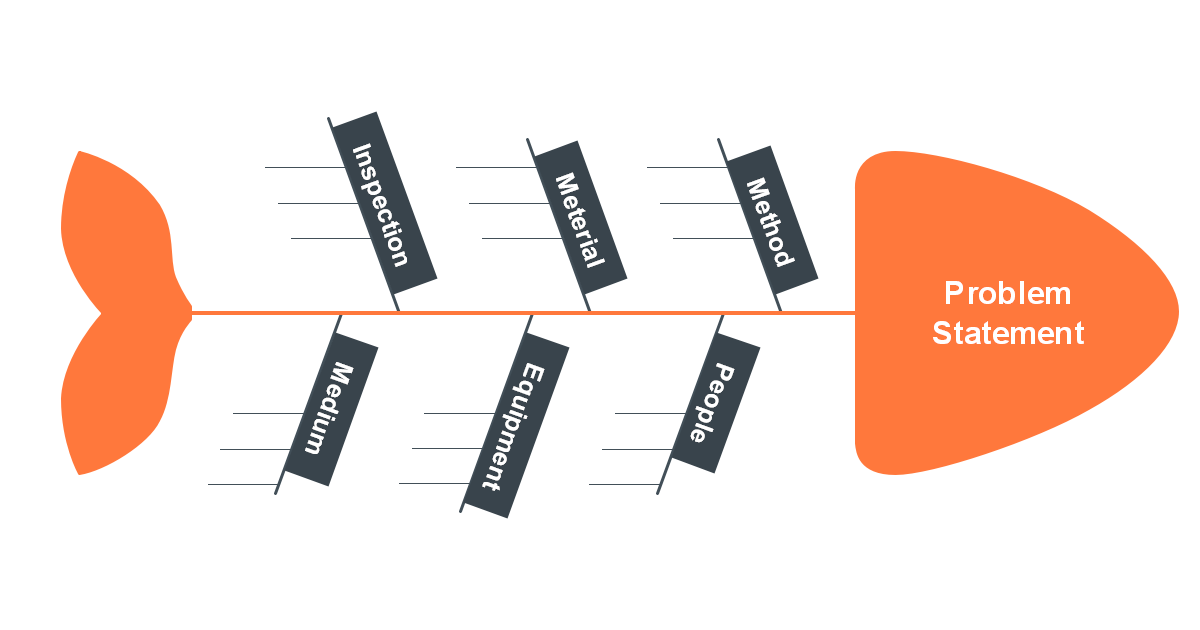
Using a fishbone diagram as a starting point for the root cause analysis is a simple method to get started. Visual components can be used to represent the problem, the categories of reasons that contributed to it, and the causes that contributed to those causes. The arrows in the diagram demonstrate the causal connection between the various parts and how they relate to the problematic occurrence. Fishbone diagrams are adaptable problem-solving tools that can be applied in any field or setting.
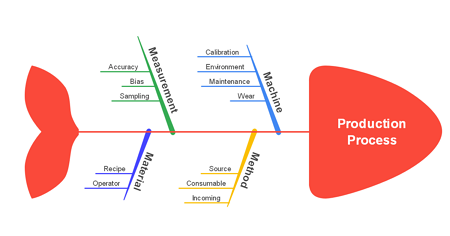
3. Production Process Fishbone Diagram Template
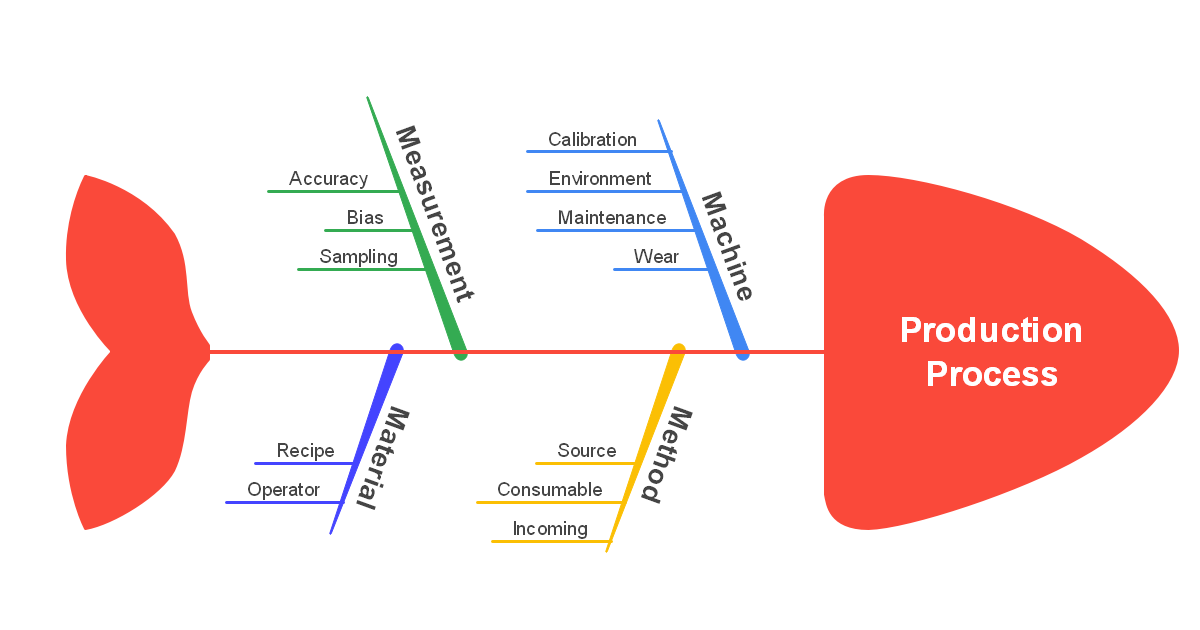
This template represents an assembly line production process as consisting of many kinds of functions and steps. On the diagram, every component has been placed where it should be according to the instructions.