


Starting a research project can feel like a puzzle. There are many pieces, and figuring out how they all fit together can be tricky. One tool that can help is a research timeline. It enables you to map out when and what you need to do. This way, you will have a guide that lets you know what steps to take next.
This article will show you six different research timeline templates made with EdrawMind. Each is designed for various uses, so you'll know where to begin your research. Whether you're a new or seasoned researcher, these templates can help organize your research process.
In this Article
Research Timeline Templates
This section will explore different research timeline templates you can easily create or copy. Check out which suits you best and apply them to your research projects. These templates are all made with EdrawMind.
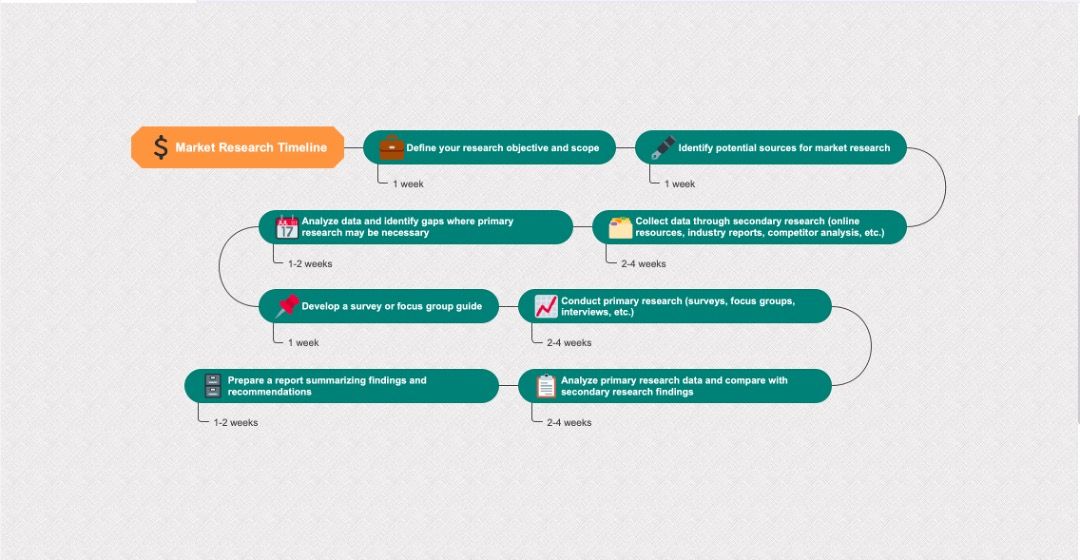
1. Market Research Timeline
A market research timeline is particularly for businesses that want to study their market before releasing a product. This winding timeline involves defining the target market, the source of respondents, the data-gathering method, and other essential parts of market research. It's also great to include the time needed for each part to have a set of tasks you should accomplish in a specific time.
2. Research Content Timeline
A research content timeline focuses on the details of your research. In the form of a vertical timeline, it is more like mind map. It does not provide the required time for each part, but you can easily add them if you want to use this template.
Using this timeline, you can plan out the contents of each section for easy reference during writing. Make sure to add questions or notes you'd like to emphasize in your project.
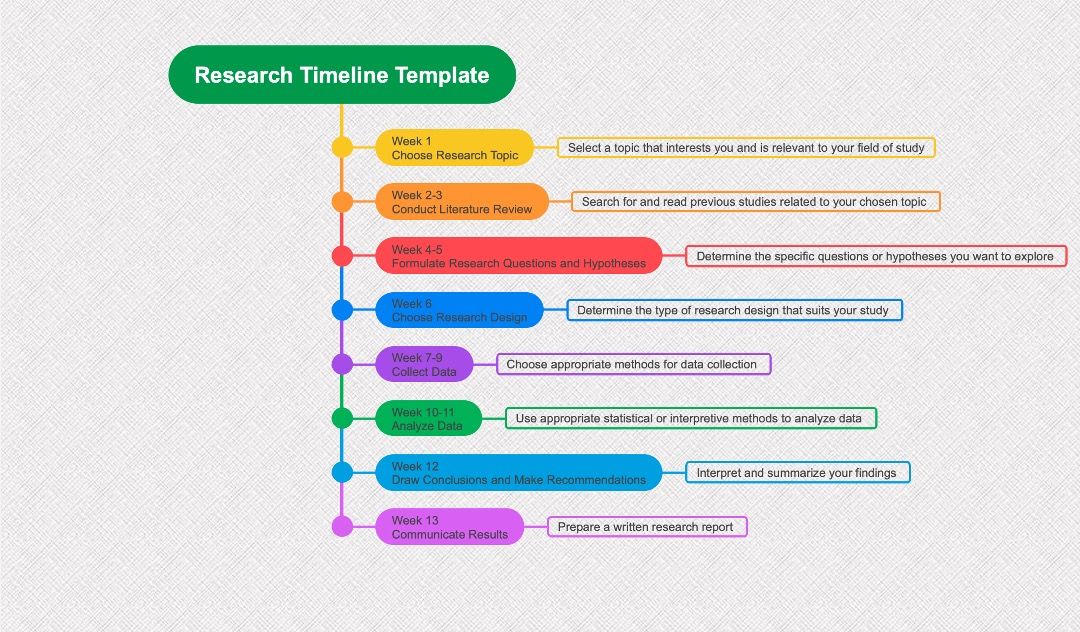
3. Research Project Timeline
A Research Project Timeline is like a schedule or a planner for your research work. It breaks down the research process into smaller parts and assigns a specific time to complete each.
Think of it as a roadmap of your research journey, with signposts marking where you should be at a particular time. It helps you stay on track and stay focused and focused. It also makes it clear what tasks need to be done and when. The feature is especially helpful when you're working with a team. Everyone can see what they should be doing and when it should be finished.
So, whether you're working alone or with a group, a Research Project Timeline is a handy tool to keep your research work organized and on schedule.
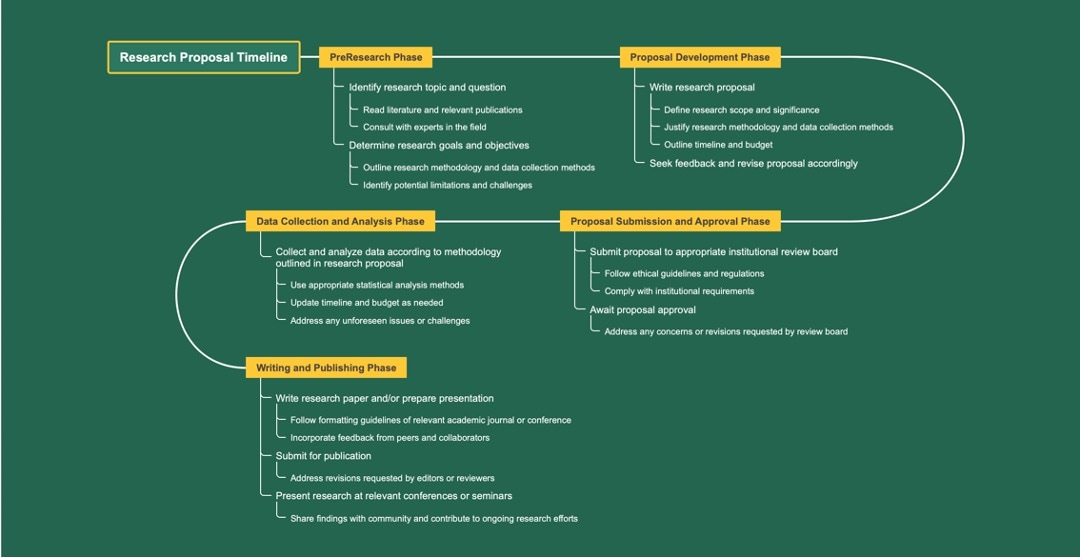
4. Research Proposal Timeline
A research proposal timeline is mainly designed for the proposal stage and the projected outcomes of a research project. While most research timelines involve the contents or the timeframe for each part of the project, a proposal timeline focuses on the general tasks needed to start a research.
This template is perfect for brainstorming new research projects. You can add more details as necessary, but a general look at the timeline can be found below.
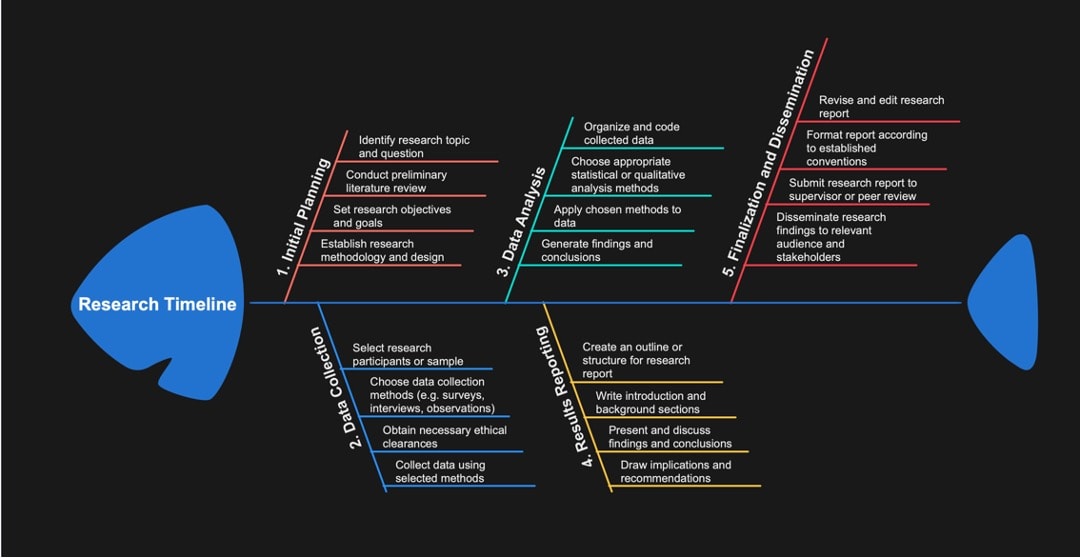
5. Research Goals Timeline
The research goals timeline shows the goals required for each part of the project. The example below utilizes the fishbone diagram, but you can think of other ways to express the timeline's contents. With this research timeline template, you can set specific goals as early as the planning stage.
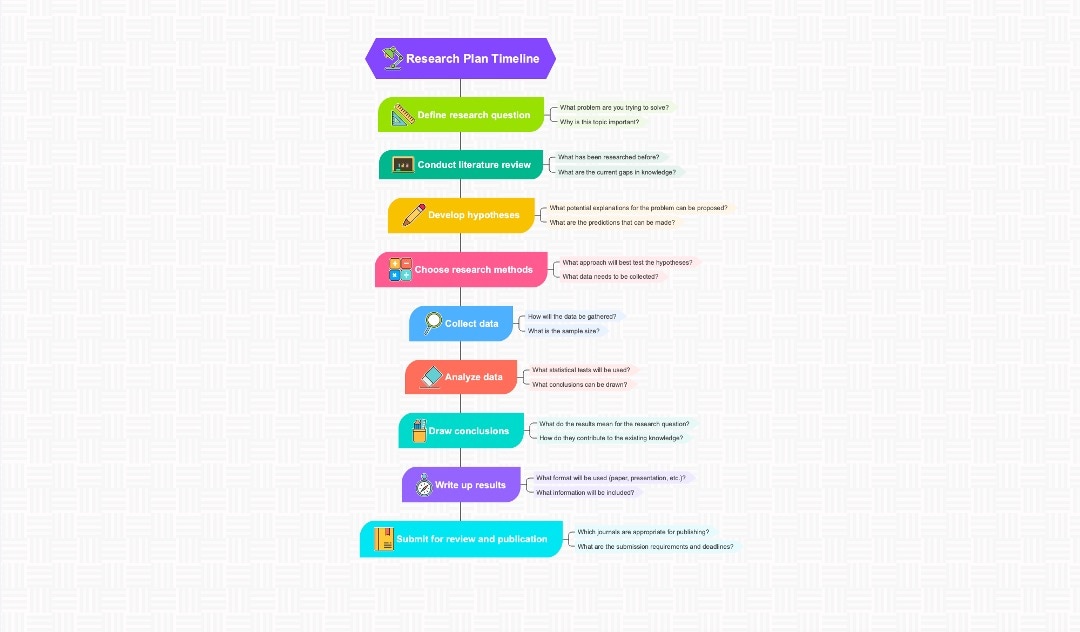
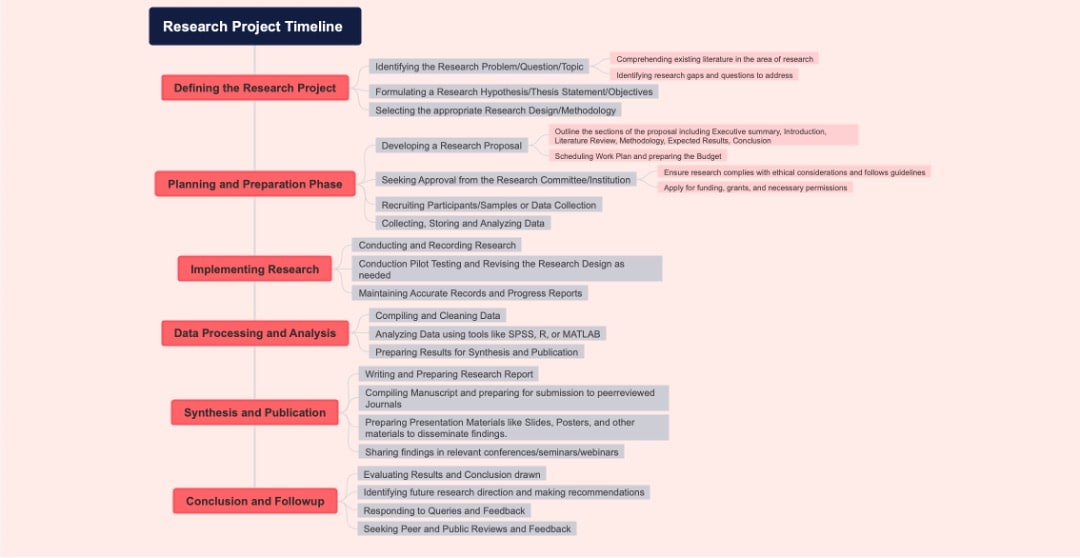
6. Research Planning Timeline
This kind of research template is a more detailed approach to planning. This is generally the best approach for any research, as it considers all the required details for projects. It also includes the goals per part of the paper. Since it uses a vertical template, it makes adding branches to your topics more manageable.
You can use these research timeline templates for your future projects. Please browse the next section on how to look for other templates for your projects using EdrawMind.
7. Simple Project Milestones
Keep your experimental data in check with a structured visual guide. The S-shape design creates a smooth narrative flow for your study. It highlights the progression from "Specimens printed" to the "Neural Network model" built.
Numbered nodes ensure the reader follows the correct order without confusion. As a timeline example for a research paper visual, this chart clarifies the time between steps. The specific day counts help you justify the schedule to any reviewer.
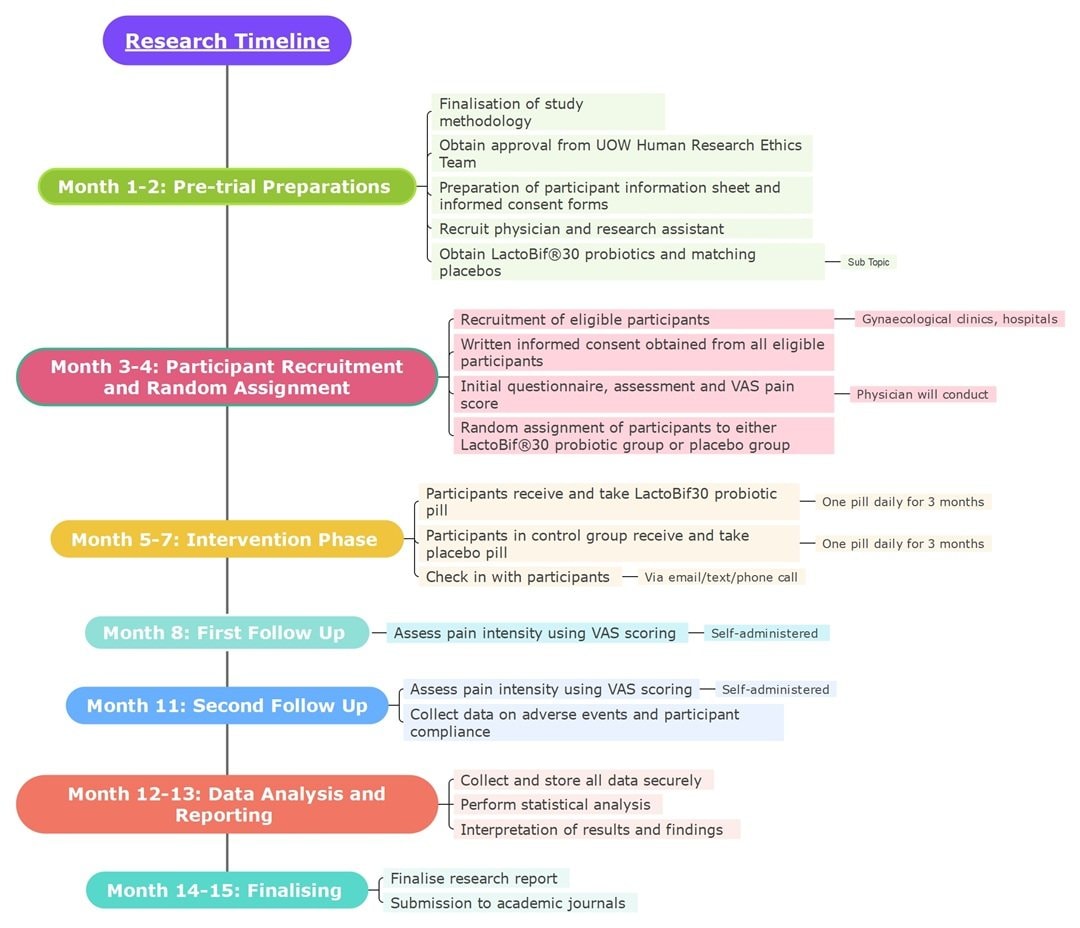
8. Monthly Research Phase
Strict schedules are vital for long clinical trials. You can use this vertical chart to divide the year into colored blocks and illustrate each phase. The flow starts with "Pre-trial Preparations" and then moves toward the final report.
Specific details, such as the use of placebos or VAS scores, fit beside each phase.
A detailed timeline example for research paper sections helps explain the protocol. Visual spacing highlights the necessary pause between the intervention and the later follow-up appointments.
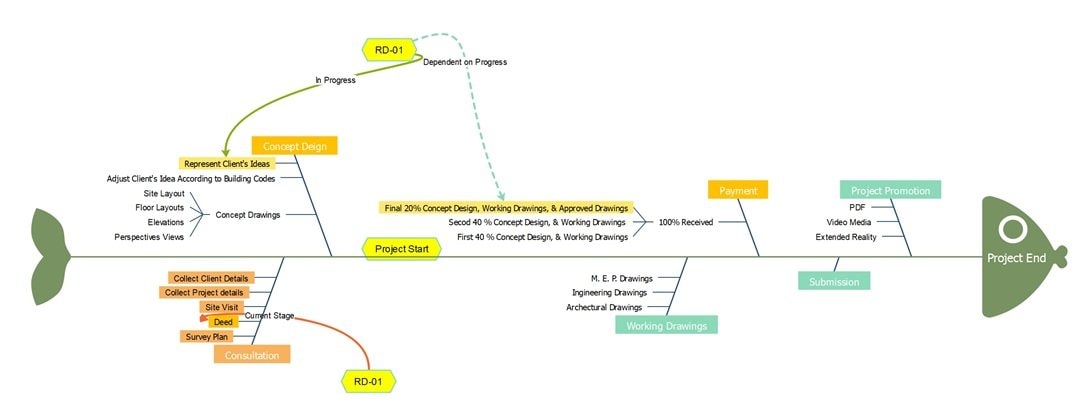
9. Project Management
Complex workflows need a strong visual backbone. The central arrow drives progress from the initial "Consultation" toward the "Project End." Dotted lines connect specific tasks, such as "RD-01," to indicate dependencies.
That feature highlights how a single delay affects subsequent steps. Use this Project Management timeline template to illustrate your process. The separate ribs for "Concept Design" and "Working Drawings" ensure technical details remain distinct from the payment milestones.
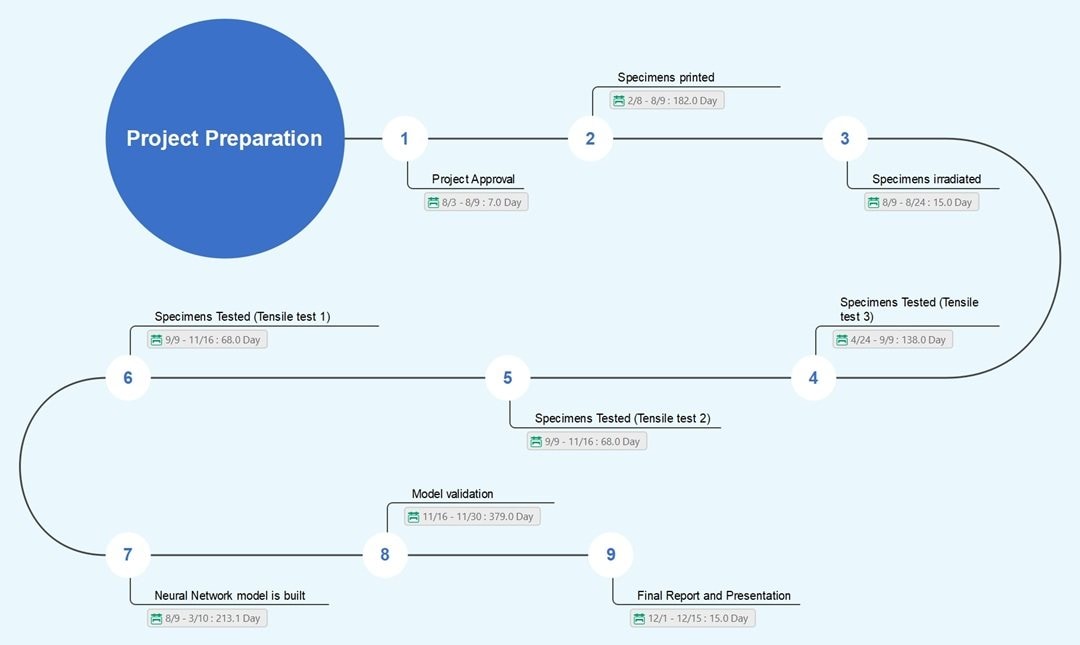
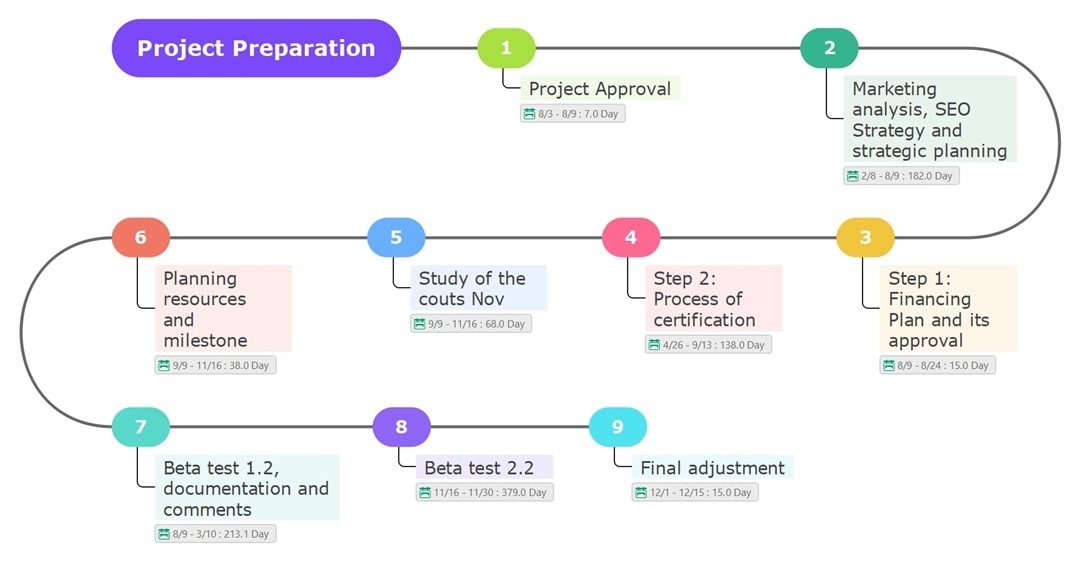
10. Project Preparation
Can you track a multi-year study without confusion? Numbered nodes on this path guide you from "Project Approval" to the "Final adjustment." As a research project methods timeline template, the design keeps your certification process visible.
Note the specific 213-day block for the first beta test. Detailed durations help you justify the time needed for strategic analysis. The visual gap between "Beta test 1.2" and version 2.2 clarifies the distinct validation phases.
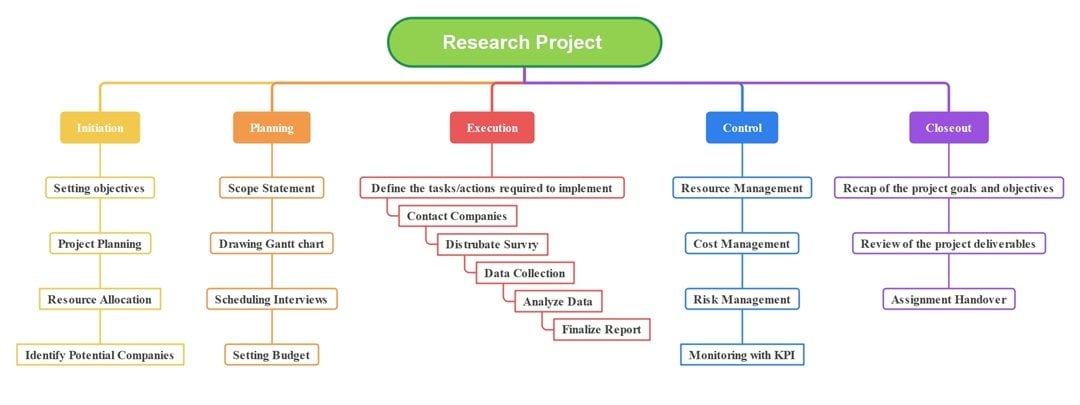
11. Linear Research Project
Five distinct pillars categorize every part of your work. The red "Execution" section features a unique step-down flow for survey tasks. Customize this research paper timeline template to track progress across the semester.
You might add team member names under the "Resource Management" box for accountability. Does the distinct "Initiation" column help clarify your early goals? Follow this visual breakdown to finish the risk management checks ahead of schedule.
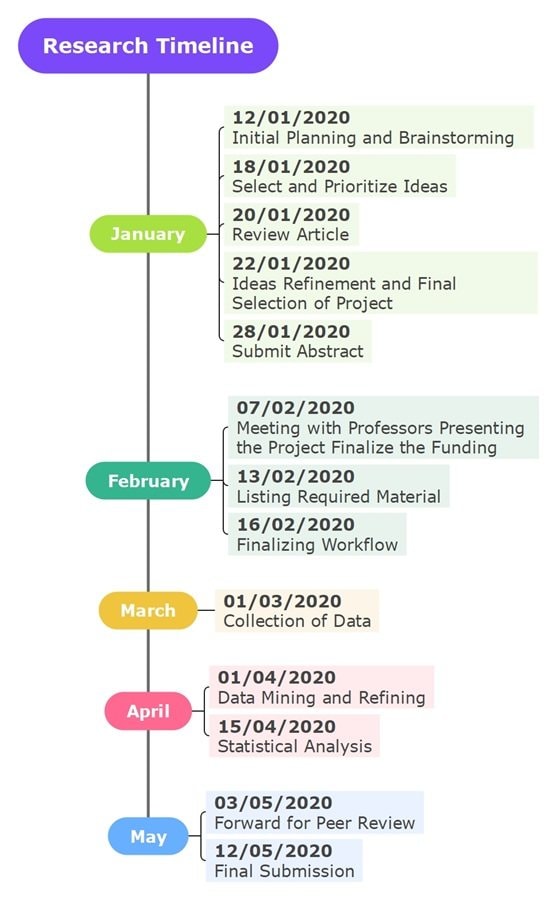
12. Vertical Research Timeline
Track your research project by the specific day with this vertical timeline. It lists concrete deadlines from January to May. Note the available slot for the "Submit Abstract" task. A precise research paper timeline template helps you achieve these targets.
You could also replace the "Meeting with Professors" entry with your own team updates.
Why not add a bold color to the "Statistical Analysis" date for emphasis? The distinct blue section for May highlights the critical push toward the final submission.
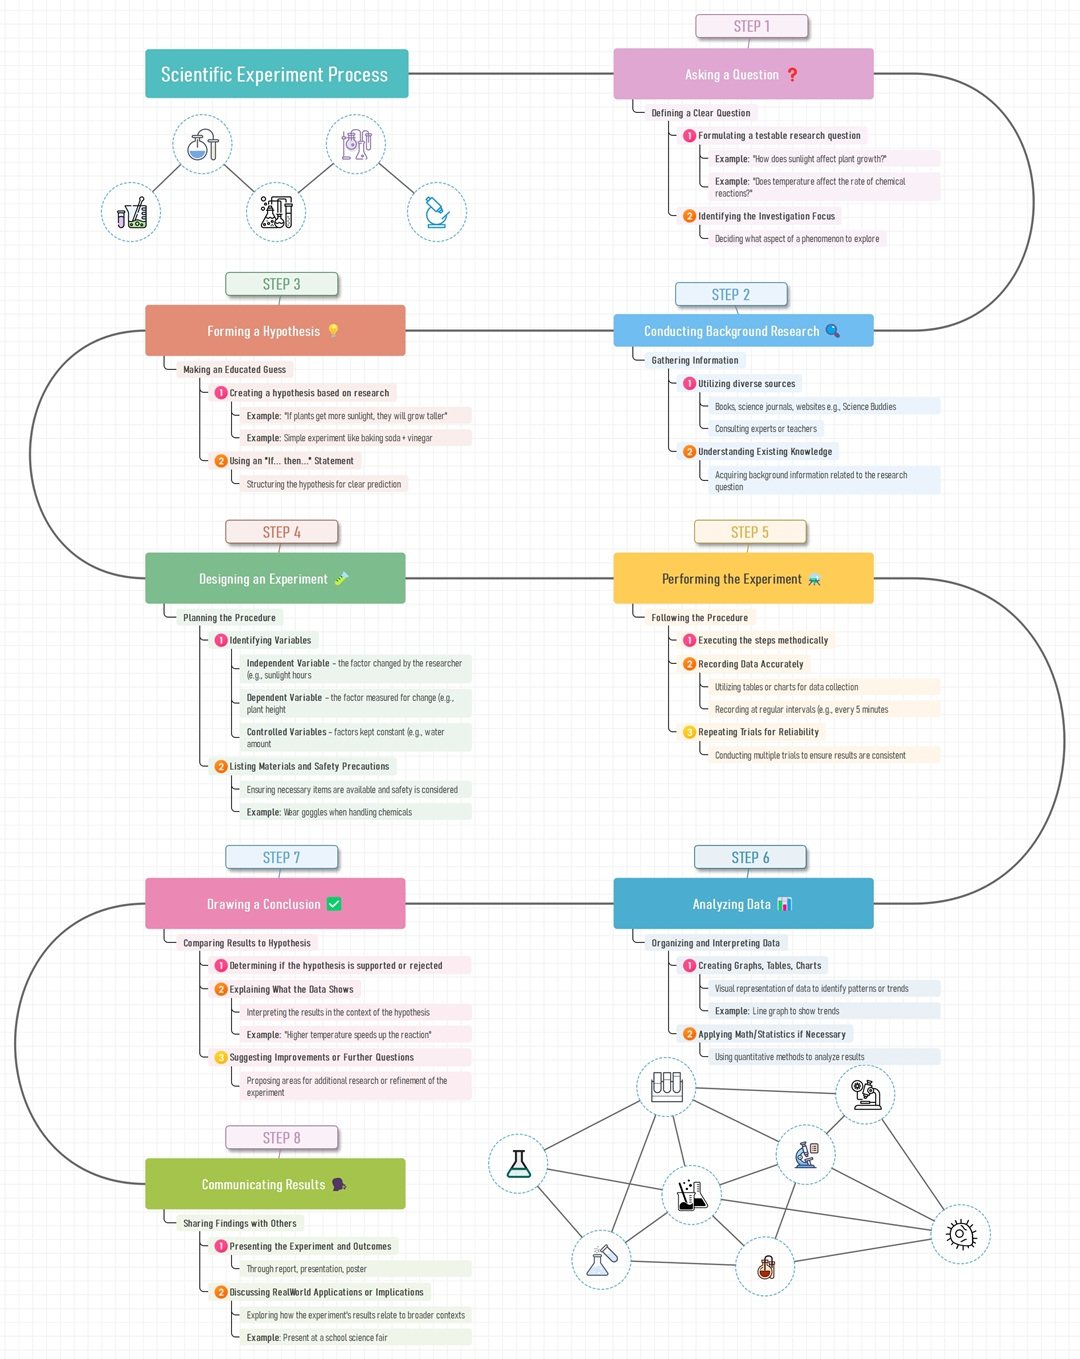
13. Step-by-Step Research
Lab reports need a strong logical flow. So, this winding path connects the initial "Asking a Question" step to the final output. Effective timeline examples visualize these critical connections for your paper.
In fact, the layout highlights the "If... then..." prompts in Step 3 specifically for your hypothesis drafting.
Consequently, you can complete your background research before the variables section in Step 4. This sequence orders the safety precautions before the actual experiment begins.
How To Make a Timeline in EdrawMind
You saw ten timeline examples for research papers. Now you can build one for your own project.
EdrawMind is an AI-powered software that makes it easy to create timeline diagrams. It supports various tasks such as research papers, study plans, or project schedules.
The tool also speeds up your work by letting you customize templates in just a few minutes.
Aside from that, you can add tasks to the timeline, set a start and end time, and convert the entire diagram into a Gantt Chart for better project tracking.
These features help you stay organized, understand your workload, and manage your study pace. Solo users gain direction for personal projects, and teams can brainstorm ideas in one space.
Key Features
EdrawMind offers you features that support academic and creative work:
- Template Gallery: Browse over 5,000 built-in and creative templates. You can find options for science, history, literature, business, and more.
- AI Tools: Speed up your workflow with AI assistance. Generate a mind map in one click or brainstorm new ideas. The tools can also write copy and translate text for you.
- Real-Time Collaboration: More than 100 people can work on a file at once to share ideas. This helps your group build better output.
- Flexible Customization Styles: Choose from 30 layouts, including timeline, top, horizontal, and S-shape styles. Apply 52 themes to switch color styles with options like rainbow, monochrome, or gradient.
- Cross-Platform Compatibility: Work on your research timeline across all your devices. Switch between Windows or Mac desktop, iOS and Android apps, and your web browser anytime.
Here are the steps to make a timeline for a research paper:


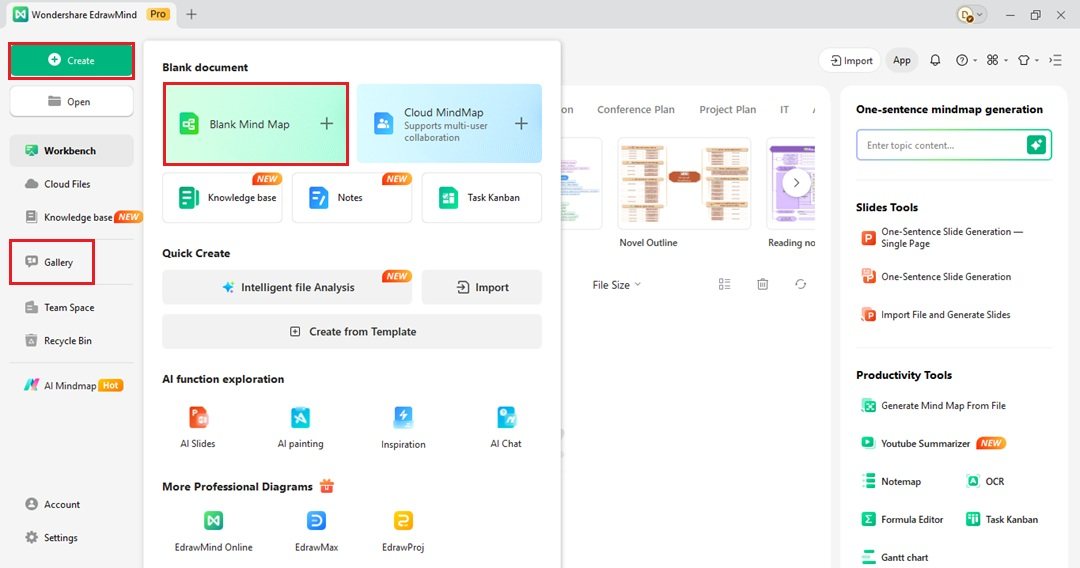
Step 1 Start a New Project
- Open the Workbench menu and click Create on the upper left side. Choose Blank Mind Map to start from scratch.
- Visit the Gallery on the left side instead. Type "timeline" in the search bar. Click Duplicate on a template you like.
Step 2 Input Data
- Double-click on any topic node. Type your specific dates and event descriptions there.
- Add more points to the timeline. Go to the Start tab at the top menu. Select Topic or Subtopic from the dropdown list to add a new branch.
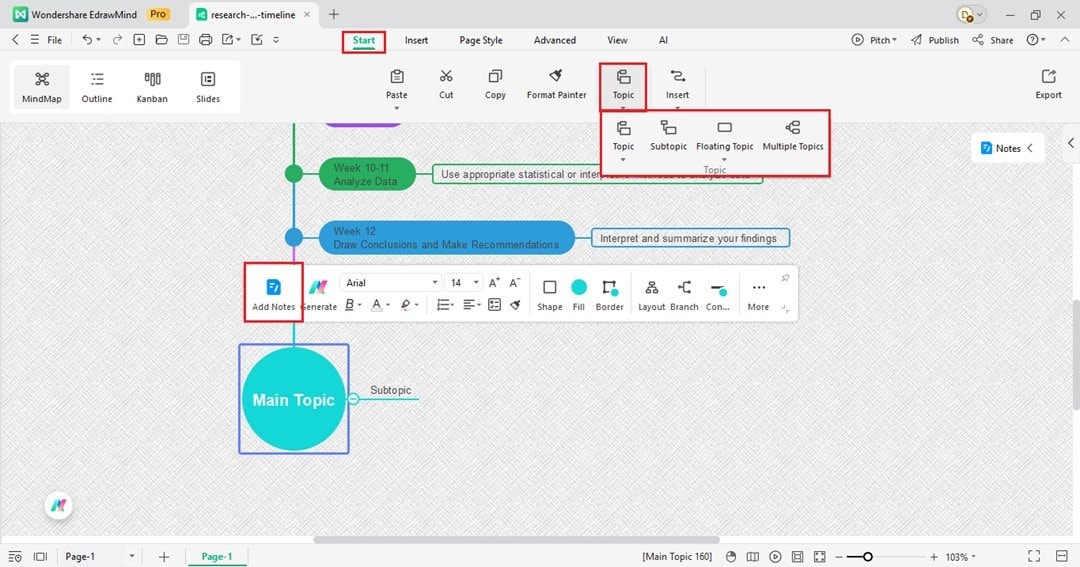
Tip: Select a topic from the timeline, then click Add Notes from the floating toolbar.
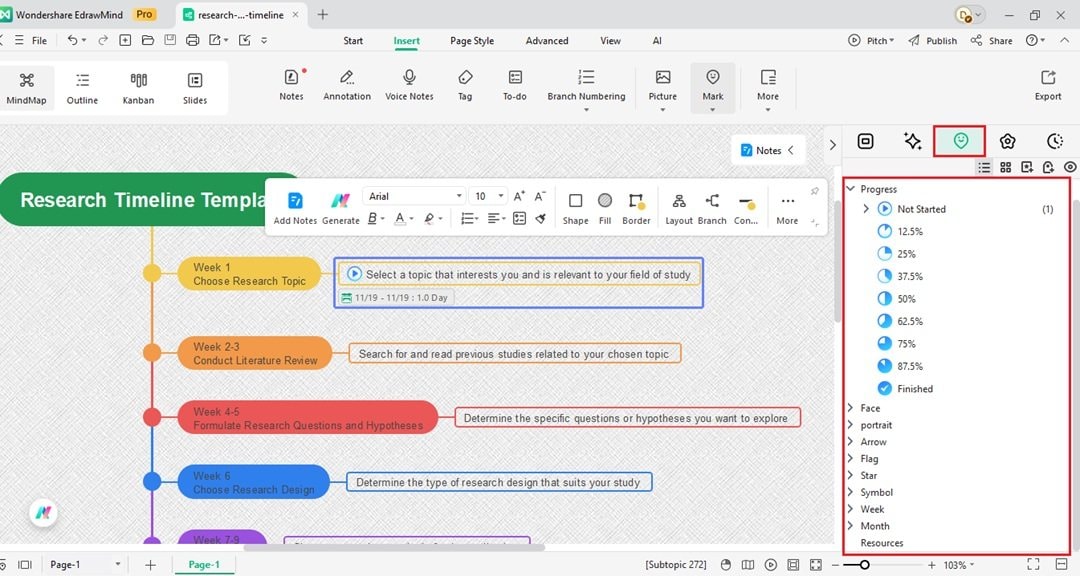
Step 3 Insert Visual Elements
- Go to the Insert tab in the top menu. Select an option from the Picture dropdown list. You can use a file from your computer, Pexels, or use AI to generate one.
- Select a node from the timeline to add icons.
- Open the right panel and find the Mark tab. From here, choose an icon in various categories such as Priority, Progress, and Month. Drag and drop it onto the canvas.
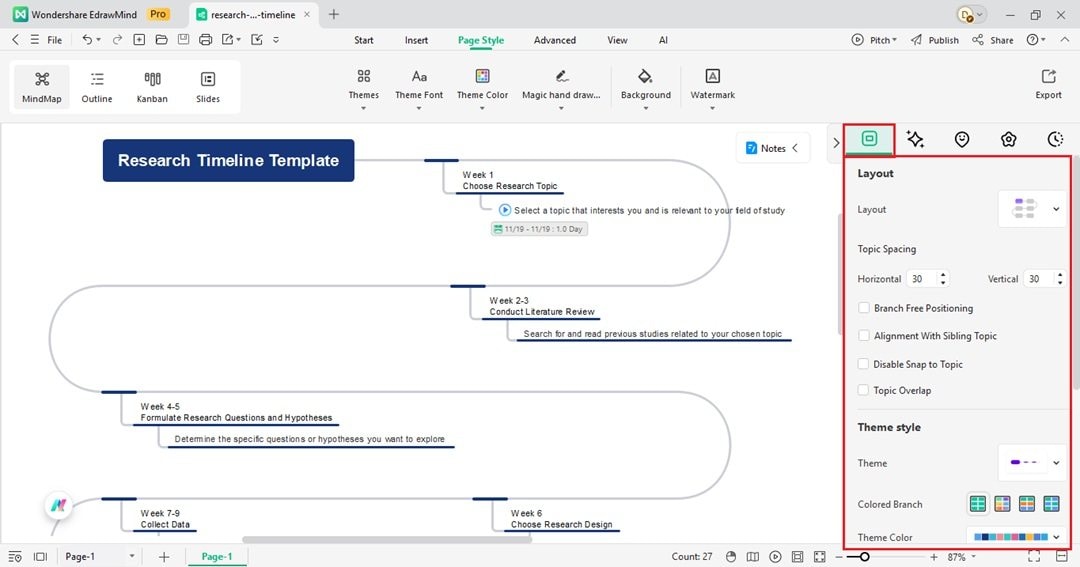
Step 4 Change the Look
- Go to the Map tab in the right panel. This menu lets you adjust the diagram structure.
- Select the central idea from the timeline, then pick a specific form from the Layout list.
- Find the Theme section further down. Select a new color group to update the whole chart fast.
Tip:
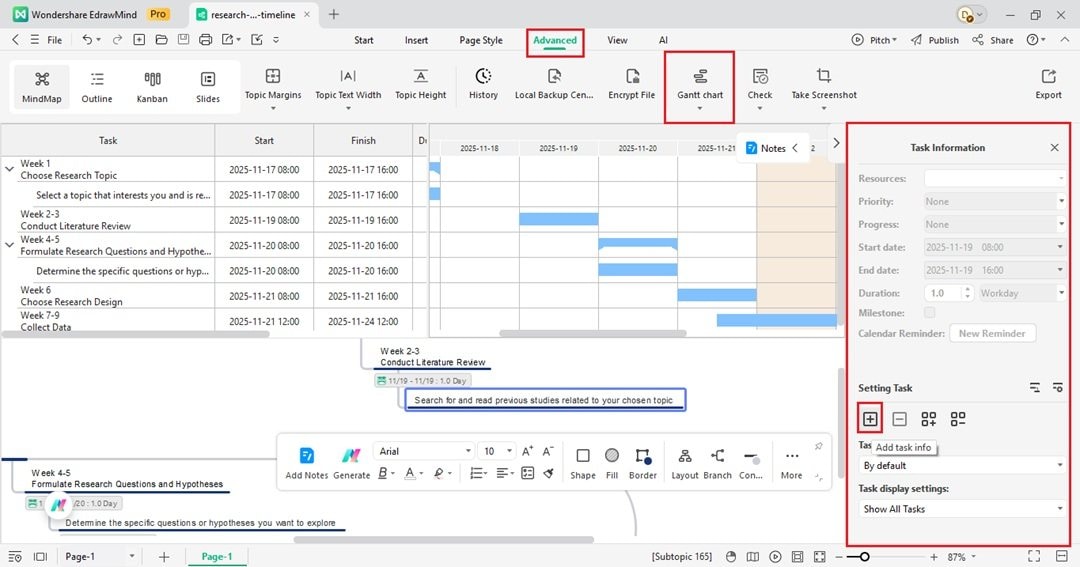
- Convert your timeline into a Gantt Chart in a few simple steps.
- First, open the Advanced tab from the top menu, then select Task from the Gantt Chart dropdown menu.
- Set task information to any node in your timeline from the right panel.
- After assigning dates to all tasks, choose the Gantt Chart option from the dropdown menu to view your timeline as a Gantt Chart.
Step 5 Save and Send
- Go to File > Export in the top left menu. Choose a file format like JPG, PDF, Word, or PPT.
- Click Share on the top right corner creates a link to send to your team.
Tips to Create an Effective Research Timeline
Creating a timeline can be quite a task, but knowing some tips and tricks can make the process less daunting and more efficient. Here's a closer look at some strategies to help you create a robust and effective research timeline.
Setting Objectives and Milestones
Setting clear objectives and milestones is the first crucial step. It's like setting up the destination and checkpoints in maps before starting a long drive. You need to know what you aim to achieve and the significant stages you must reach. These milestones guide your efforts and offer a sense of achievement as you tick them off, keeping you motivated throughout the project.
Breaking Down Tasks
Next, break down your tasks into smaller, manageable parts. Consider an enormous task as a puzzle; trying to complete it all at once can be overwhelming, but if you break it down into smaller pieces, it becomes manageable and less daunting. Smaller tasks also allow for better distribution of work among team members, leading to increased productivity and efficiency.
Allocating Time and Resources
Allocating time and resources realistically is another vital aspect. Understanding that each task requires a specific amount of time and resources is essential. Overloading your schedule or underestimating the time needed can lead to stress and rushed work. By being realistic and considerate about your limitations and capacities, you can ensure a smoother workflow and better quality of work.
Updating the Timeline in Real-Time
Monitoring progress and adjusting the timeline as needed is equally important. You must be able to adapt and edit your timeline according to the actual situation of your research project. There might be unexpected delays or tasks that get completed faster than anticipated. Regular monitoring allows you to stay flexible and adapt your timeline accordingly, ensuring you stay on track.
Collaborating With Others
Lastly, collaboration becomes critical to success when working in a team. EdrawMind's sharing features can be handy here. These features allow you to share your timeline with your team members, ensuring everyone is on the same page about what needs to be done and when. You can also ask the help of everyone to update the timeline now and then and even add their ideas.
Conclusion
Summing up, research timelines are instrumental in effectively managing a research project. They serve as a guiding light, illuminating the path to your project's completion by outlining the process, setting milestones, and keeping everyone on track.
Simplify the process of creating a research timeline by duplicating the templates provided in this article. You can also make the most out of EdrawMind's features. These offer a structured way to plan and organize your research work, making the journey less daunting and more manageable.
So, the next time you're starting a research project, remember the importance of a well-structured research timeline. Utilize these templates, take advantage of EdrawMind, and apply these tips and tricks to navigate your way to a successful research project with ease and confidence.
