


As you may have seen on social media in the past years, you might have noticed that brands, institutions, or organizations are fond of posting information like company milestones and projects in a beautiful and accessible way. Giving people summarized and easy-to-understand information is better than bombarding them with dense chronological reports.
Timelines serve as an effective method to present sequential or chronological information. Institutions use these diagrams because they are easy to follow and guide the reader to the information. When combined with the powerful concept of infographics, information campaigns are made a lot easier.
So, this article will explore the whats, whys, and hows of timeline infographics. After reading here, you will be equipped with the knowledge needed to make amazing timeline infographics for whatever purpose you need them.
In this article
What Are Timeline Infographics?
To understand what timeline infographics are, it is important to understand the concepts that comprise the term: 1) timeline, and 2) infographics. First, a **timeline** is a visual tool or diagram showing events and milestones chronologically. It is usually linear and allows viewers to see the relationships between different events.
Second, an infographic is more of a content format. It focuses on combining aesthetics with textual information to communicate hard-to-understand details more quickly. Simply put, they transform raw data into easy-to-digest visual stories. Infographics use colors, icons, charts, illustrations, typography, and more.
So, when you combine these two powerful concepts, they create the product: timeline infographics. You can define them as visual narratives that present chronological information through carefully designed graphic elements. Timeline infographics combine the clarity of timelines with the visual appeal of infographics. The result is more straightforward information campaigns for any institution.
Types of Timeline Infographics
Now that timeline infographics have been established, below are some different kinds. It’s good to note that the types of timeline infographics are based on the kinds of timelines, because infographics are just a content format. So, here are some timeline types throughout this section.
- Chronological Timelines
Chronological timelines are the simplest kind. They show events in order, from the earliest to the latest. This makes them great for history, company milestones, or biographies. Their strength lies in clarity. Audiences can follow the story from start to finish without confusion.
- Process Timelines
Process timelines highlight steps instead of dates. They show the order of actions rather than when they happened. This format works well for workflows, project phases, or instructions. It’s often used in training, education, and project management because it explains how things move forward step by step.
- Roadmap Timelines
Roadmap timelines look ahead. They present plans, goals, or milestones. Businesses often use them for strategy, product development, or long-term projects. This type of infographic helps people see what’s next and understand the path forward.
- Comparison Timelines
Comparison timelines put two or more sequences side by side. They make it easy to compare developments that happened at the same time. These are useful for tracking companies, products, or events against one another. By showing parallel growth, they give context and reveal relationships.
- Interactive and Digital Timelines
Interactive timelines add movement and user control. Viewers can zoom in, click, or navigate through details. This makes them ideal for complex topics that need more depth. Digital formats also engage audiences by turning a static timeline into an experience.
Examples of Timeline Infographics
It helps to see an actual example rather than just reading what timeline infographics are. So, here are some real-life examples of how timeline infographics are used:
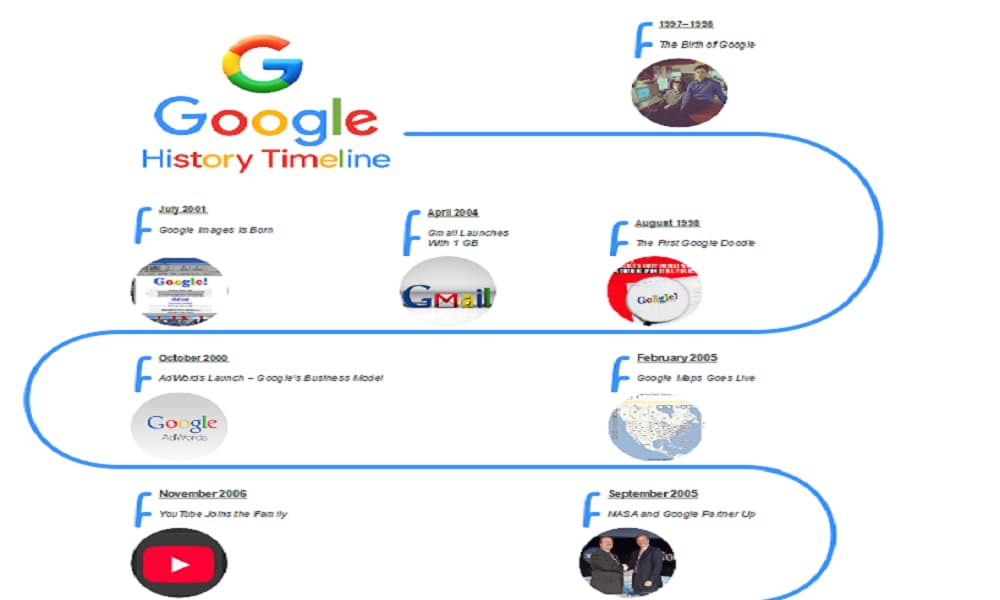
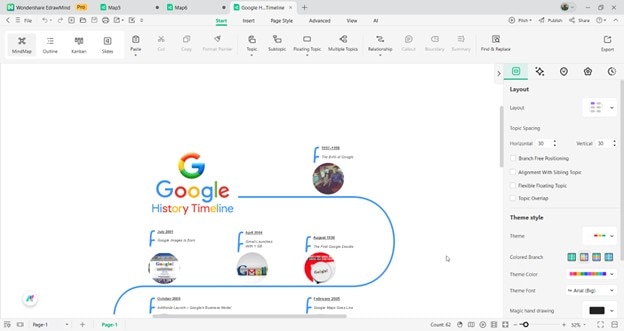
Google Company Timeline
Everybody knows Google. This timeline infographic uses relevant images and beautiful icons to showcase how the popular website became what it is today. You can notice how the blue color scheme is strategically used so it blends with one part of Google’s official logo.
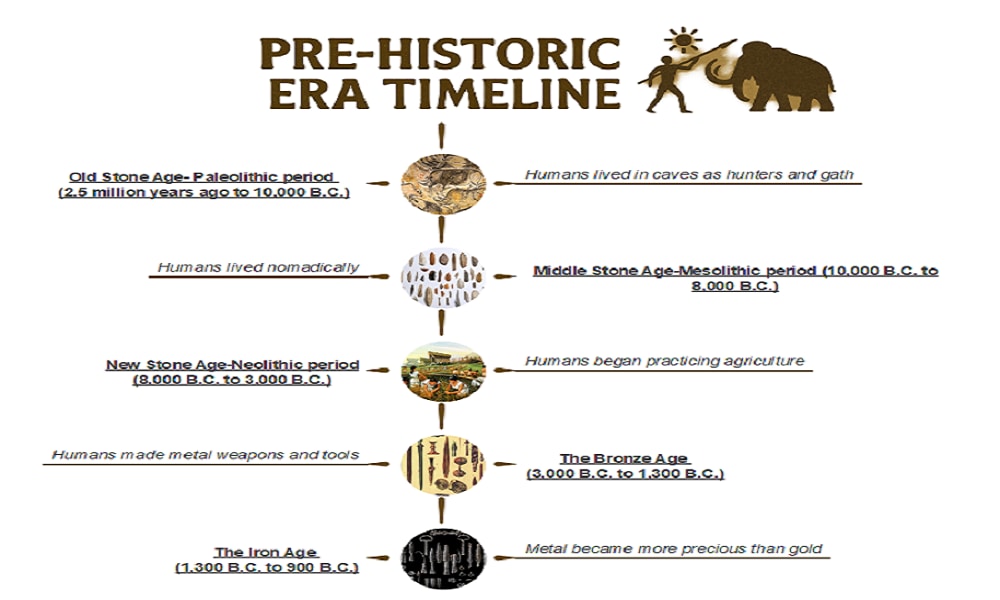
Prehistoric Timeline
Next up is a prehistoric era timeline. This is a simple vertical timeline, but it adds relevant images to make the infographic more information-rich. Its viewers can properly visualize what it feels like back in those prehistoric ages because of the strategically placed icons.
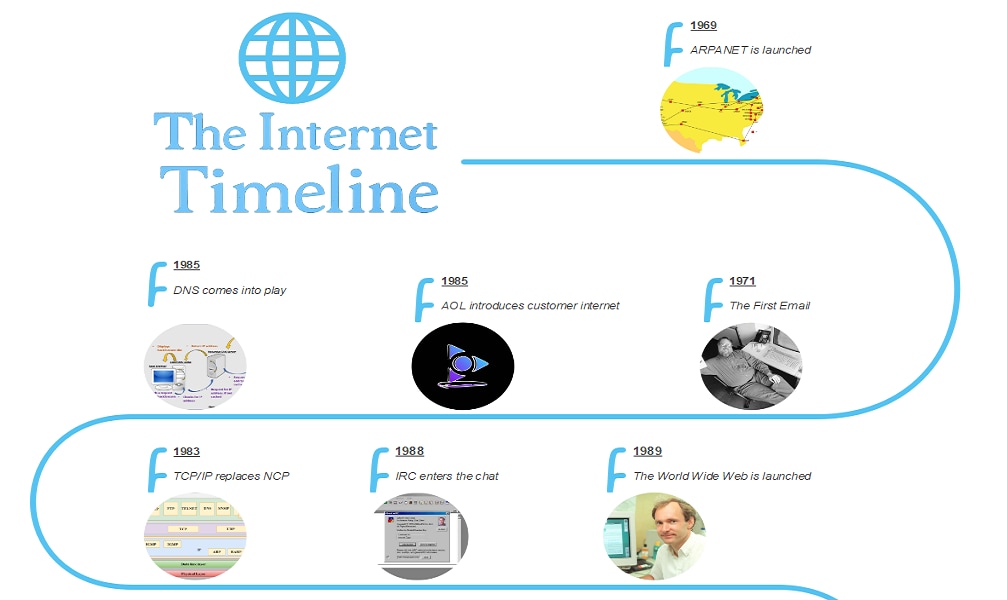
Internet Timeline
Lastly, this internet timeline uses the same strategy as the previous ones. Adding actual images of the events in infographics is a great idea to improve immersion. In this specific example, you’ll see pictures of the ARPANET and the founder of the World Wide Web.
How To Create Timeline Infographics
Now that you’ve looked at timeline infographics and why they matter, here is the practical side. Making one might feel tricky at first, but it's manageable with the proper steps and tools. The idea is to break the process down and stick to basic design principles.
A timeline infographic is more than dates on a line. It’s a way of telling a story visually, simplifying complex information, and guiding your audience through it. Whether you’re showing company history, explaining a process, or mapping out future goals, the steps to create one stay the same.
Here’s how you can create timeline infographics easily:
Planning the Content
Start with the content before design. Gather all the data, dates, and details you need. List the key events, steps, or milestones. Keep it focused—only include what serves your purpose.
Once you’ve gathered the information, build a clear outline. Put events in a logical order. Decide which details matter and cut what doesn’t. The best timeline infographics are simple, easy to read, and not overloaded with extra information.
Choosing the Right Format
Next, pick a format. The most common are vertical, horizontal, and circular. For example, vertical timelines and limited horizontal space work great for mobile viewing. They're perfect for social media posts or when you want readers to scroll down naturally.
Making the Timeline Infographic
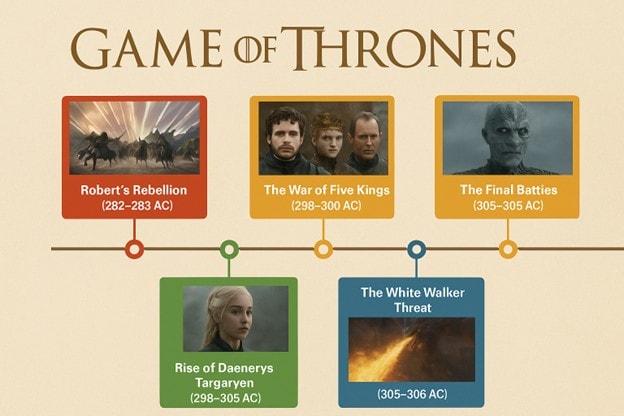
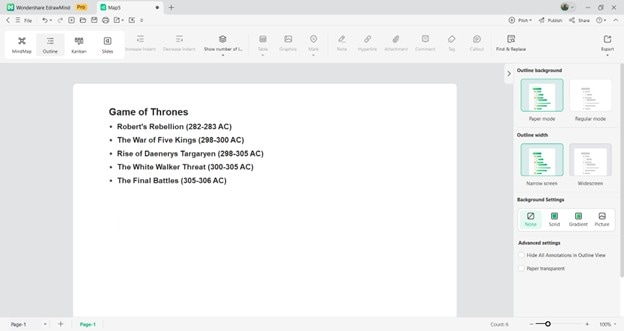
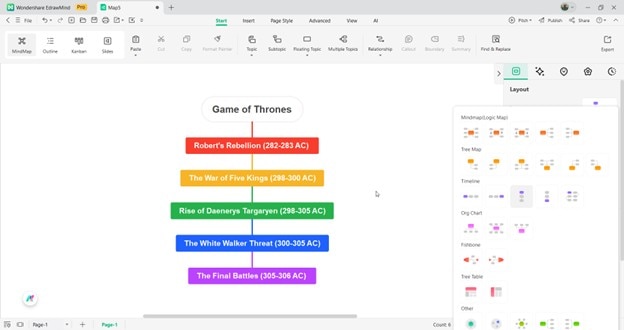
Finally, design the infographic. Use icons or images to represent each milestone. This adds clarity and keeps the timeline engaging. This example is about related pictures in the series Game of Thrones.
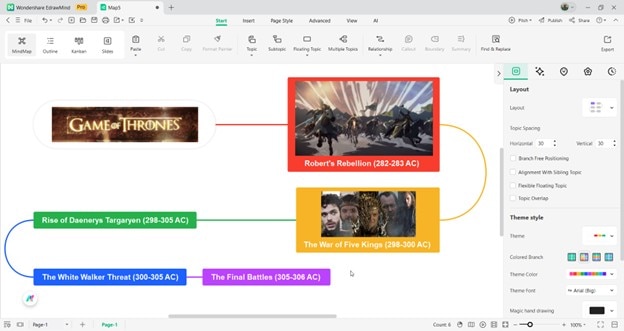


Choose readable fonts and use hierarchy—bigger text for main events, smaller for details. Leave enough white space so the layout feels balanced. A clean design makes the story easier to follow.
Tips for Making Effective Timeline Infographics
When making your timeline infographics, here are some tips to take note of:
- Minimal text. Infographics offer information quickly. So your text must be soon scannable. Use keywords and essential phrases only.
- Clear visuals. Since infographics rely on visual elements, choosing clear ones that contribute to the purpose of giving information is also essential.
- Contrasting colors. One standard problem editors face is that they use non-contrasting colors in graphics. This makes the text hard to read, especially when making an infographic with bold colors.
- Purposeful icons. Use icons only when they add meaning. Keep a consistent style and avoid mixing different looks. Every icon should reinforce the message.
EdrawMind: A Powerful Tool for Making Timeline Infographics
When creating professional timeline infographics, having the right tool makes all the difference. That's where Wondershare EdrawMind comes in. This tool allows you to create visual tools, such as timeline infographics. With a focus on providing professional-level design to beginners, this tool is excellent even if you’re new to visual design.
What makes EdrawMind for making timeline infographics is its boatload of tools. You can access AI tools, an extensive library of symbols, and built-in support for image uploads. This means that you can add the right pictures or icons to improve the design of your project.
To be specific, though, here are some key features you should take note of when considering EdrawMind as your infographics partner:
- MindMap Gallery (pre-designed templates). While it’s called MindMap Gallery, EdrawMind’s Library of user-made templates includes other diagram types. And yes, it contains infographics of many forms.
- Automatic alignment and drag-and-drop tools. Its automatic alignment and drag-and-drop make it easy to create infographics with EdrawMind. You won’t have to worry about precisely placing icons and elements because images snap right to where they belong (you have the freedom to place them anywhere).
- AI tools. As part of EdrawMind’s thrust to deliver high-level tech within the program, it also offers AI tools such as image or mind map generators, copywriting and writing assist, and a built-in chatbot for design inspirations or information.
- Color customization. You can make cohesive designs that match your brand guidelines by easily changing colors, fonts, and styles throughout your timeline with just a few clicks. It even offers built-in color themes that you can choose from.
Ending Notes
Throughout the article, you’ve learned all about timeline infographics, especially the what, the why, and the how. Remember that planning is key if you’re ready to create one. Make sure that the infographics reflect your identity and showcase the information.
When making these graphics, use Wondershare **EdrawMind**. It offers several tools to help you create the best-looking timeline infographic, while making it super informative.
