


What is a Sunburst Chart?
In many scenarios in work or study, the pie chart may be one of the most commonly used charts. It can be used to display the contents of a certain category.
However, when dealing with multi-level data, pie charts are not enough. At this time, the emergence of the sunburst chart solved this problem.
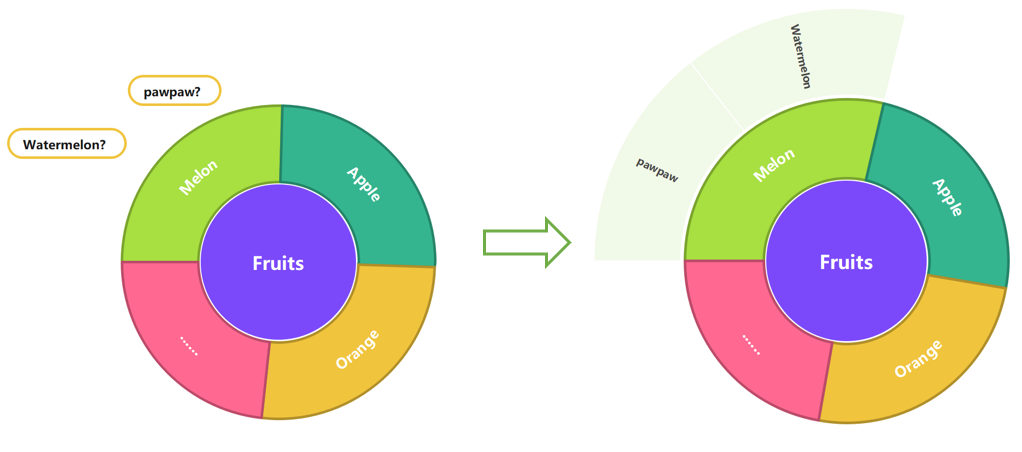
Sunburst Chart — also known as Ring Chart, Multi-level Pie Chart, and Radial map — is typically used to visualize hierarchical data structures.
A Sunburst Chart consists of an inner circle surrounded by rings of deeper hierarchy levels. The angle of each segment is either proportional to a value or divided equally under its parent node.
Examples of Sunburst Charts
Now that you know how to make a sunburst chart, here are a few examples to help you think about what else you can do with a sunburst chart.
-
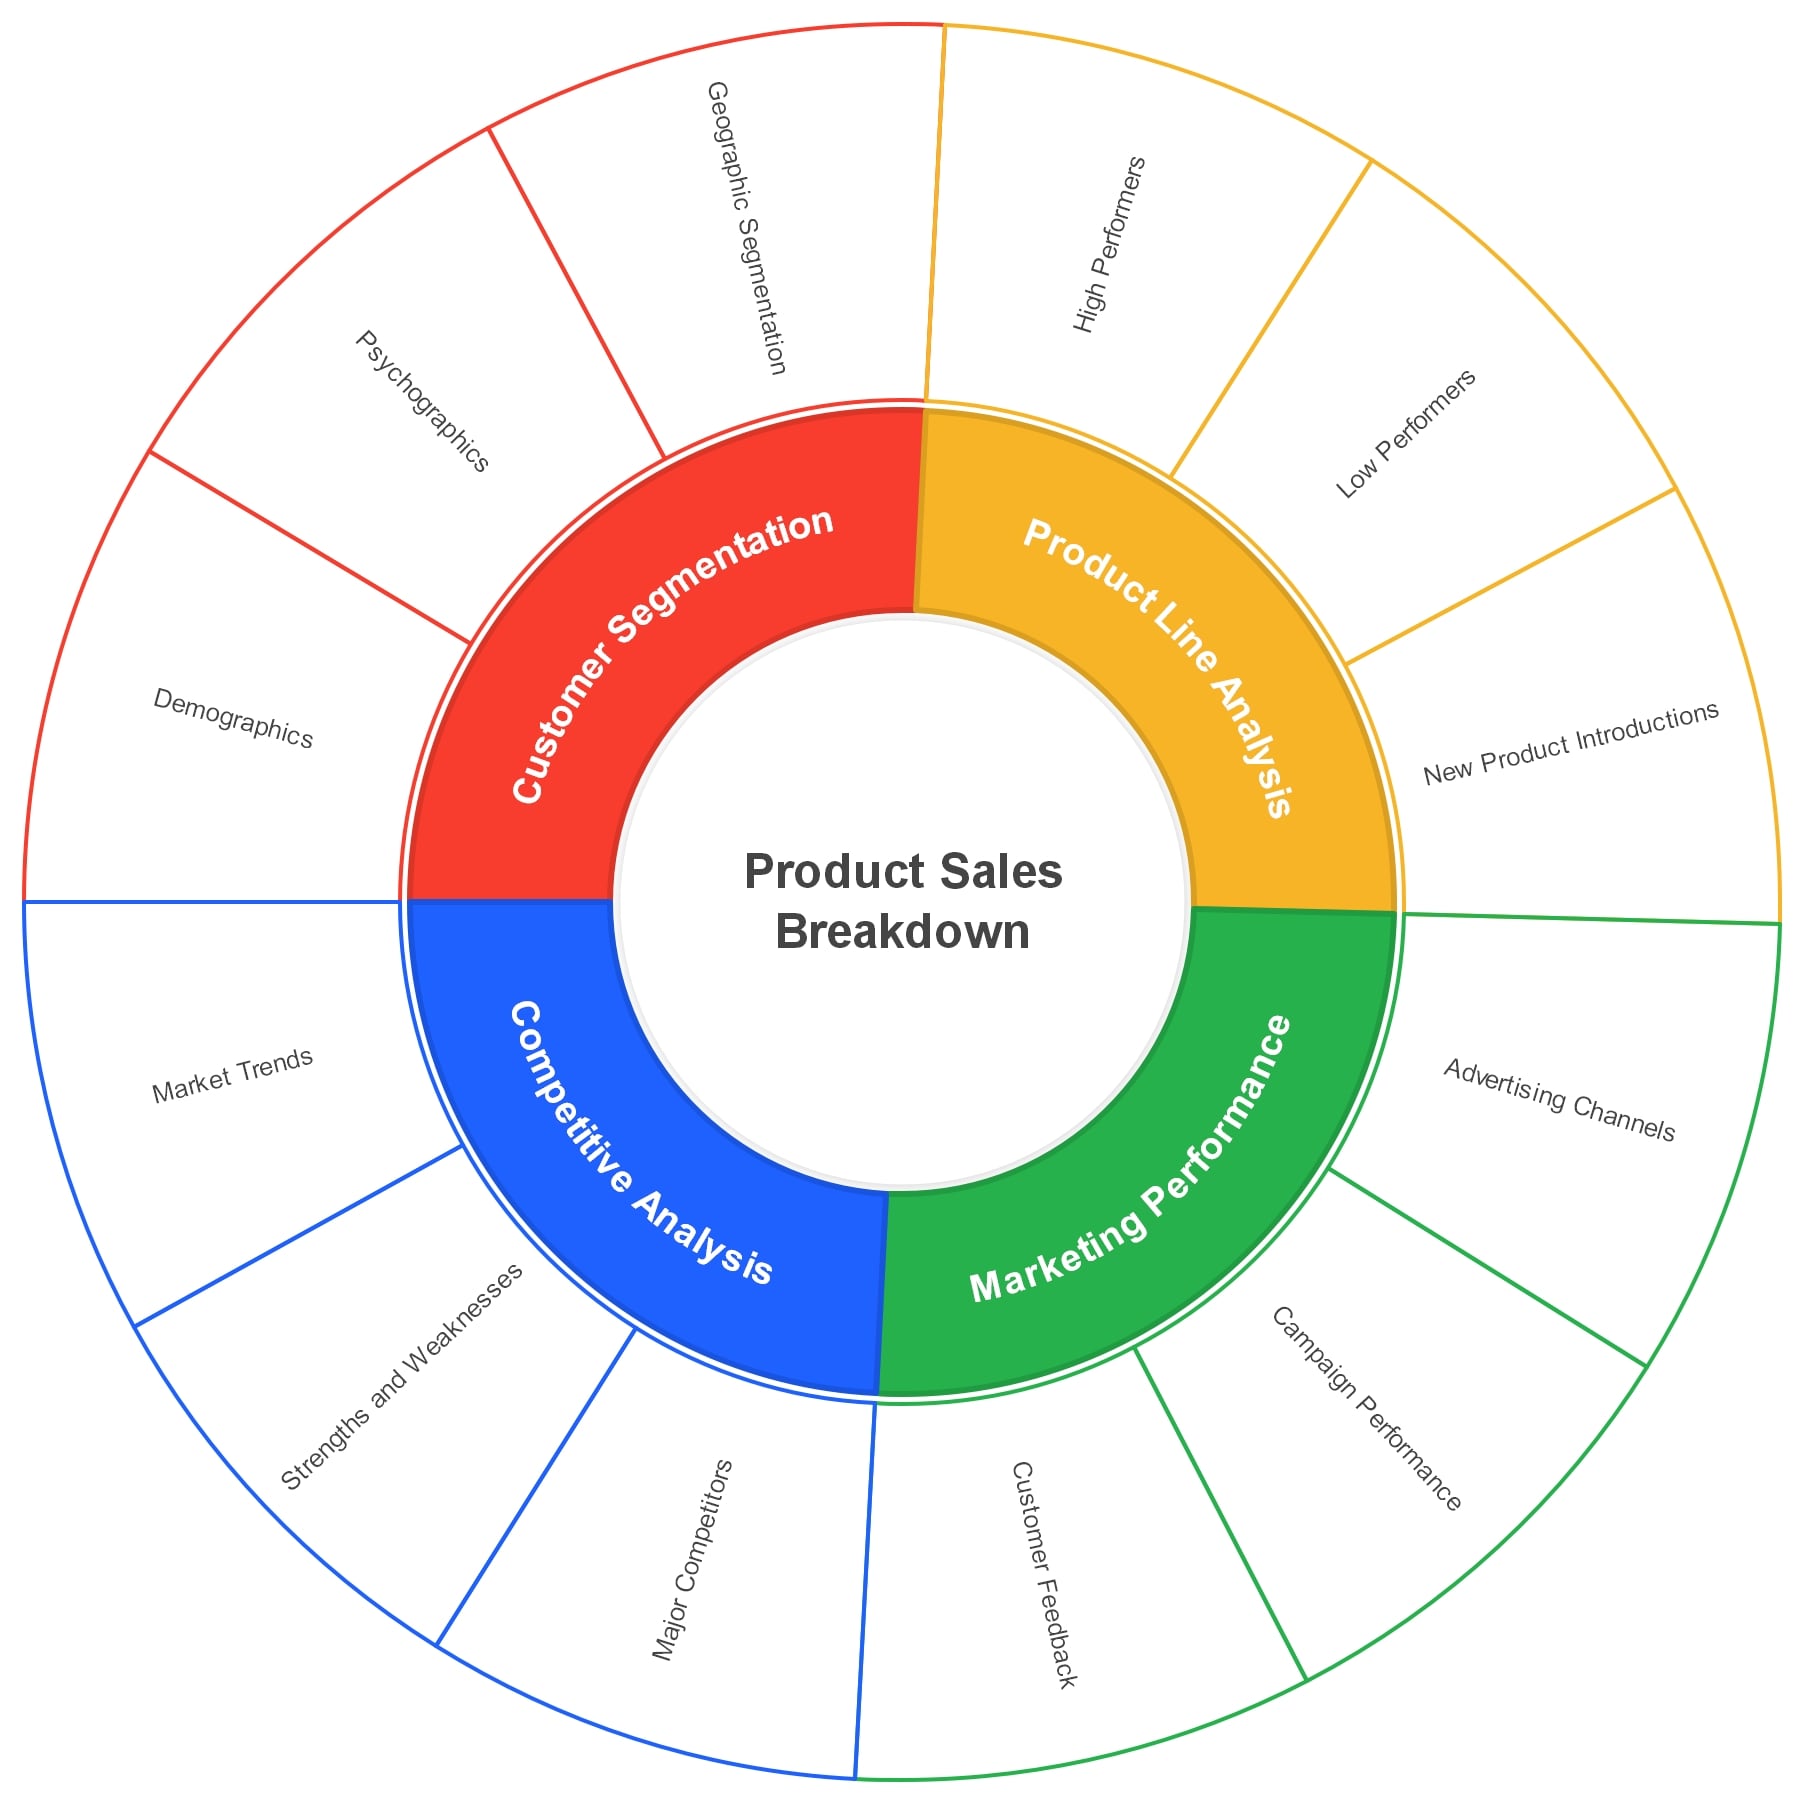
1. Product Sales Breakdown Sunburst Chart
This chart shows product sales data broken down by customer segmentation, product line analysis, competitive analysis, and marketing performance. Businesses use it to identify top-performing markets, recognize low-performing segments, and make informed decisions on resource allocation for growth.
Product Sales Breakdown Sunburst Chart

-
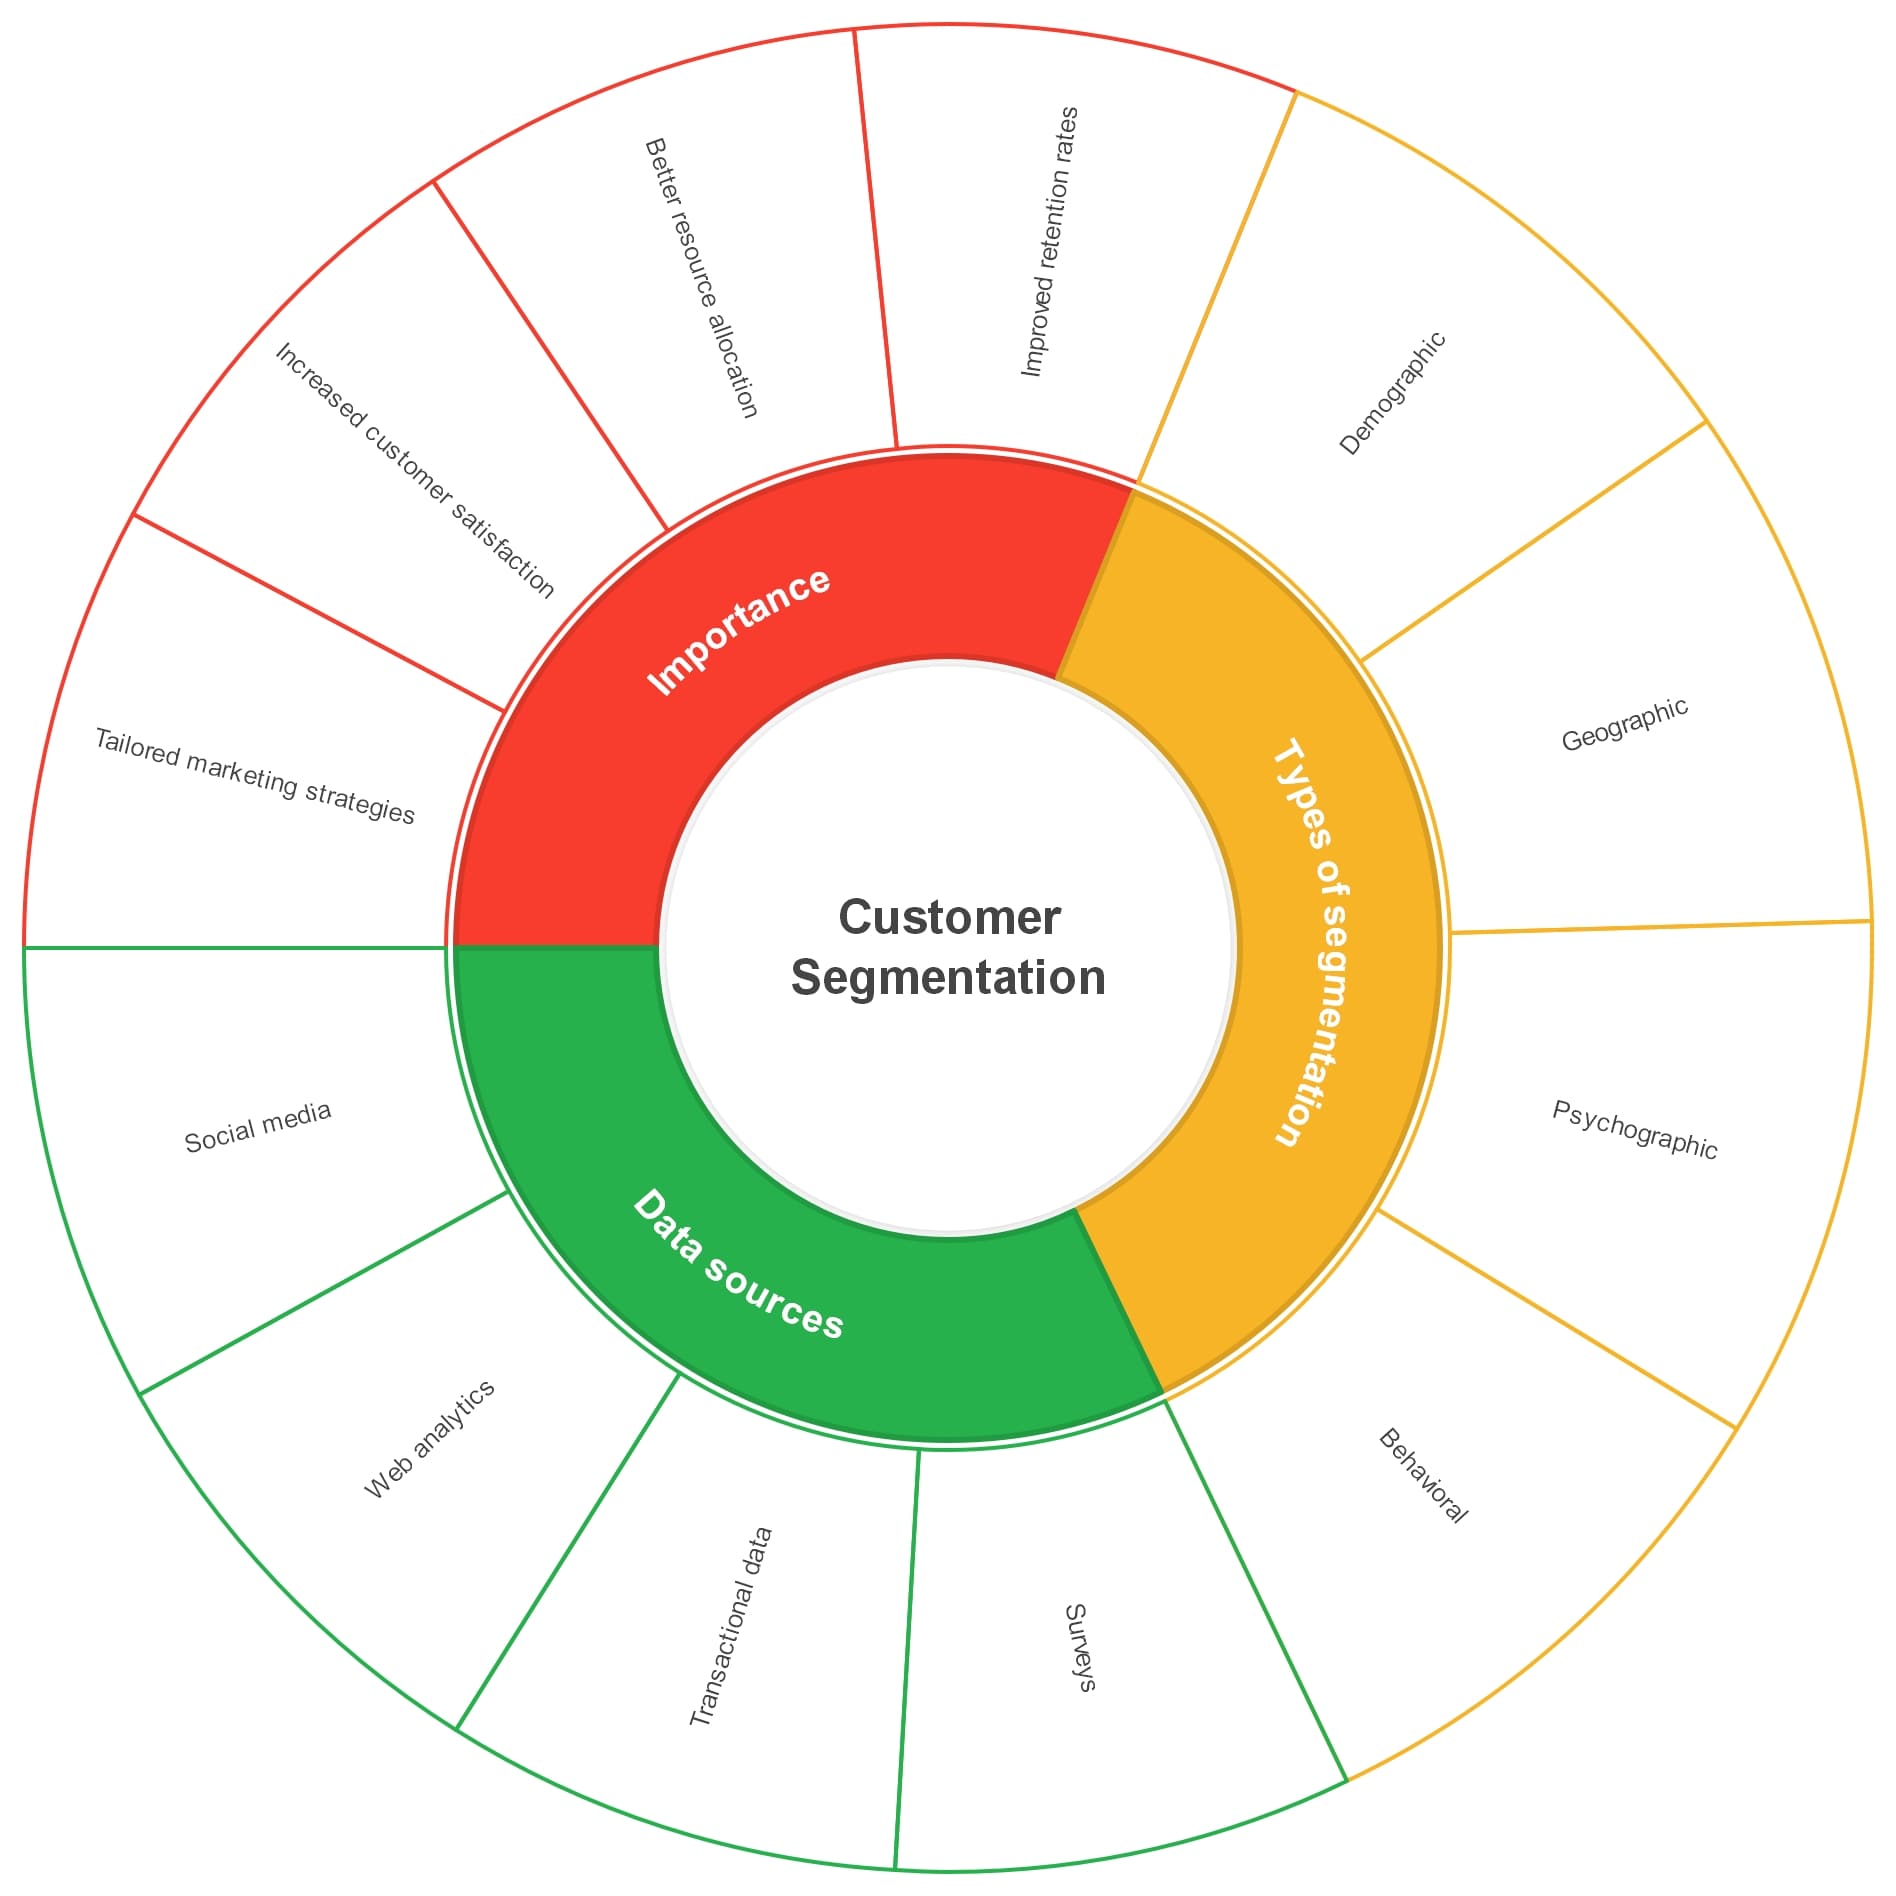
2. Customer Segmentation Sunburst Chart
A customer segmentation sunburst chart organizes customers by market, age groups, interests, and purchase frequency. It is highly useful for marketing teams that want to tailor strategies to specific buyer personas and boost conversion rates effectively.
Customer Segmentation Sunburst Chart -
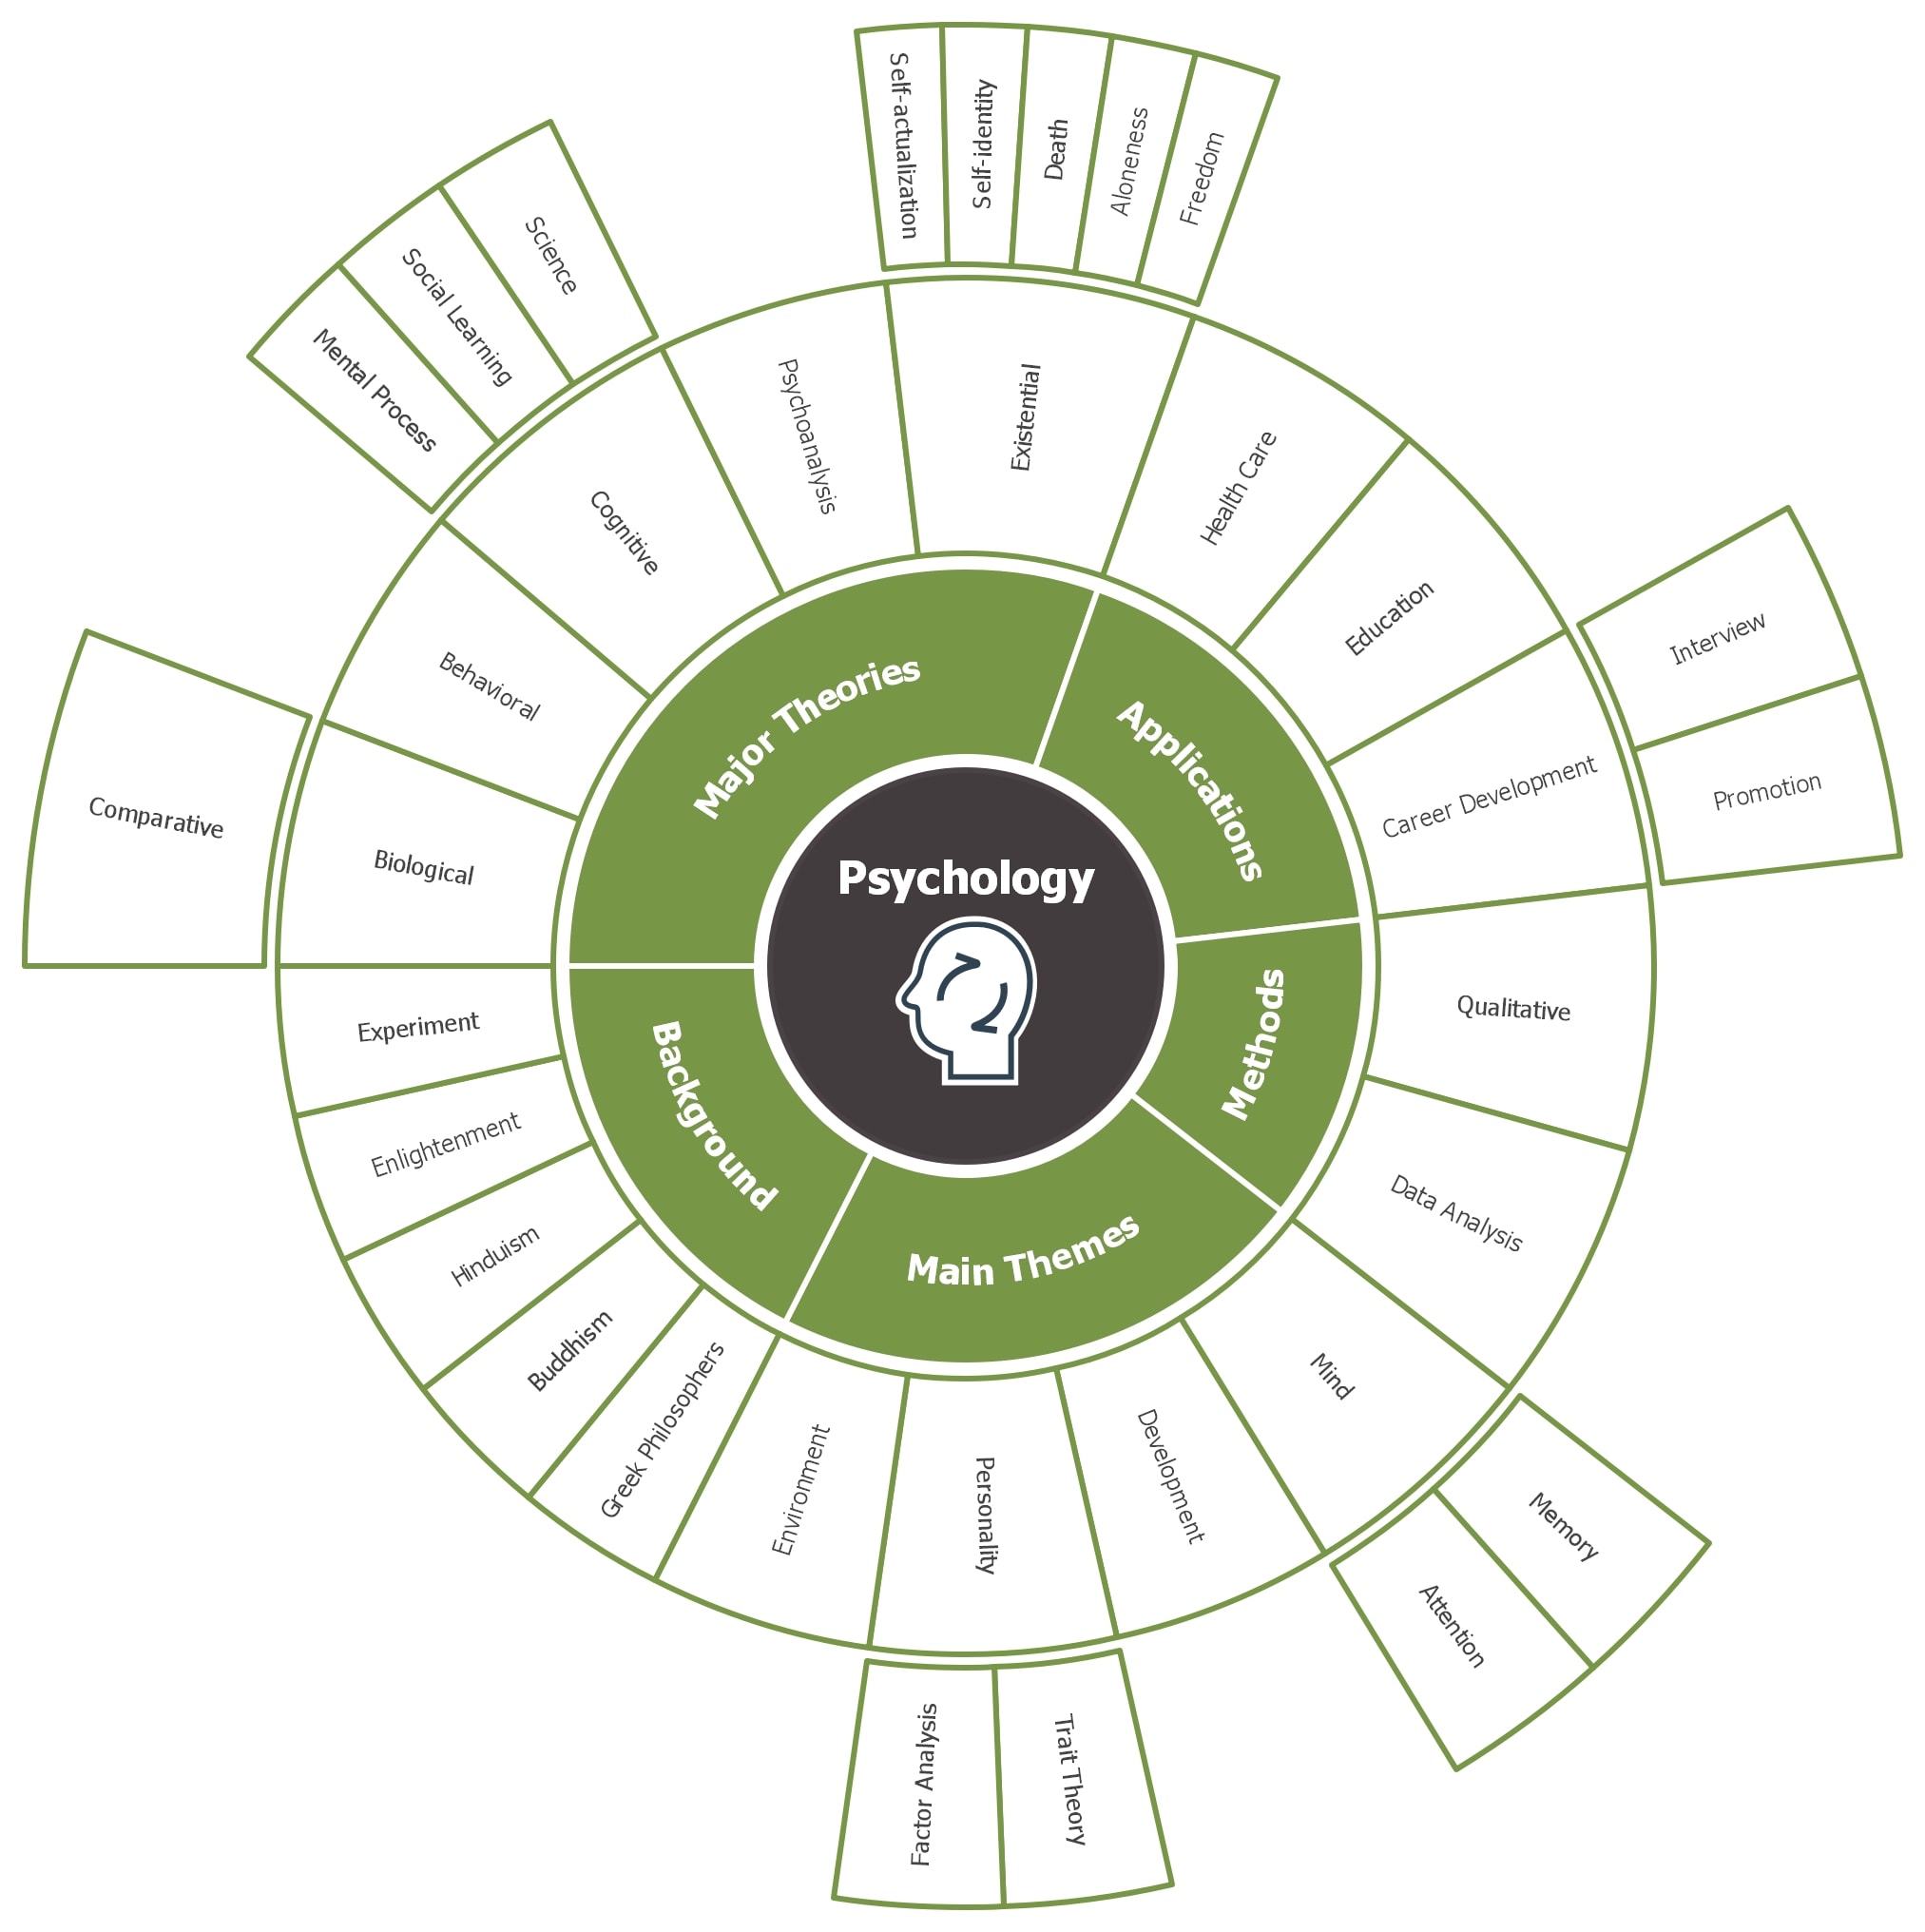
3. Psychology Concepts Sunburst Chart
A psychology concepts sunburst chart organizes the discipline into major branches like cognitive, behavioral, and developmental psychology, which then expand into theories, experiments, and applications. This structure makes it easier for students and professionals to explore the interconnectedness of psychological fields, theories, and real-world practices.
Psychology Concepts Sunburst Chart -
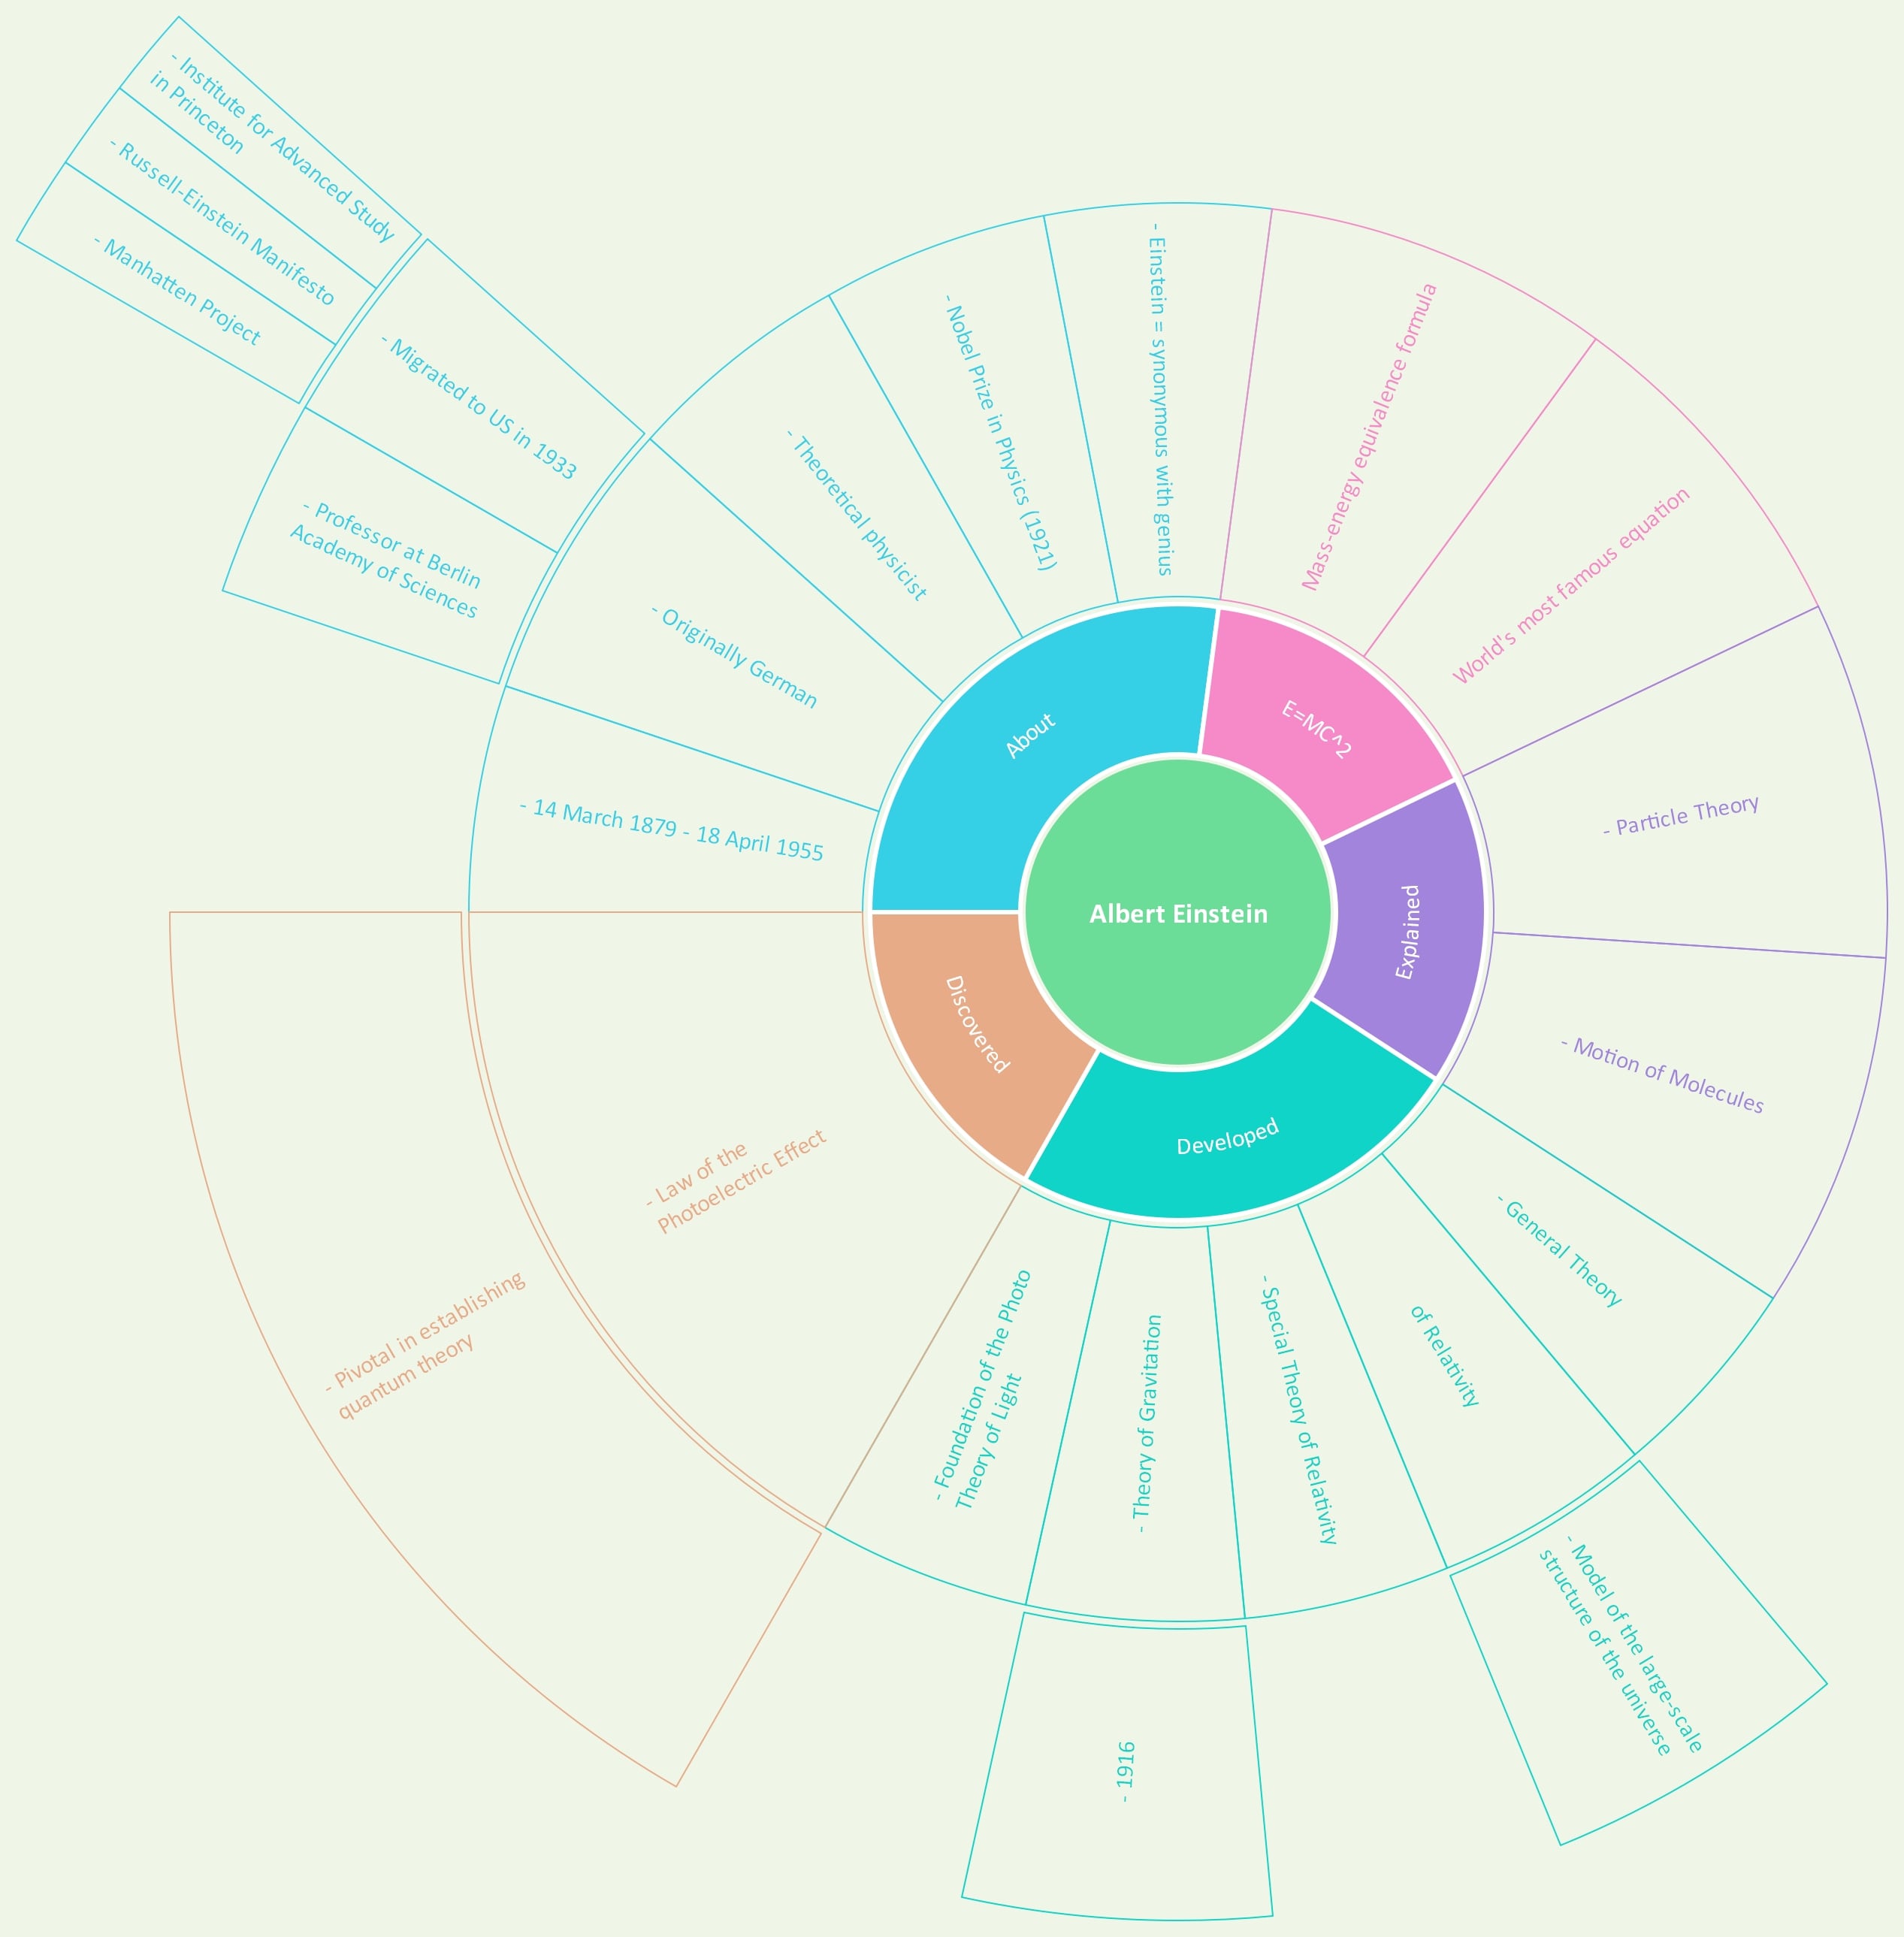
4. Albert Einstein Sunburst Chart
An Albert Einstein sunburst chart maps his life and contributions. The center could be Einstein himself, branching into personal life, education, scientific theories, and legacy. Sub-branches can include relativity, quantum theory contributions, and Nobel Prize achievements.
Albert Einstein Sunburst Chart -
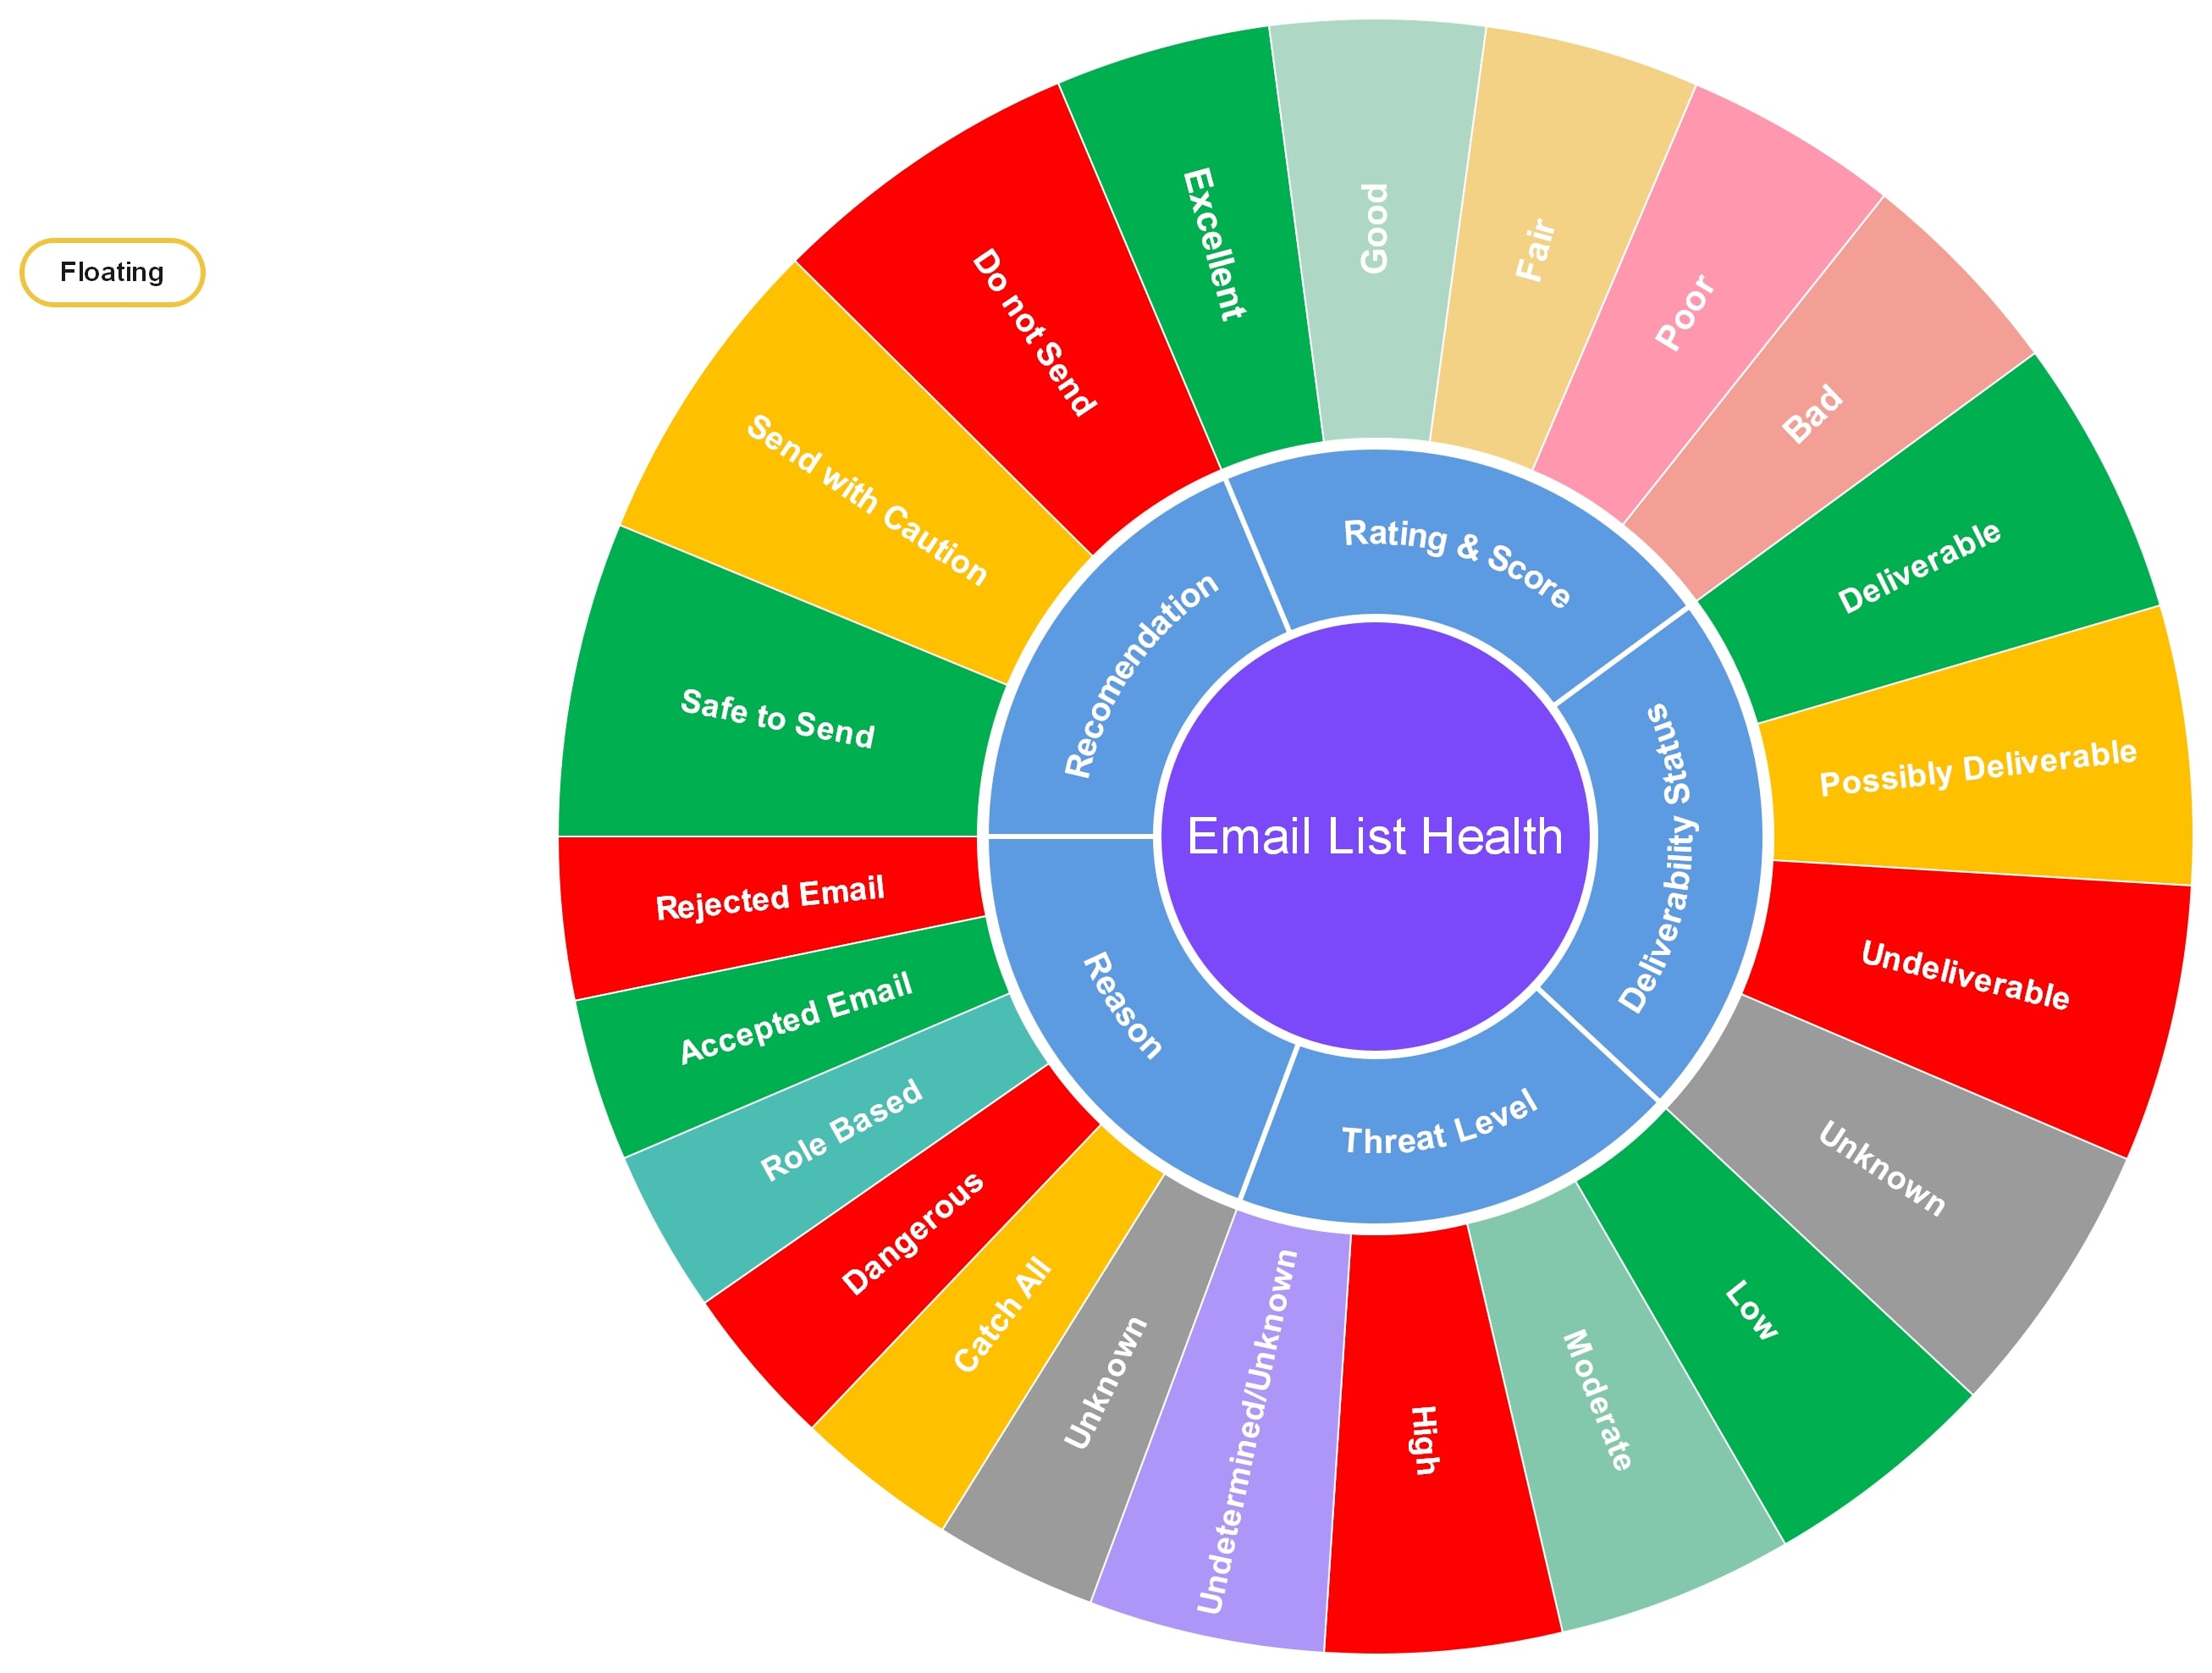
5. Email List Health Sunburst Chart
An email list health sunburst chart displays subscriber engagement levels. The central node is the full email list, branching into active, inactive, and new subscribers. These expand further into click-through rates, open rates, and bounce rates.
Email List Health Sunburst Chart
6. The Four-Quadrant Rule
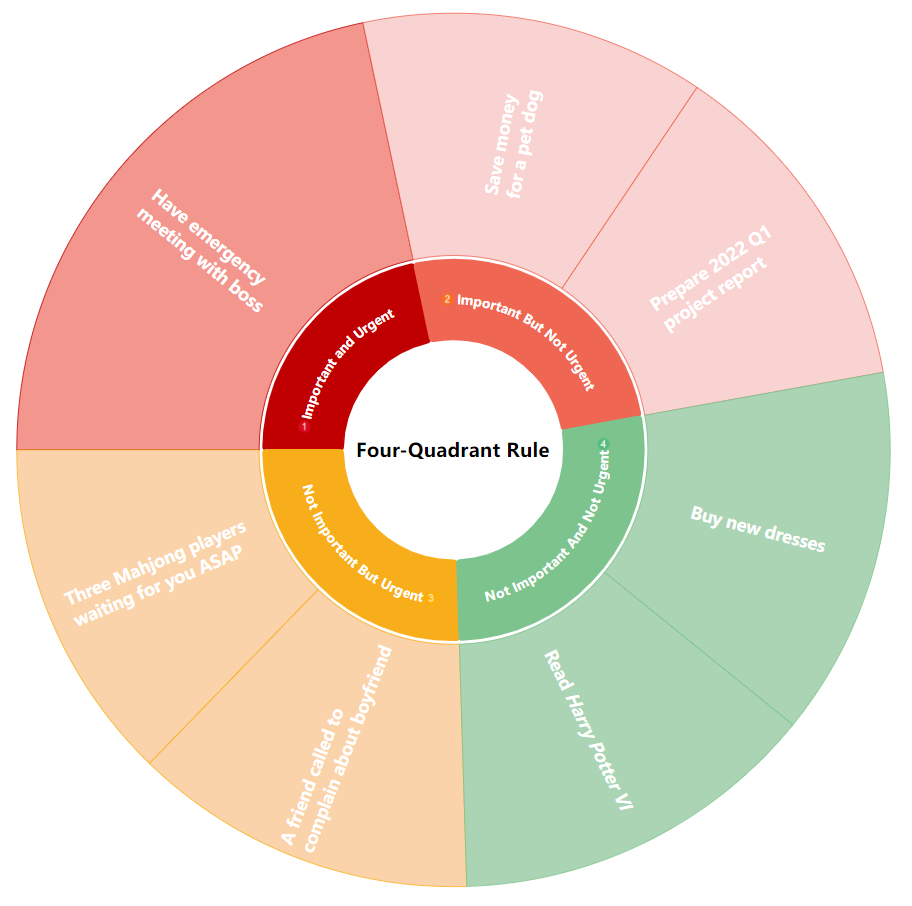
The four-quadrant rule is an important method of time management theory. Manage time efficiently by distinguishing things between important and urgent.
This template prioritizes four categories of things. After correctly distinguishing the type of things, we should follow the priority to deal with the transaction. Note that important but not urgent things have priority over urgent but not important things, because important but not urgent matters have a significant impact on our lives, the existence and development of individuals or businesses and the surrounding environment establishment and maintenance are of great significance.
7. Industry Chain
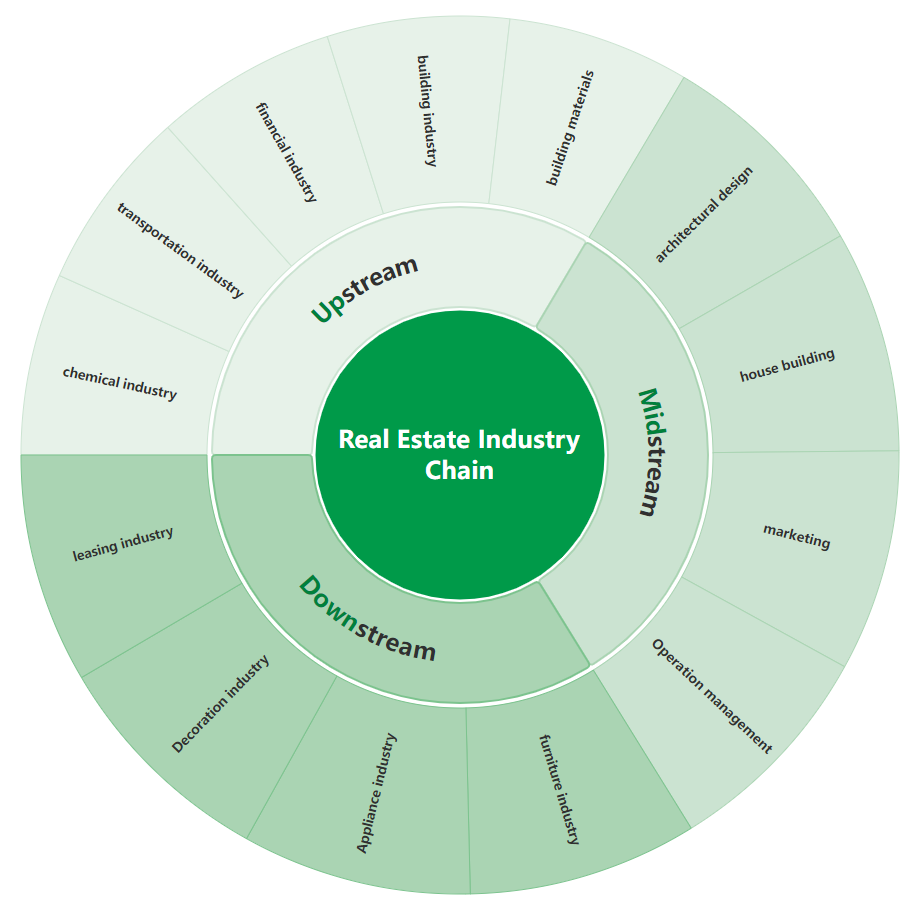
The sunburst diagram can also be used to show an industry chain. The essence of the industry chain is to describe the structure of an enterprise group with some internal connections. It is a relatively macro concept with two-dimensional attributes: structural attributes and value attributes. There are a lot of upstream and downstream relationships and mutual value exchanges in the industrial chain. The upstream links deliver products or services to the downstream links, and the downstream links feed back information to the upstream links. Therefore, treating the industrial chain as a closed circle in the sunburst chart will also stimulate more thinking.
8. Company Structure
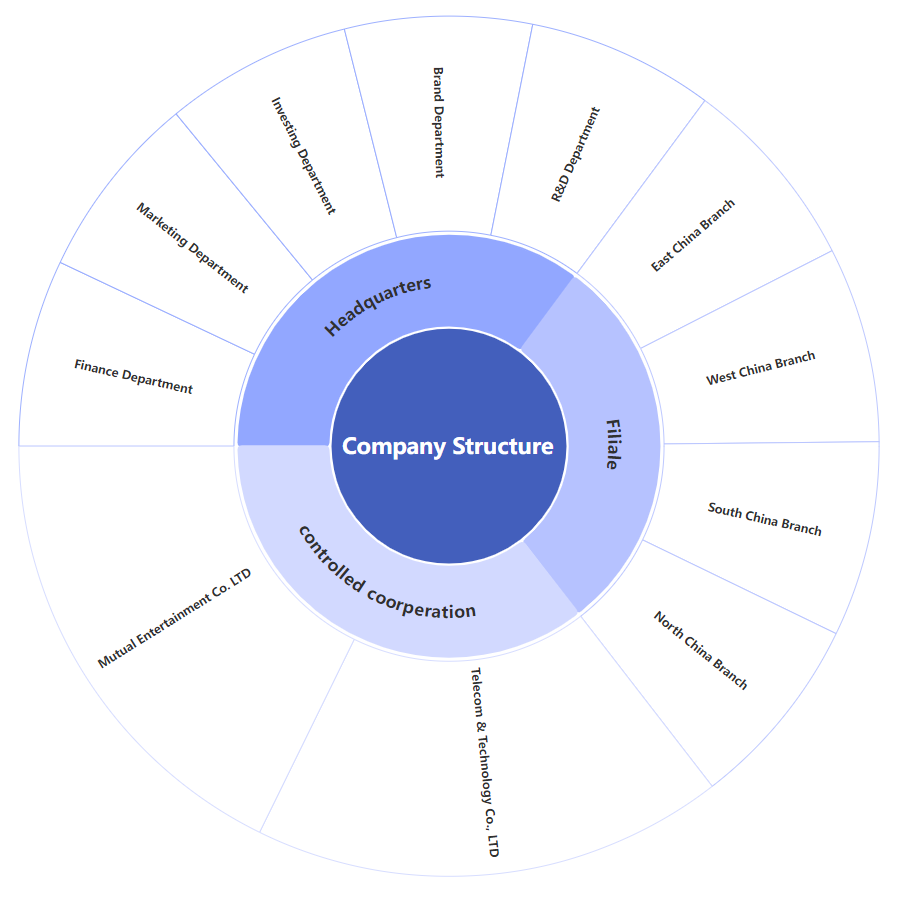
This template is suitable for the departmental structure of enterprises and institutions. As parallel units, the headquarters, branches, and subsidiaries are in the inner ring. Their respective secondary units are located in the outer ring. If you need to set up three-level units or add, abolish, or merge departments, you can also flexibly adjust according to the actual situation.
Benefits of the Sunburst Chart
According to the above, three benefits of the sunburst chart can be seen:
First, the high-quality work comes with refined content. The content of several pie charts can be expressed in one sunburst chart. It can shorten the work time, avoid useless effort, and improve the quality of the work. At the same time, refined content can also stimulate more thinking. The sunburst chart connects the content of all aspects and levels into a whole, giving us a chance to overlook things.
Secondly, the sunburst chart makes the focus more obvious. Whether it reflects the data in proportion to each part or uses different colors, you can always find the key point. Based on this, we can find the focus of the analysis. Reasonable decisions can be made only by getting to the core of the problem.
Finally, there is the inclusiveness of the sunburst chart. In many charts, you must type at least two numbers to form a chart. However, in actual work and study, many expressions do not require numbers. This makes people normally not consider making charts when they encounter textual expressions. Sometimes, only using words to describe the relationship between things can sometimes not be very poor. At this time, the inclusiveness of the sunburst chart is reflected. Because it mainly reflects the relationship between multiple levels of content, even if there is no data, the role of the sunburst map has not been diminished at all.
How to Make a Sunburst Chart?
Creating a sunburst map requires you to have a clear mind. What are the levels and contents of this matter? Just like a tree has a trunk, branches, and leaves, distinguishing everything is the most important preparation before production. Once the idea is complete, the production process will become very simple.
Using Excel
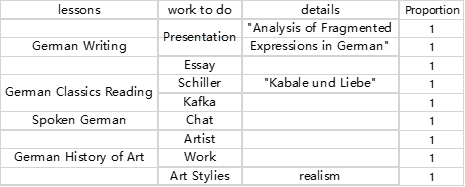
1) Type and select your data. Note that you need to type the parent node's data to the far left. And if you don't have numbers in your content, you also need to add the proportions of each part of the content in the last column.
2) Click Insert > Insert Hierarchy Chart > Sunburst.
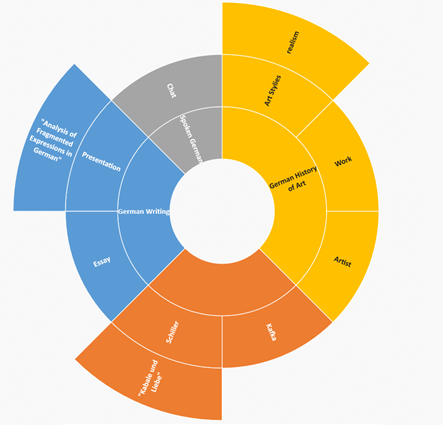
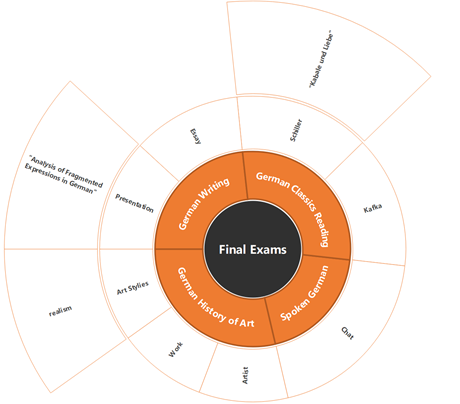
Using EdrawMind
1) Choose a Mind Map in Template Categories, cand reate your mind map.
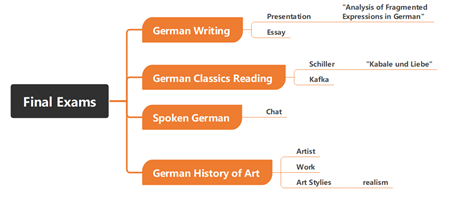
2) Go to Right Panel>Layout>Sunburst chart. One click switches to it. Use shortcuts: press Enter to add topics, press Tab to add subtopics.
3) Style it with colors, themes, and cliparts.


Do more with EdrawMind
The concept of the sunburst chart comes from the traditional pie chart, which enriches the content on the basis of the pie chart and analyzes things more concretely. This allows you to overlook things and devise strategies for specific goals.
The above examples are just for reference when you are dealing with specific content. More importantly, the sunburst diagram provides a way of deconstructing things. In fact, this idea of deconstructing things can be recorded using mind maps. EdrawMind, used in this article, is a software that builds various charts and templates based on mind maps. When you build a mind map, you can convert it into various charts with just one click. You can also create your own templates and share them with users all over the world.
