What is a phase change concept map?
A phase change concept map is generally a graphical illustration of the physical stages of a substance under various conditions of pressure and temperature. It visualizes the changes in the primary states of matter, including solid, liquid, gas, and plasma.
Since these subjects can be challenging to explain by just using sentences and paragraphs, they are mostly presented through a diagram. This is to understand better the process of phase transitions and the connection of every state of matter involved. Initially, a phase diagram will show you lines, graphs, and boundaries among several forms of matter. It follows a clear diagram, but with several graphical tools online graphical tools online today, you can explore how you want to present the concept map, like through a mind map.
Benefits of using a phase change concept map
Phase change concept maps are beneficial to illustrate knowledge in research and other academic-related studies, including science and engineering. It serves as an excellent starting point and roadmap for coming up with materials like ceramics, alloys, cement, semiconductors, cement, or any other element where the concept of phase change is variable.
A phase diagram can be very different from the typical property charts, where some areas of the diagram do not have meanings. Every point in the phase change concept map shows a state point with a distinct constitution, defining the states' fraction, composition, and type.
Also, phase transitions being vast and complex, a concept map surely can come in handy when explaining it to someone or a group of people. It is also an excellent tool for learners to understand how several states of matter transition. Generally, this kind of concept map applies to industry and research, the academe, and possibly in an individual's daily life.
Phase Change Concept Map Templates
You can always explore how to illustrate phase change using a diagram. Here are some examples where you can base your presentations from:
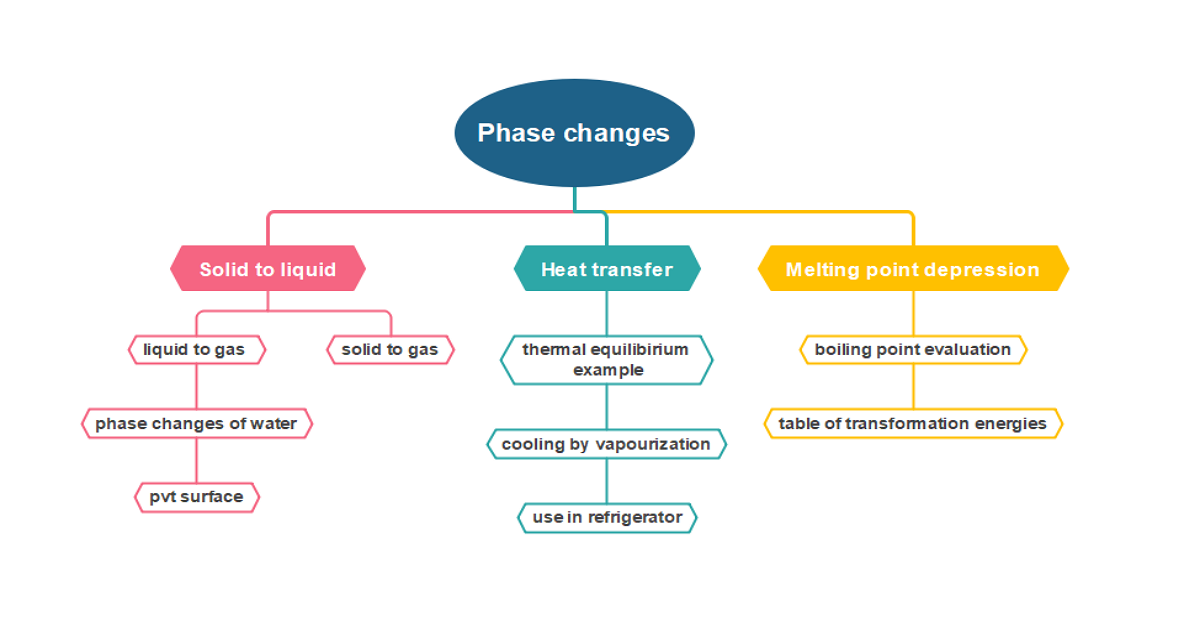
Example 1
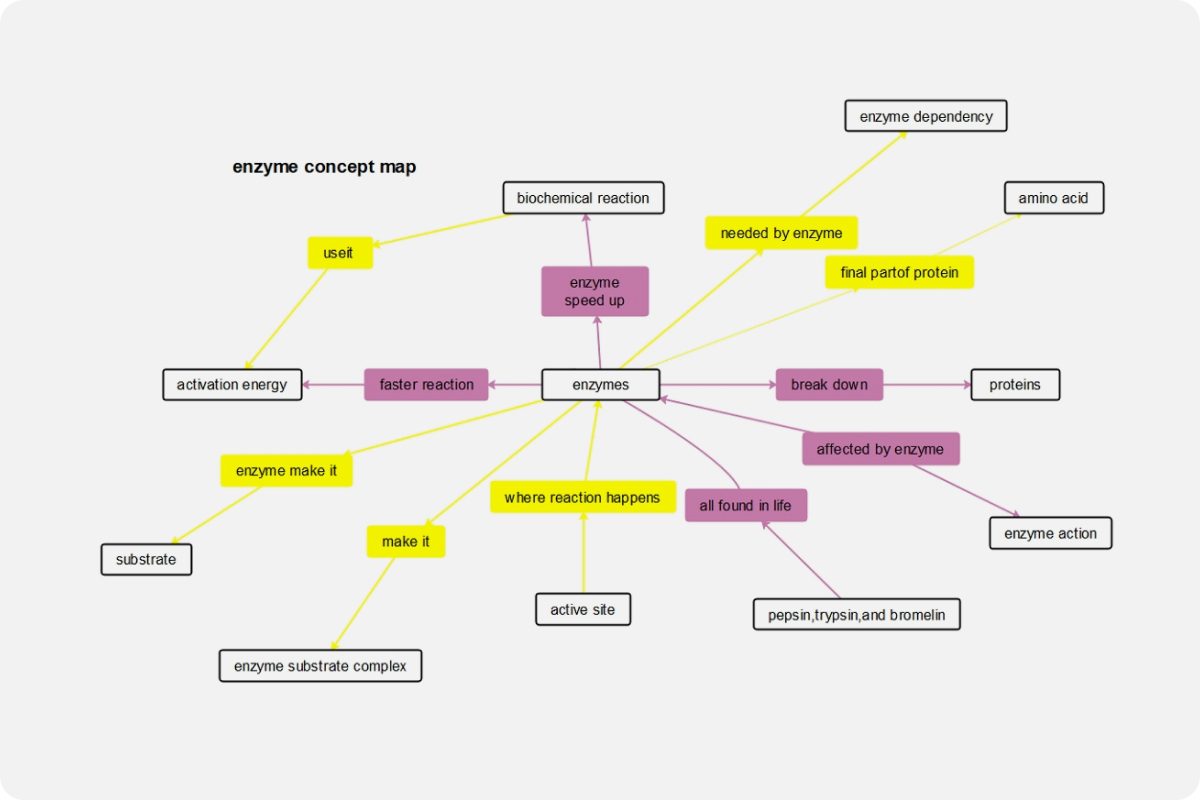
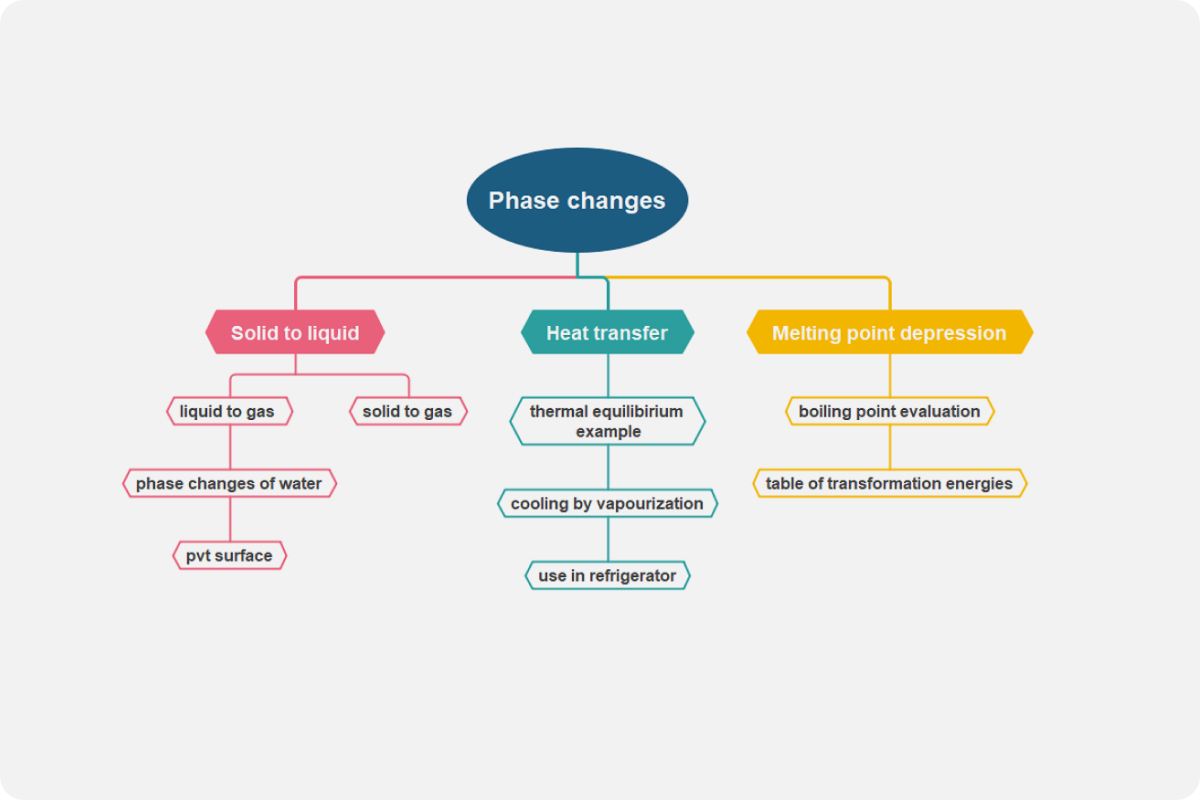
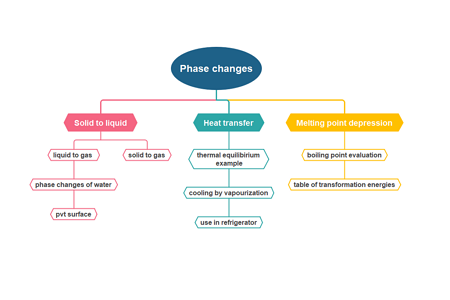
The first example below shows a general illustration of a phase transition with the words 'phase changes' on top of the diagram. The diagram explains how different states of matter change, heat transfer, and the melting point depression.
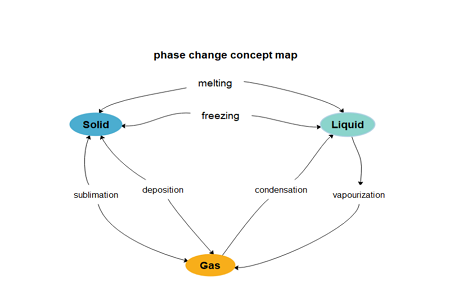
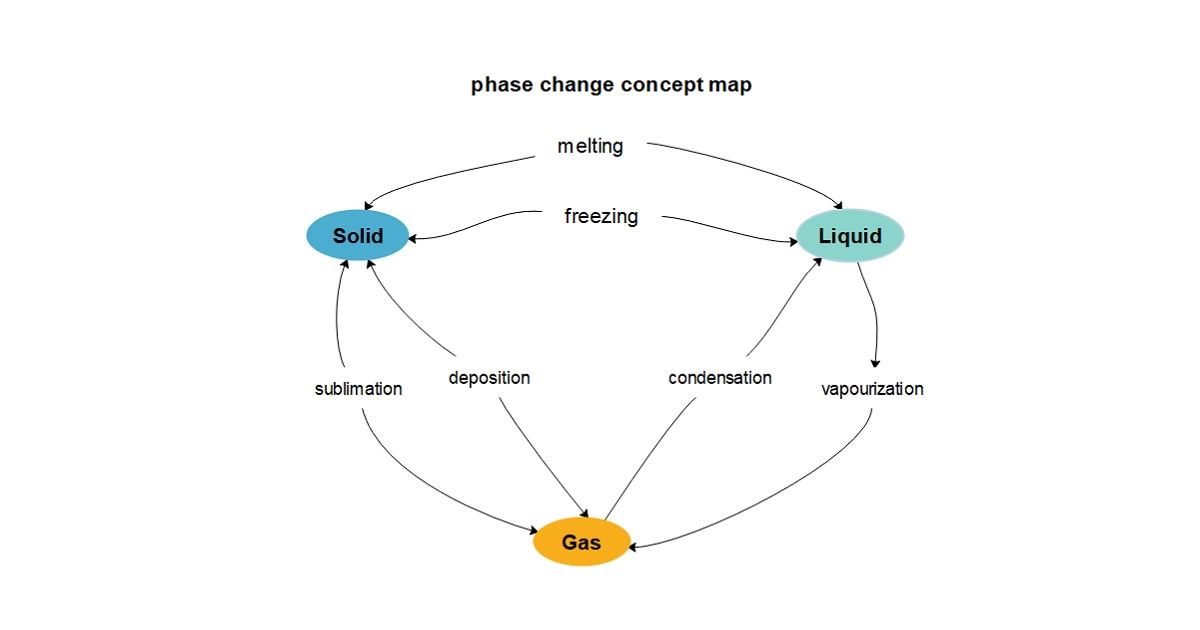
Example 2
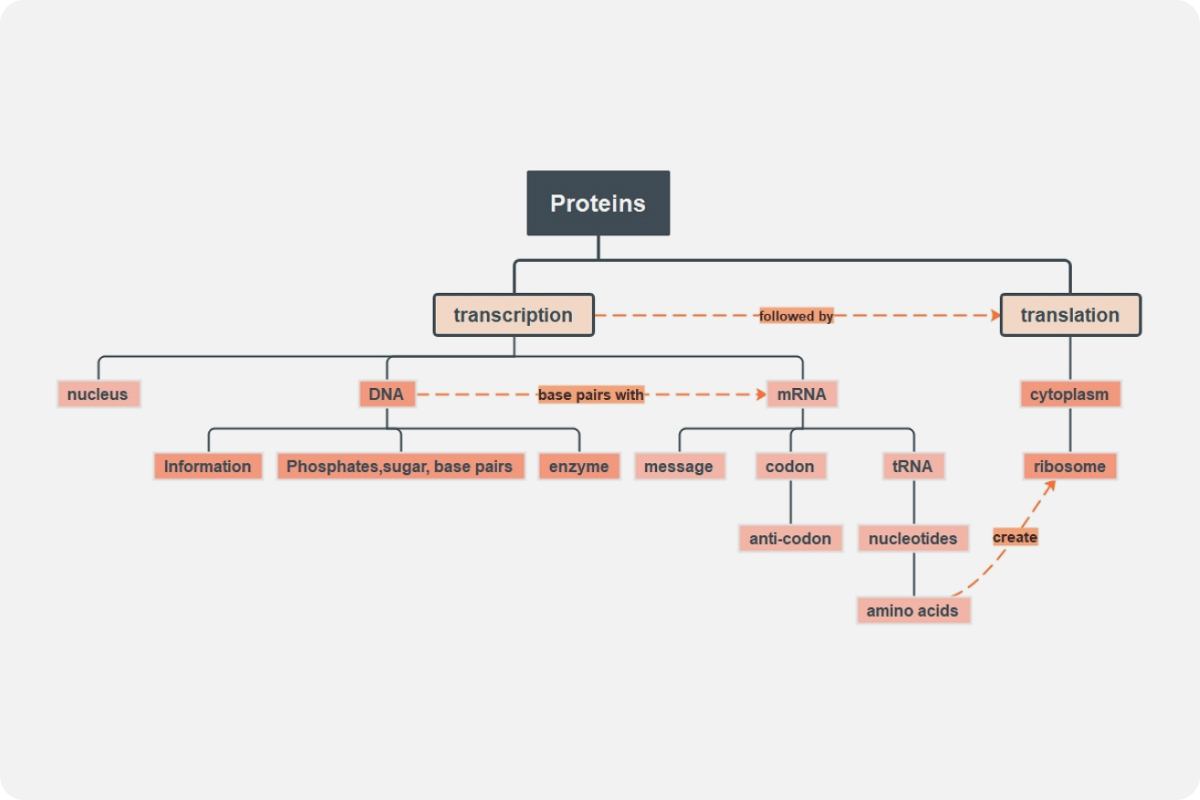
The second example below illustrates the changes of the three states of matter - solid, liquid, and gas. In between transitions are words describing the process of phase changes. This is another simple approach to represent the factors affecting the changes of matter. With the arrows used in the diagram, you can certainly identify in what process solid turns to liquid and the factors affecting liquid to turn into gas.
Most learners and educators also use the phase change concept map to turn diagrams into sentences and paragraphs. Remember that you can explore your creativity in creating phase change concept maps by inserting stickers or images; if that is an easier way for your viewers to understand your illustration.
Why EdrawMind?
EdrawMind is a full-featured collaborative mind mapping and brainstorming tool. It is convenient and helpful for you to use EdrawMind to sort out your thoughts, visualize ideas, take notes, plan projects and more importantly, find solutions to problems.
Users are allowed to insert different kinds of objects into topics and mind maps in EdrawMind, including relationship line, boundary, callout, summary, mark, clip art, picture, hyperlink, attachment, note, comment, and tag. EdrawMind offers you a simple way to create mind maps on Windows, macOS, and Linux. Download the desktop version and try the free online version now!