


A Gantt chart is a visual image of a project's tasks. This chart shows all tasks' sequences, start and end dates, and milestones on a timeline. When it comes to creating a Gantt chart, you can find a number of tools in the market. MS Project is one of them. Every tool has unique features, but this article focuses explicitly on making a Gantt chart in Microsoft Project. You will also see good alternatives to this tool in this read. In addition, it lists key factors to consider when choosing the best Gantt chart maker. Let’s get into more details.
In this article
Part 1: A Step-By-Step Guide to Creating a Gantt Chart in MS Project
If you want to make an elegant Gantt chart instantly, all you need is to follow the steps given below carefully. Let’s look at what each step carries.
Step 1: Open a Project File
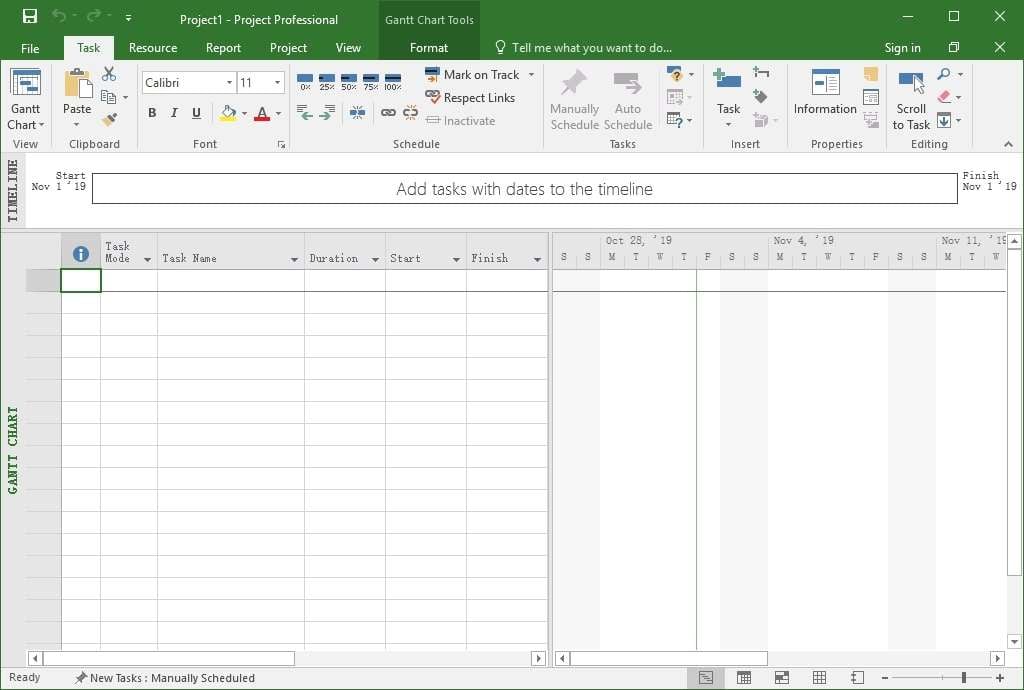
Download, install, and open Microsoft Project on your system. Then, open your project file in the tool. On the main interface, you will see two panes. In the left pane (worksheet), you can enter task names, project duration, start dates, end dates, and resources. On the other hand, the right pane shows your project’s timeline, as shown below.
Step 2: Enter Data
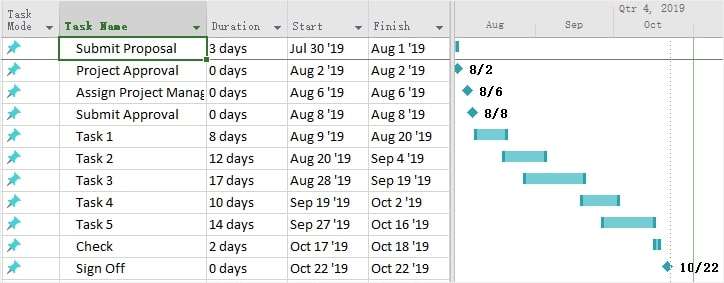
It is time to enter all the data associated with your project in the left pane (worksheet). Once done, MS Project will create a Gantt chart automatically in the right pane. An example is shown below.
Step 3: Add the Gantt Chart Wizard
It is time to add the Gantt Chart Wizard. For this, follow the following steps. It will open a Project Options dialog box.
- Go to the Files menu and choose Options.
- Tap on Customize Ribbon.
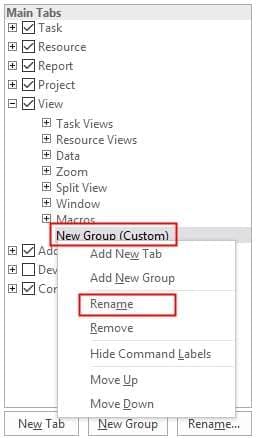
- Now, under Main Tabs in the right column, right-click on a tab where you want to insert Wizard. Then, in the context menu, select Add New Group.
- The group you have just added will be shown as a New Group (Custom). Just right-click and rename the newly added group, as shown below.
Now, under the Choose commands from option, select Commands Not in the Ribbon. You will find it in the left column. Once done, scroll and search for Gantt Chart Wizard. Then, tap on the Add button.
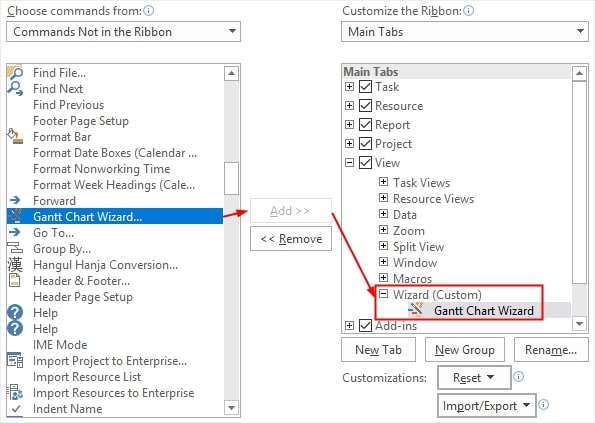
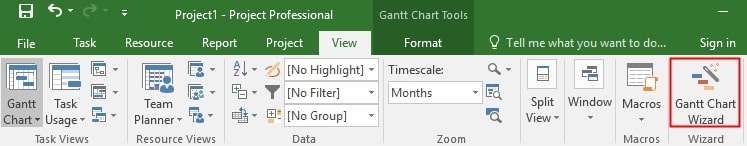
Before adding the Gantt Chart Wizard to the Main Tabs, don’t forget to ensure that you select Wizard (Custom). If not, the Wizard will be inserted into another tab. Tap on OK, and you will see a Gantt Chart Wizard in the View tab, as shown below.
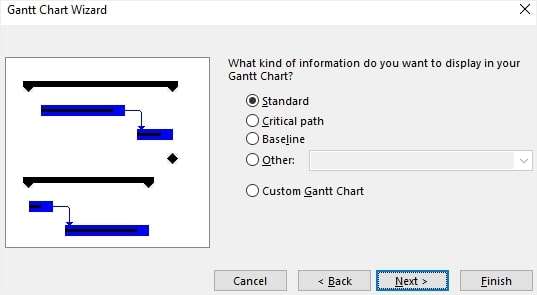
Step 4: Customize Your Gantt Chart
Once the Gantt Chart Wizard is added to the ribbon, you can format your chart with it. Initially, decide on what type of information you want to display on the chart.
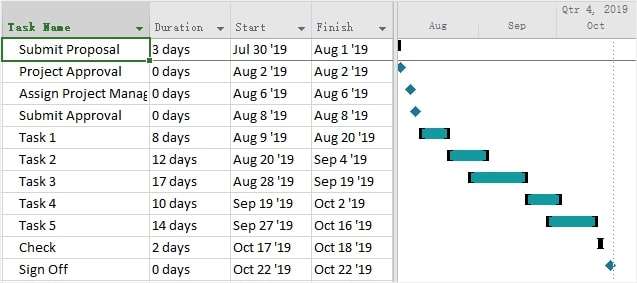
Now, decide what task information you want to display on your Gantt chart. Then, decide whether or not you want to show the links between different dependent tasks. Once done, your Gantt chart will look something similar to the one shown below.
Step 5: Export
Once your Gantt chart is ready, you can simply export and save it to your device. Now, you can share your project with colleagues, team members, or anyone else you want.
Part 2: Create a Gantt Chart Faster and More Effectively with EdrawMind
This section will help you learn to make a Gantt chart using an unmatchable diagramming tool - Wondershare EdrawMind. All you need to do is follow the steps listed below.
Step 1:
Download, install, and open EdrawMind on your device.
Step 2:
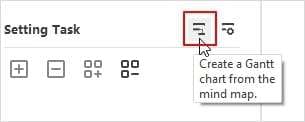
Enter the Advanced tab and choose the Gantt Chart button. Then, in the Task pane, tap on Create Gantt Chart.
Step 3:
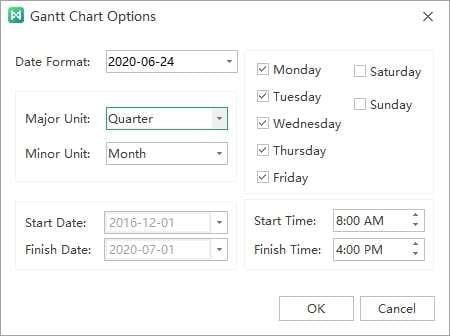
On the Gantt Chart Option Window, you will see different adjustable parameters, such as date format, days, start time, end time, start date, finish date, minor unit, and major unit. In the Advanced tab, hit the Gantt Chart Options button and tap on Set Gantt Chart Options.
Step 4:
Now, choose a specific topic or title you want to assign tasks and open the Task pane. If you want to add a new task, choose Add task info. If you want to add tasks for all titles at the same time, click on Add all task info. The same is the case for removing tasks. Tap on the Delete task info or Delete all task info to remove one task or all tasks, respectively.
Step 5:
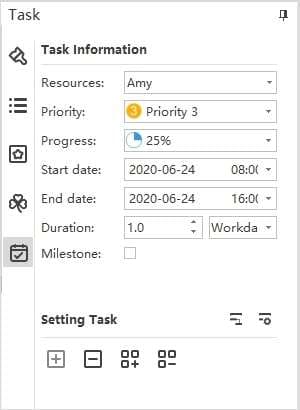
On the task pane, you can set different information. Open all the dropdown options, such as Resources, Priority, Start date, End date, and Duration. Then, check the Milestone box, as shown below.
Step 6:
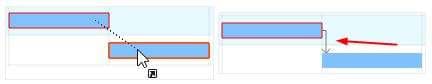
It is time to rename the task, change the start date and finish date, change the task percentage, and build task dependency.
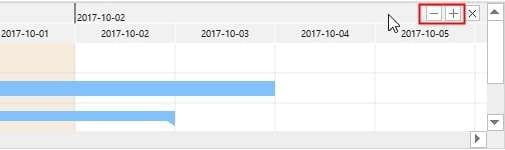
Step 7:
Now, change the date unit by clicking on the “+” or “-” buttons.
Step 8:
Once you are done with making your Gantt chart, you can export it and save it to your device. EdrawMind exports your Gantt charts in PDF file format. To export your chart, tap on the Export Gantt Chart button in the Advanced tab, enter the name of the chart, and hit the Save button.
Part 3: A Few Things to Consider When Choosing a Gantt Chart Maker
There are 6 key things you must keep in mind before you choose a particular Gantt chart-making tool or app.
- First of all, assess your project management needs carefully and see if a Gantt chart maker has the ability to meet them. For example, you can consider your team's requirements and team size. Plus, how do your team members communicate and more?
- The second thing you must consider in a Gantt chart-making tool is its ease of use and user-friendliness. The easier the navigation, the more users it will be able to attract.
- Thirdly, you must ensure that a tool comes with performance-tracking metrics without using any external application or software. If you perfectly track each team member's performance, you can ensure that the project is delivered on time.
- See if the tool can be integrated or connected to other apps, such as email, file-sharing, or messaging apps.
- A good Gantt chart maker always offers full customization options to customize the chart. Considering this factor is also crucial.
- Last but not least, you should look at the pricing policy of the tool and how users respond to it. Plus, always consider whether or not current users recommend the product.
Part 4: List of Other Tools to Make Gantt Charts
MS Project is a decent tool to create a Gantt chart. However, Wondershare EdrawMind is a dedicated tool designed specifically to make these charts and a range of other diagrams businesses often need. If you are looking for more alternatives to these tools to make a Gantt chart easily and instantly, here is a list of utilities you should try.
- MS Word
- MS PowerPoint (Read How-to: Make a Gantt Chart in PowerPoint)
- MS Excel (Read How-to: Make a Gantt Chart in Excel)
- Google Sheets (Read How-to: Make a Gantt Chart in Google Sheets)
- Google Docs
All of the tools listed above are free to use. However, you can purchase the premium packages to explore some unmatchable features.
Ending Note
Project professionals always use a Gantt chart to track the team’s performance and monitor the project's progress. A couple of tools are available to make this diagram, and MS Project is one of them. The discussion above has presented a complete guide to creating a Gantt chart in MS Project.
If you need dedicated software to make Gantt charts and other similar diagrams, try Wondershare EdrawMind. It is available in both online and desktop versions and both offer a free trial for beginners. Moreover, you will see key factors to consider when selecting a good Gantt chart maker and some credible alternatives to MS Project.
