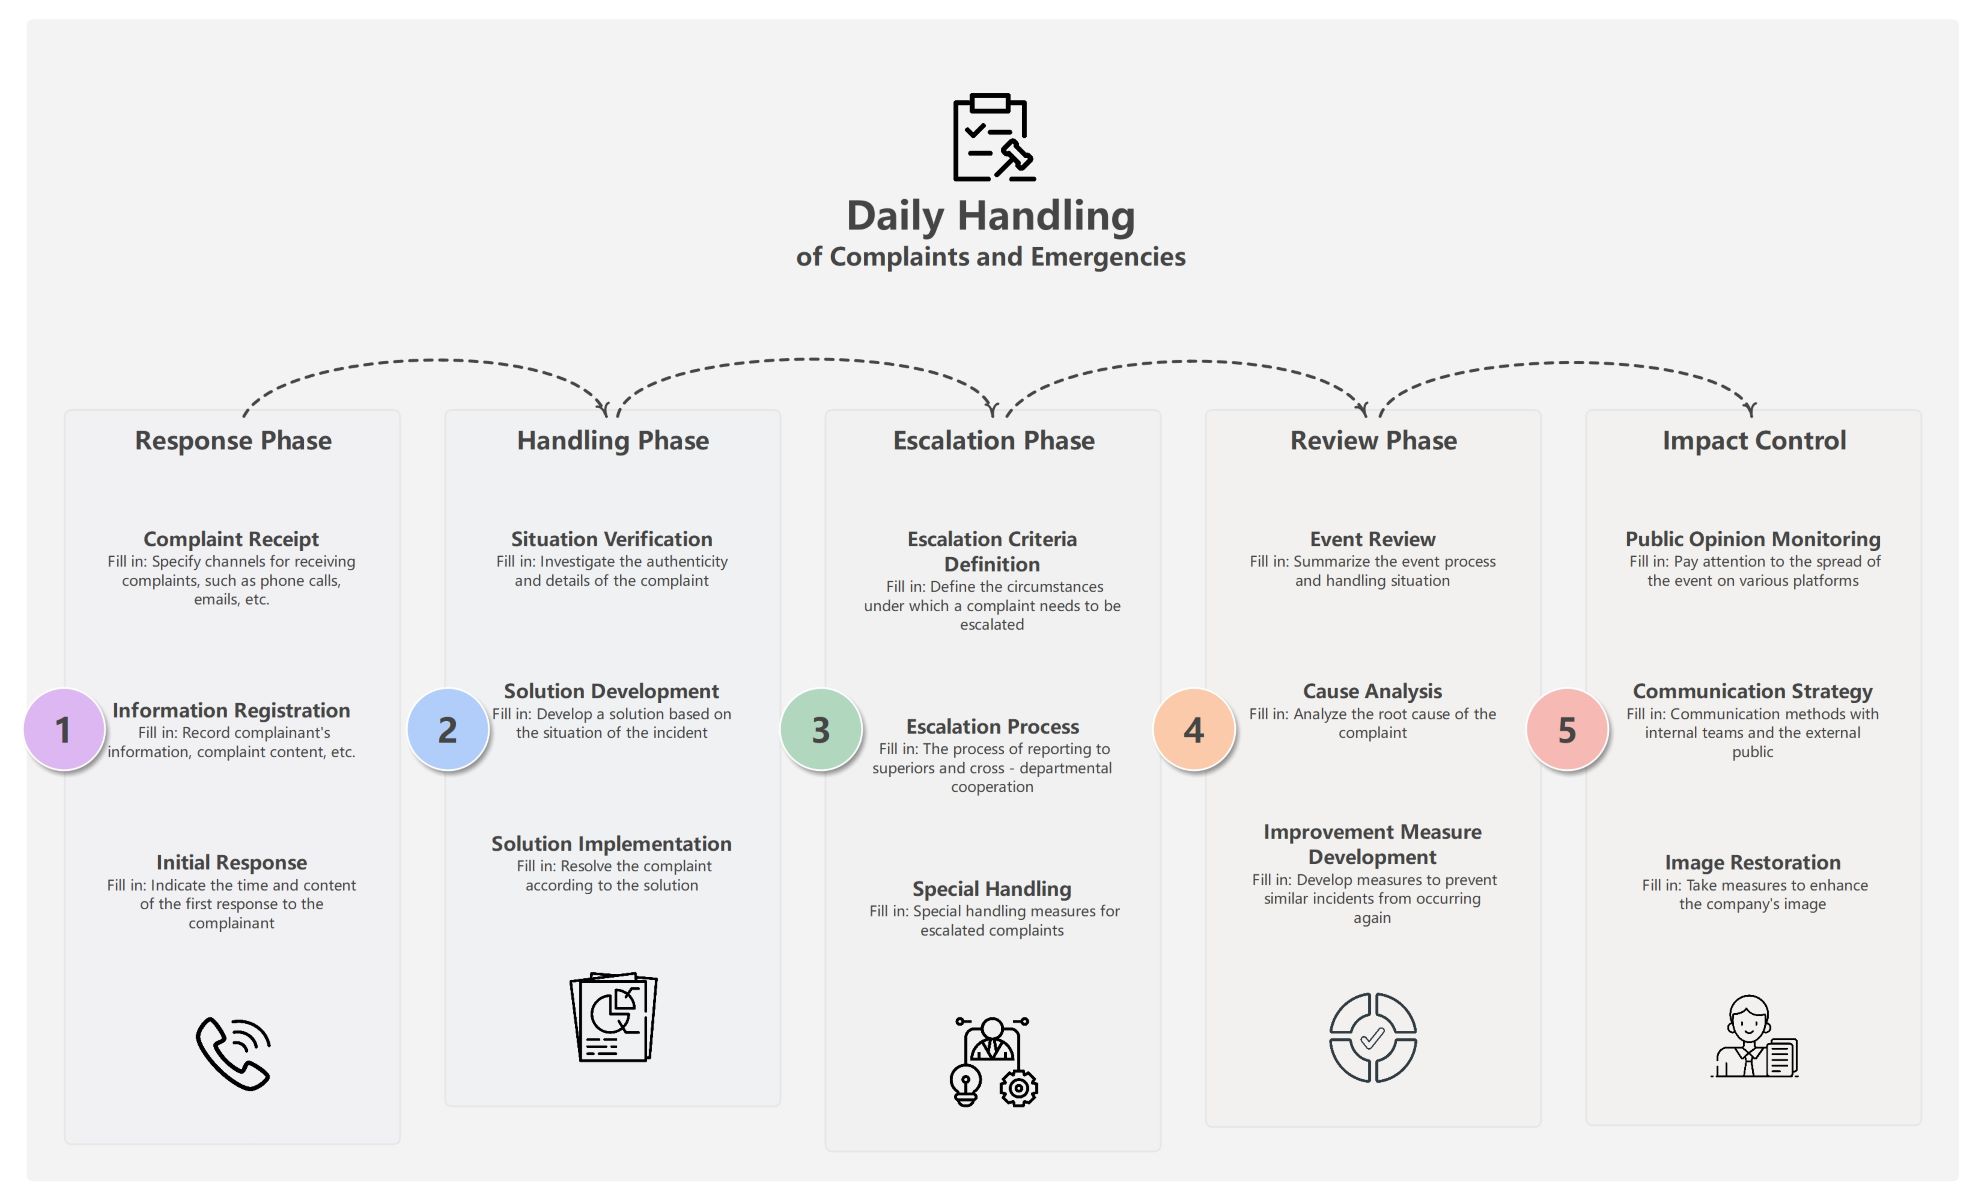
About this user data analysis process template
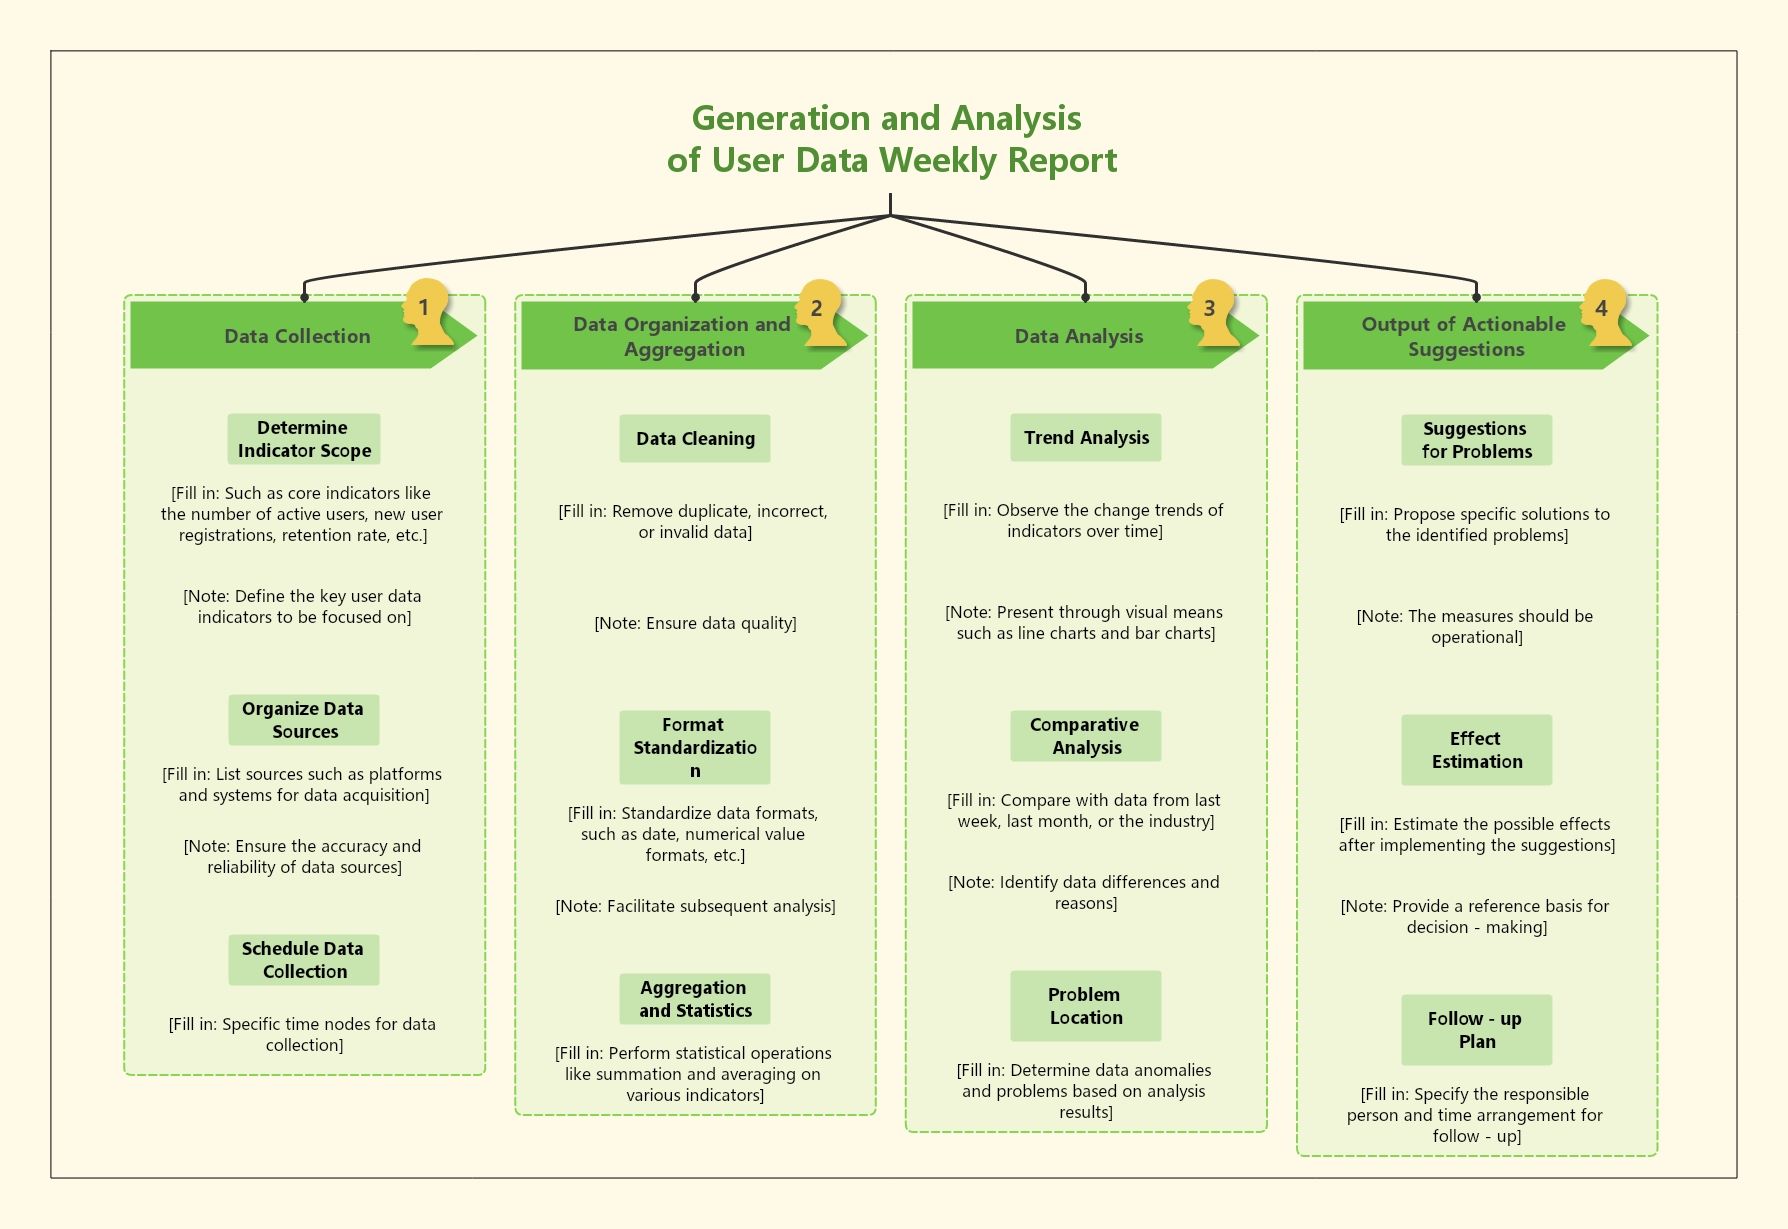
This template outlines the steps for creating a weekly user data report. It guides you through gathering data, cleaning it, and finding insights. Use this to turn complex numbers into actionable business plans for your growth team.
Data Collection
The first stage focuses on gathering high-quality information from the right sources. You must define your core indicators and set a strict schedule. This ensures your weekly data is both accurate and consistent for comparison.
- Determine Indicator Scope
- Organize Data Sources
- Schedule Data Collection
Data Organization and Aggregation
Raw data needs cleaning and formatting before it becomes useful. This stage involves removing errors and standardizing formats to facilitate deep analysis. Proper aggregation allows you to see the big picture through sums and averages.
- Data Cleaning
- Format Standardization
- Aggregation and Statistics
Data Analysis
During this phase, you look for patterns and anomalies within your data sets. Comparing current results with past performance helps you understand growth trends. Visual tools like charts make it easier to locate specific problems in the user journey.
- Trend Analysis
- Comparative Analysis
- Problem Location
Output of Actionable Suggestions
The final step is turning your findings into a concrete plan of action. You must propose specific solutions and estimate their potential impact. Assigning tasks to responsible persons ensures that the insights lead to real business improvements.
- Suggestions for Problems
- Effect Estimation
- Follow-up Plan
FAQs about this Template
-
Why is data cleaning essential in the analysis process?
Data cleaning is a vital step because it ensures your results are accurate. If you use messy or duplicate data, your conclusions will be wrong. By removing invalid entries, you create a reliable foundation for your weekly reports. This process saves time in the long run and helps your team make better decisions based on facts rather than errors.
-
How do actionable suggestions improve business outcomes?
Actionable suggestions bridge the gap between seeing a problem and fixing it. Instead of just looking at charts, your team receives specific tasks to perform. By estimating the effect of these changes, you can prioritize the most important work. This structured approach leads to measurable growth and ensures that your weekly data analysis results in real-world progress.
-
What role does trend analysis play in weekly reporting?
Trend analysis allows you to see how user behavior changes over time. By looking at data from previous weeks or months, you can identify if your growth is steady or declining. This historical view helps you spot seasonal patterns and the impact of recent marketing campaigns. Understanding these trends is key to predicting future performance and planning your long-term strategy.